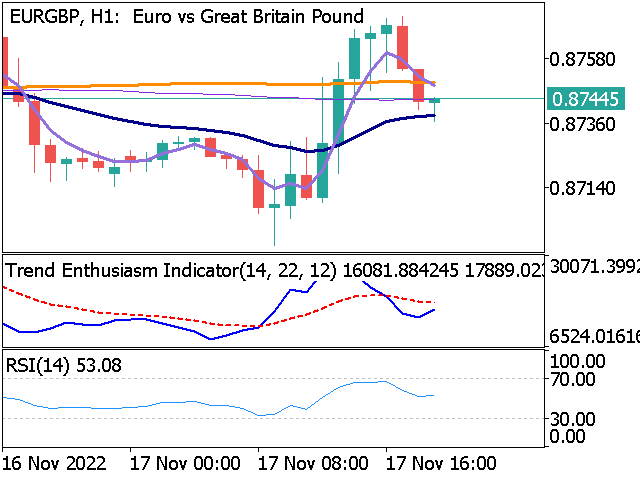
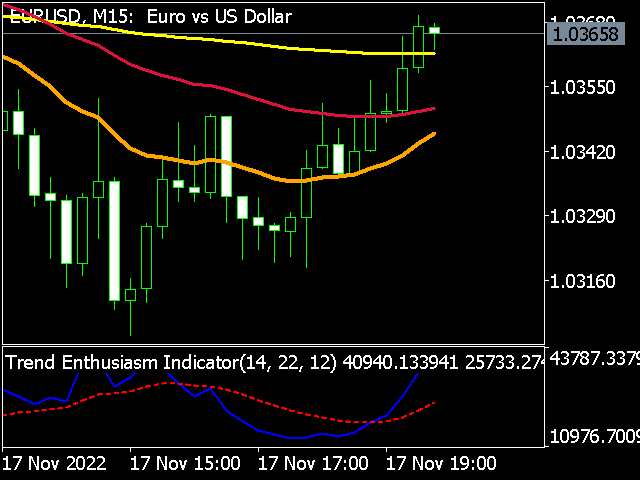
Trend Enthusiasm Indicator
- Indicatori
- eSoftrade
- Versione: 1.0
- Attivazioni: 5
Presentazione del Trend Enthusiasm Indicator (TEI), lo strumento definitivo per massimizzare i profitti sul trading floor.
Questo indicatore innovativo combina il potere dell'analisi delle tendenze con l'eccitazione del sentimento del mercato, fornendo ai trader un vantaggio unico nei mercati finanziari in continua evoluzione.
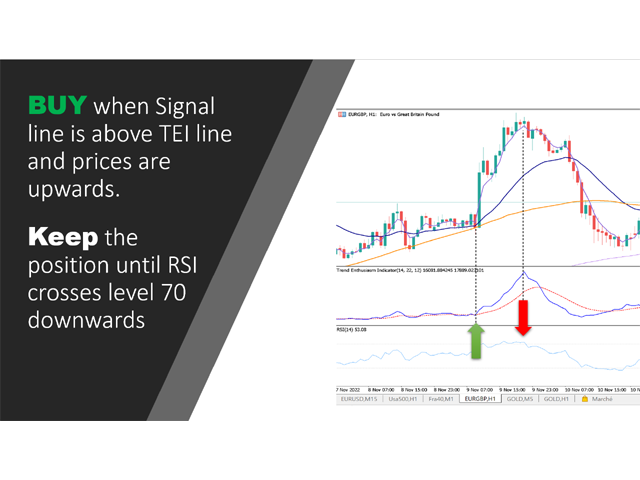
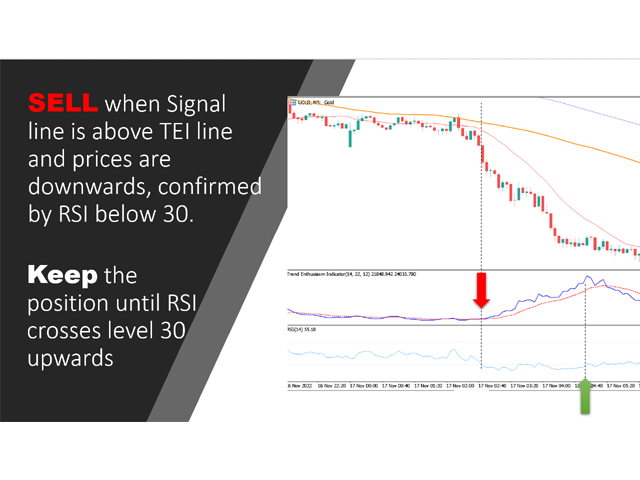
Il TEI utilizza algoritmi avanzati per analizzare l'andamento sottostante di uno strumento finanziario e l'entusiasmo dei trader per identificare opportunità ad alto profitto. Ciò consente ai trader di capitalizzare la forza combinata del trend e del sentimento del trader, garantendo profitti costanti con un rischio minimo.
Che tu sia un professionista esperto o un principiante, il TEI è lo strumento ideale per chiunque cerchi di massimizzare i propri guadagni e stare al passo con il gioco. Provalo oggi e inizia a fare operazioni più intelligenti e redditizie!
L'indicatore funziona in tutti i tempi e non ridisegna.