Linear Regressions Convergence Divergence
- Indicadores
- Vladimir Komov
- Versión: 2.0
- Actualizado: 28 noviembre 2021
- Activaciones: 5
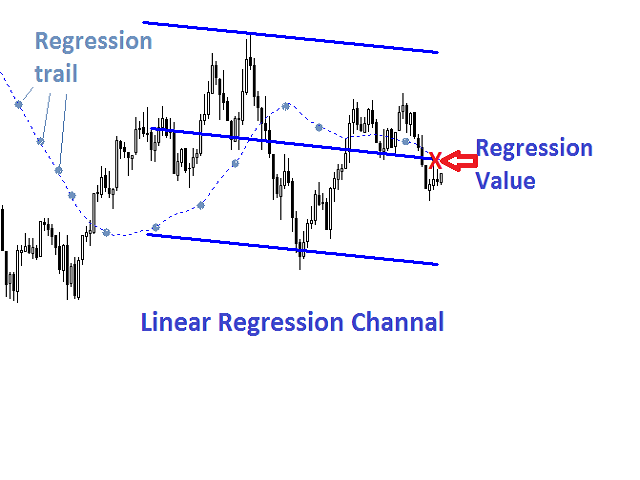
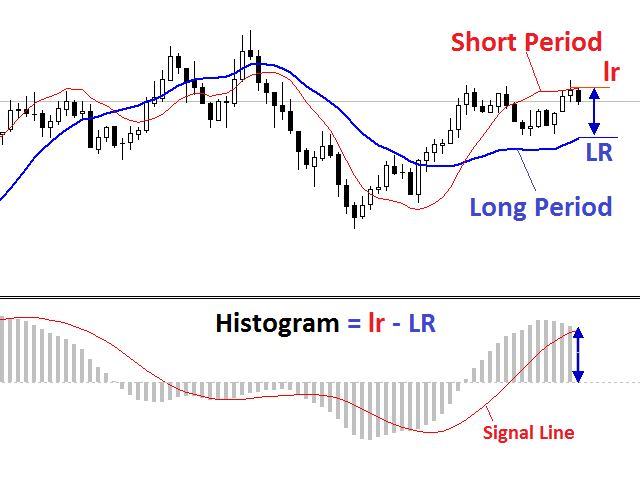
Linear Regressions Convergence Divergence is an oscillator indicator of a directional movement plotted as a difference of two linear regressions with lesser and greater periods. This is a further development of the ideas implemented in the standard MACD oscillator. It has a number of advantages due to the use of linear regressions instead of moving averages. The indicator is displayed in a separate window as a histogram. The signal line is a simple average of the histogram.
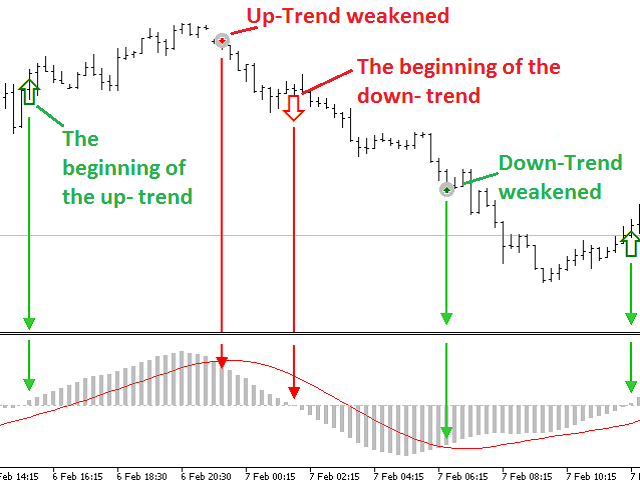
The histogram value above zero specifies an uptrend. The higher the value, the stronger the trend. A value below 0 indicates a downtrend. The lower the value, the stronger the downtrend.
The histogram and signal line crossing indicates a current trend weakening or a reversal.
Equation
LRCD=Lr(n) - Lr(N), where Lr(n) is a linear regression with n period, Lr(N) is a linear regression with N period, N > n.
Advantages
- Linear regression smooths accidental fluctuations and allows the indicator to accurately define trend reversals.
- The signals are lagging in a lesser degree as compared to the standard MACD oscillator.
- Defining areas where the trend is weakening and areas where the directional movement is resumed.
- Any instruments.
- All timeframes.
- No repaints, no recalculation.
Parameters
- Fast Regression period - fast linear regression calculation period.
- Slow Regression period - slow linear regression calculation period.
- Signal Line period - smoothing period when plotting a signal line.
How to use
The indicator can be used in several ways.
- As a trend indication: if the histogram is positive, the trend is growing, a negative value is a sign of a downtrend.
- To assess the trend strength: when the histogram is positive and above its signal line value, the uptrend is gaining momentum. If the histogram is below the signal line, but is greater than zero, the uptrend is weakening. When the histogram is negative and its value is below the signal line, the downtrend is gaining momentum. If the histogram is above the signal line, but is below zero, the downward trend is weakening.
- For signal generation: buy/selling by trend when the histogram crosses the zero level; buying against the downtrend when the signal line crosses upwards in the negative zone. In this case, a signal to close a short position appears; selling against the uptrend at the signal line crossing from top to bottom in case of an uptrend. In this case, a signal to close a long position appears.
- Price and indicator divergence shows the upcoming end of an uptrend. Price and indicator convergence shows the upcoming end of a downtrend.
The following signals are displayed on the chart window:
- up/down arrows mark the histogram sign change hinting at a trend reversal
- Buy/Sell arrows mark the histogram and the signal line crossing
Features
The smaller the Fast Regression period and Slow Regression period values, the more often the indicator will produce trend change signals.
The smaller the smoothing period Signal Line period, the more often the indicator will generate trend weakening signals.
A trend change signal (up/down arrow) is usually preceded by a weakening one (Buy/Sell arrows).
Standard settings 30/60/15.
When changing the settings, it is recommended to remove arrows from the chart window.

