Window Levels
- Indicadores
- Igor Semyonov
- Versión: 1.25
- Actualizado: 17 julio 2024
- Activaciones: 10
Description
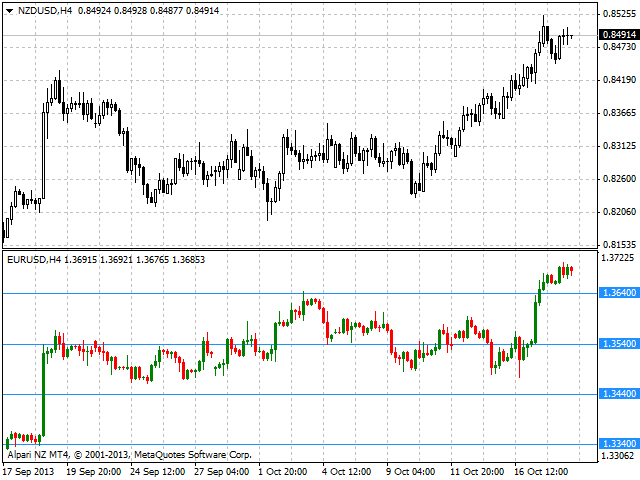
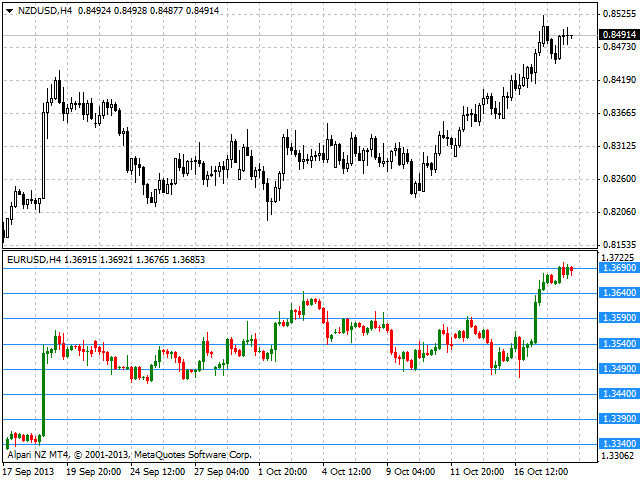
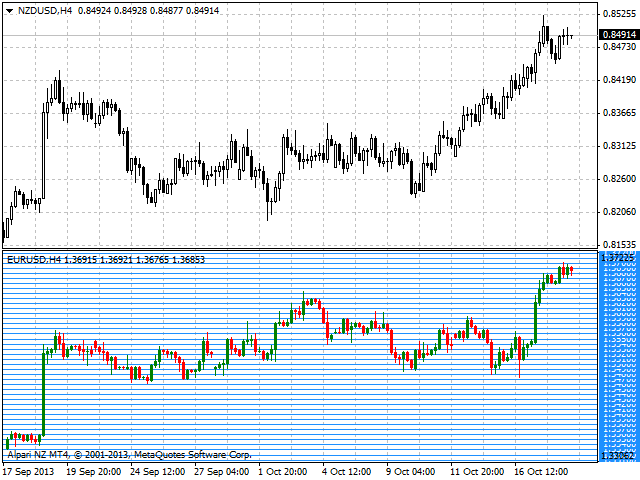
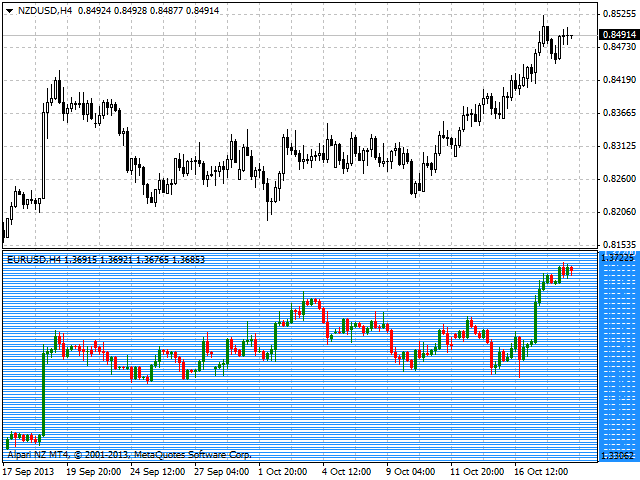
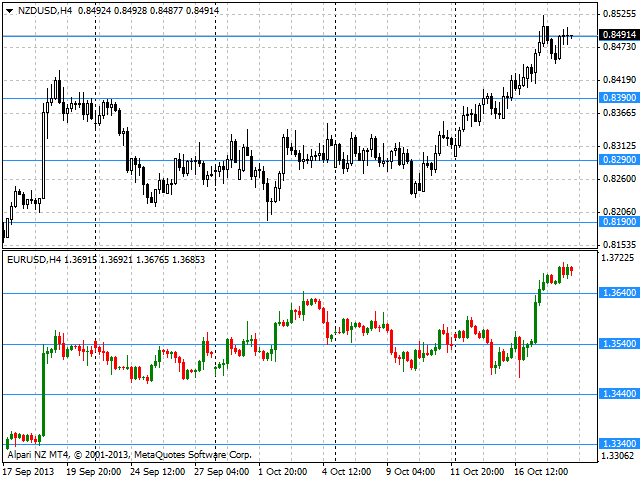
The indicator draws a layout as horizontal levels of round and/or half-round prices in a separate window below the main chart.
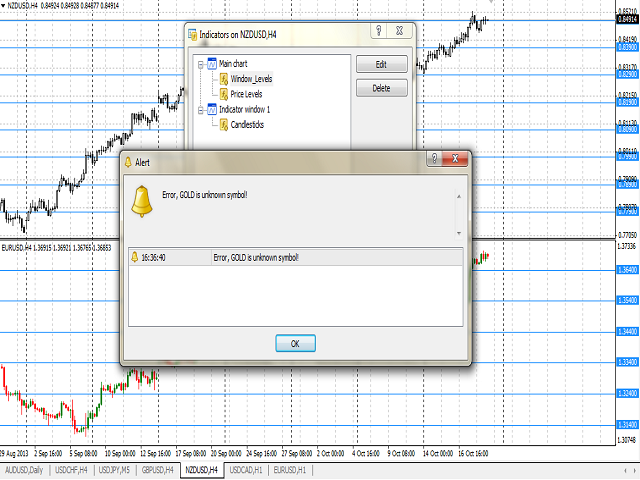
The indicator may be used with any broker, irrespective of the name of the financial instrument since it is necessary to manually enter the name as an input parameter. If you enter a non-existent or incorrect name of a financial instrument, you will receive an error message that this financial instrument is unknown (does not exist).
You can color the indicator lines.
Inputs
- Currency_Name - the name of the financial instrument.
- Calc_Method - level calculation method:
- round price levels.
- half-round price levels.
- Digits_Accepted - a flag to calculate the levels with the number of digits in the quote of the financial instrument:
- true - taking into account the number of digits.
- false - not taking into account the number of digits.
- Level_Color - the color of the displayed levels.
- Bars_Number - the number of bars to be displayed in a separate window.
- Bid_Line_Color - color of the Bid line.
- Bars_Flag - a flag to allow display of the number of bars specified in the Bars_Number parameter:
- true - according to Bars_Number.
- false - maximum available bars in the history.
- Bulls_Color - the color of the bullish candlestick.
- Bears_Color - the color of the bearish candlestick.
By default, the system calculates and builds round price levels, taking into account the number of digits in the quote.
Purpose
The indicator can be used for manual or automated trading in an Expert Advisor. Values of indicator buffers of the double type can be used for automated trading:
- The highest level - the buffer 4.
- The lowest level - the buffer 5.
Intermediate levels should be calculated with a step corresponding to the value of a round or half-round price value taking into account the Digits_Accepted parameter, starting from the values of the lowest and the highest levels obtained from the indicator buffers at the appropriate bar.
Limitations
The indicator requires no less than fifty bars of historical data for an instrument. Otherwise, you will get an error message with an offer to refresh a database of historical data.