Igor Semyonov / Vendedor
Productos publicados
The Five Minutes Tester indicator is a simple tester for the Five Minutes trading system and the Five Minutes Expert EA based on binary options. Its objective is constructing a balance line on history data and calculation of statistics during CALL and PUT transactions performed by Five Minutes trading system. The tester requires at least 100 bars in history for the EURUSD instrument on the five-minute interval. But, in order to receive reliable statistical data, it requires the bars to be downlo
FREE

Descripción Indicador de color para colorear el estado de ánimo del mercado del gráfico de línea en la ventana del instrumento financiero principal. Es útil para buscar las líneas de apoyo y resistencia. Utilidad El indicador puede utilizarse tanto para el comercio manual, como el automático en la composición del asesor. Para el comercio automático se pueden usar los índices de los búfers de indicador del tipo double : la línea creciente - búfer 0, no debe ser igual a EMPTY_VALUE. la línea de
FREE
BOSSTESTER (Binary Option Super System Tester) indicator is a simple tester for BOSS binary options trading system. Its objective is constructing a balance line on history data during CALL and PUT transactions performed by BOSS trading system. The tester requires at least 50 bars in history.
Inputs Initial Balance - initial balance. Investment Rate - investment rate. Losses Cover Ratio - loss coverage ratio. Payout - payout in %. Loss - loss in %. Trading Style - trading style: Super_Conservati
FREE

The Rapid Tester indicator is a very simple tester for the Rapid binary options trading system and Rapid Expert . Its objective is constructing a balance line on history data and calculation of statistics during CALL and PUT deals performed by the Rapid trading system for any of the six financial instruments: EURUSD, EURCHF, GBPUSD, GBPJPY, USDJPY or XAGUSD. The tester requires at least 100 5-minute bars in the history of a trading instrument. However, in order to obtain reliable statistics, you
FREE

The indicator detects the following types of Japanese candlesticks: Doji, Hammer and/or Hanging Man, Shooting Star and/or Inverted Hammer, Spinning Top, Maribozu. The indicator is intended for manual and/or automated trading within an Expert Advisor. There is a possibility to choose colors for bullish and bearish candlesticks. For automated trading, use any indicator buffer of the double type: 0, 1, 2 or 3, whose value is not zero!

The indicator is intended for detecting big (long) and/or small (short) candlesticks. There is possibility of coloring the bullish and bearish candlesticks. The indicator can be used for manual and/or automated trading within an Expert Advisor. The indicator data that can be used for automated trading can be taken from one of four buffers of the double type: 0, 1, 2 or 3. Values must not be equal to zero.

The indicator of DeMark fractals. The indicator can be drawn on the basis of price data and on the basis of a moving average. There is a possibility to color the up and down fractals. The indicator can be used for manual and for automated trading within an Expert Advisor. For automated trading, use any indicator buffer of the double type: 0 - up fractals, 1 - down fractals! Values of the buffers must not be equal to zero. A moving average is drawn on the basis of input parameters: Calc_Method

Description A universal colored indicator Stochastic. The rising and falling lines and the levels of the indicator can be colored. The indicator can be calculated as the standard one on the basis of a price or as a derivative on the basis of the following nineteen other indicators included in the standard package of the MetaTrader 4 terminal: AD - an indicator of accumulation and distribution of volume. OBV - On Balance Volume. Volume - tick volume indicator. AC - indicator of acceleration. AO

Description A universal colored indicator MACD Histo. The rising and falling of the indicator histogram can be colored. The indicator can be calculated as the standard one on the basis of a price or as a derivative on the basis of the following twelve other indicators included in the standard package of the MetaTrader 4 terminal: AD - an indicator of accumulation and distribution of volume. OBV - On Balance Volume. Volume - tick volume indicator. Force - Force Index indicator. MFI - Money Flow

Description A colored universal indicator MACD Line (MA convergence-divergence indicator, shown as a histogram). The rising and falling of the indicator histogram can be colored. The indicator can be calculated as the standard one on the basis of a price or as a derivative on the basis of the following twelve other indicators included in the standard package of the MetaTrader 4 terminal: AD - an indicator of accumulation and distribution of volume. OBV - On Balance Volume. Volume - tick volume i

Description A universal indicator RSI together with moving averages based on it. Depending on the need, moving averages can be disabled. You can color the indicator lines and levels: lines of RSI, moving average lines and thresholds of overbought and oversold levels. The indicator can be calculated as the standard one on the basis of a price or as a derivative on the basis of the following eighteen other indicators included in the standard package of the MT4 terminal: AD - an indicator of accu

Description A universal indicator CCI together with moving averages based on it. Depending on the need, moving averages can be disabled. You can color the indicator lines and levels: lines of CCI, moving average lines and thresholds of overbought and oversold levels. The indicator can be calculated as the standard one on the basis of a price or as a derivative on the basis of the following eighteen other indicators included in the standard package of the MetaTrader 4 terminal: AD - an indicato

Description A multi-purpose multi-colored/multi-symbol indicator, which is a set of standard tools from the MetaTrader 4 terminal. The difference is that below the basic price chart it allows to calculate and build in a separate window any of the twenty indicators in a colored form, painting bulls and bears in different colors, for any financial instrument in accordance with the list below: AD - an indicator of accumulation and distribution of volume. OBV - On Balance Volume. Force - Force Inde

Description A colored universal indicator AO (Awesome Oscillator). The rising and falling of the indicator histogram can be colored. The indicator can be calculated as the standard one or as a derivative on the basis of the following eleven other indicators included in the standard package of the MetaTrader 4 terminal: AD - an indicator of accumulation and distribution of volume. OBV - On Balance Volume. Volume - tick volume indicator. Force - Force Index indicator. MFI - Money Flow Index. ATR

Description A colored universal indicator MACD Classic (MA convergence-divergence indicator) that combines two indicators: MACD Line and MACD Histo. The rising and falling lines, the signal line and the indicator histogram can be colored. The indicator can be calculated as the standard one on the basis of a price or as a derivative on the basis of the following twelve other indicators included in the standard package of the MetaTrader 4 terminal: AD - an indicator of accumulation and distributio

Description The universal colored multicurrency/multisymbol indicator MACD Classic, consisting of two MACD indicators: MACD Line and MACD Histo. The indicator may be used with any broker, irrespective of the name of the financial instrument since it is necessary to manually enter the name as an input parameter. If you enter a non-existent or incorrect name of a financial instrument, you will receive an error message that this financial instrument is unknown (does not exist).
Inputs Currency_Nam

Description A colored universal indicator/oscillator based on crossing moving averages. The rising and falling lines of the indicator histogram can be colored. The combined use of the line and the histogram increases the level of the analysis when making a decision to open or close deals. The indicator can be calculated as the standard Price Oscillator or as a derivative on the basis of the following eleven other indicators included in the standard package of the MetaTrader 4 terminal: AD - an i

Description A universal colored multicurrency/multi-symbol indicator RAVI. Was proposed by T. Chand as a trend indicator. RAVI means Range Action Verification Index. The indicator may be used with any broker, irrespective of the name of the financial instrument since it is necessary to manually enter the name as an input parameter. If you enter a non-existent or incorrect name of a financial instrument, you will receive an error message that this financial instrument is unknown (does not exist).

Description A colored multicurrency/multisymbol oscillator of the market mood. The oscillator is designed for detecting the continuation or change of the market mood prior to its occurrence. An excellent example is the screenshots that show all the features of the oscillator. The oscillator may be used with any broker, irrespective of the name of the financial instrument since it is necessary to manually enter the name as an input parameter. If you enter a non-existent or incorrect name of a fin

Description The indicator determines the appearance of internal bars on the chart, and paints them in accordance with the bullish and/or bearish mood. The indicator can notify of the appearance of a formed internal bar by playing a beep, as well as display the time remaining until the end of the formation of the current bar in the format of <d:h:m:s, where: < means the current bar. d - days. h - hours. m - minutes. s - seconds. The bullish and bearish mood can be colored.
Inputs Sound_Play - a

Description The indicator determines the appearance of the bars that signal of a reversal of current local moods and plays a beep. It also paints these bars in accordance with the bullish and/or bearish priority. You can select the color for bullish and bearish moods.
Inputs Sound_Play - a flag that allows the sound notification.
Use Detection of the reversal bar can be a signal to perform appropriate trading activities. The indicator can be used for manual or automated trading in an Expert A

Description The indicator determines the appearance of bars that notify of the reversal of the current trend, and paints them in accordance with the bullish and/or bearish mood. The indicator can notify of the appearance of a formed reversal bar by playing a beep, as well as display the time remaining until the end of the formation of the current bar in the format of <d:h:m:s, where: < means the current bar. d - days. h - hours. m - minutes. s - seconds. You can select the color for bullish and

Description A universal colored multicurrency/multi-symbol indicator of moving averages: Moving Average, Double Moving Average, Triple Moving Average . The indicator is drawn in a separate window, so below the main trading chart a user can see the development of another financial instrument. It is very useful when considering the combined values of various moving averages for different financial instruments below the main trading chart. The indicator may be used with any broker, irrespective of

Description A universal colored indicator of moving averages: Moving Average, Double Moving Average, Triple Moving Average . The indicator provides various opportunities for the analysis of prices based on different ways of constructing moving averages in the window of the main financial instrument. You can color bullish and bearish moods.
Inputs MA_Type - type of multiplicity: Moving Average. Double Moving Average. Triple Moving Average. MA_Period - the MA period. MA_Method - the averaging met

Description A colored universal multicurrency/multi-symbol indicator Bollinger Bands to be drawn in a separate window below the main financial instrument. The rising and falling line of the main indicator and Bollinger Bands can be colored. The indicator can be calculated based on one of the eleven basic indicators included in the standard package of the MetaTrader 4 terminal: AD - an indicator of accumulation and distribution of volume. OBV - On Balance Volume. Force - Force Index indicator. MF

Description A colored universal multicurrency/multi-symbol indicator Channel to be drawn in a separate window below the main financial instrument. The indicator uses the calculation method of the Price Channel indicator. The rising and falling line of the main indicator and the Channel lines can be colored. The indicator can be calculated based on one of the eleven basic indicators included in the standard package of the MetaTrader 4 terminal: AD - an indicator of accumulation and distribution o

Description Keltner's colored channel indicator,also called STARC band, drawn in the main chart window. The indicator uses the calculation technique of the three drawing options: basic, improved and modified . The first two were proposed by Keltner, the third one - by a successful trader L. Rakshe. You can also search for your own best parameters of the indicator. The upper, middle and lower bands can be colored. The indicator includes the basic analytical tool of the market moods by Keltner. Th

Description A colored universal multicurrency/multi-symbol indicator ZigZag to be drawn in a separate window below the main financial instrument. The indicator may be used with any broker, irrespective of the name of the financial instrument since it is necessary to manually enter the name as an input parameter. If you enter a non-existent or incorrect name of a financial instrument, you will receive an error message that this financial instrument is unknown (does not exist). The indicator can

Description A colored channel indicator Price Channel to be drawn on the main chart of a financial symbol. It can color bullish and bearish moods based on the middle line of the indicator, as well as change the color of the upper and lower lines of the channel.
Purpose The indicator can be used for manual or automated trading in an Expert Advisor. Values of indicator buffer of the double type can be used for automated trading: The middle line of the indicator - buffer 4. The upper line of the

Description Candlesticks is a colored multicurrency/multy-symbol indicator. It shows a financial instrument as a candlestick chart in a separate window below the chart of the main financial symbo. The indicator may be used with any broker, irrespective of the name of the financial instrument since it is necessary to manually enter the name as an input parameter. If you enter a non-existent or incorrect name of a financial instrument, you will receive an error message that this financial instrume

Description Candlestick Tools is a colored multicurrency/multy-symbol indicator. It shows one of four standard indicators as a candlestick chart in a separate window below the chart of the main financial symbol. The indicator is calculated based on one of two indicators included in the standard package of the МetaТrader 4 terminal: CCI - Commodity Channel Index. RSI - Relative Strength Index. The default indicator is Commodity Channel Index. The indicator may be used with any broker, irrespecti

Description Pivot Pro is a universal color indicator of the Pivot Points levels systems. You can select one of its three versions: Standard Old , Standard New and Fibo . The system will automatically calculate the Pivot Point on the basis of market data for the previous day ( PERIOD_D1 ) and the system of support and resistance levels, three in each. It can also display price tags for each level. You can color the indicator lines. Only a method of calculation of the third level of supp

Description The indicator is intended for labeling the chart using horizontal levels and/or half-round prices. The indicator works on any financial instrument regardless of the name and the number of digits. A user can choose colors for the indicator lines.
Input Parameters Calc_Method - method of calculation of the lines: levels of round prices. levels of half-round prices. Digits_Accepted - flag for calculating the levels according to number of decimal places in the quotes of a financial inst

Description A colored universal multicurrency/multi-symbol indicator MACD Line Smart (the indicator moving average convergence divergence is displayed as a histogram) based on double or triple moving average . Comparing to the standard MACD this indicator is more sensitive to what allows generating advance signals. he indicator may be used with any broker, irrespective of the name of the financial instrument since it is necessary to manually enter the name as an input parameter. If you enter a

Description A colored universal multicurrency/multi-symbol indicator MACD Histo Smart (MACD histogram) based on double or triple moving average . Comparing to the standard MACD Histo this indicator is more sensitive to what allows generating advance signals. he indicator may be used with any broker, irrespective of the name of the financial instrument since it is necessary to manually enter the name as an input parameter. If you enter a non-existent or incorrect name of a financial instrument
Description A colored universal multicurrency/multi-symbol indicator MACD Classic Smart that consists of two indicators: MACD Line Smart and MACD Histo Smart. Both indicators are based on double or triple moving average . Comparing to the standard MACD Classic this indicator is more sensitive to what allows generating advance signals. he indicator may be used with any broker, irrespective of the name of the financial instrument since it is necessary to manually enter the name as an input parame

Description A colored multicurrency/multy-symbol oscillator Stochastic Smart based on the double or triple MA . Compared with the standard Stochastic, this oscillator is more sensitive, which allows it to generate signals in advance. The indicator may be used with any broker, irrespective of the name of the financial instrument since it is necessary to manually enter the name as an input parameter. If you enter a non-existent or incorrect name of a financial instrument, you will receive an err

Description A colored multicurrency/multi-symbol pack of four indicators (CCI, Momentum, RSI and StdDev) based on the double or triple MA . Compared with the standard indicators, these versions are more sensitive, which allows them to generate signals in advance. The pack of four indicators may be used with any broker, irrespective of the name of the financial instrument since it is necessary to manually enter the name as an input parameter. If you enter a non-existent or incorrect name of a fi
Description The indicator draws a layout as horizontal levels of round and/or half-round prices in a separate window below the main chart. The indicator may be used with any broker, irrespective of the name of the financial instrument since it is necessary to manually enter the name as an input parameter. If you enter a non-existent or incorrect name of a financial instrument, you will receive an error message that this financial instrument is unknown (does not exist). You can color the indicato

A colored multicurrency/multisymbol indicator Aroon consisting of two lines: Aroon Up and Aroon Down . The main function of the indicator is to predict the trend change. The indicator may be used with any broker, irrespective of the name of the financial instrument since it is necessary to manually enter the name as an input parameter. If you enter a non-existent or incorrect name of a financial instrument, you will receive an error message that this financial instrument is unknown (does not ex
Description A colored multicurrency/multi-symbol Detrend Oscillator. In fact, the oscillator shows how far the current price has gone from a certain equilibrium price expressed in the form of a moving average. If the oscillator is greater than zero, it reflects the value of the price increase. If less - the value of the price fall. The oscillator may be used with any broker, irrespective of the name of the financial instrument since it is necessary to manually enter the name as an input parame

Description A colored multicurrency/multi-symbol Chaikin Oscillator . The oscillator may be used with any broker, irrespective of the name of the financial instrument since it is necessary to manually enter the name as an input parameter. If you enter a non-existent or incorrect name of a financial instrument, you will receive an error message that this financial instrument is unknown (does not exist). You can select the way of the graphic display of the oscillator values, as well as color the g
Tools Standard is a color multicurrency/multi-symbol indicator. It is designed for displaying one of the seven standard indicators on candlestick chart in a separate window under the base symbol chart. The indicator can be calculated based on one of the seven indicators according to user preferences: Bill Williams Alligator Bollinger Bands Envelopes Bill Williams Fractals Moving Average Two Moving Averages Parabolic SAR. Bill Williams Alligator is used by default. The indicator may be used wi

Description Pivot System is a universal color multicurrency/multisymbol indicator of the Pivot Points levels systems. You can select one of its three versions: Standard Old , Standard New and Fibo . It plots pivot levels in a separate window.
The system will automatically calculate the Pivot Point on the basis of market data for the previous day ( PERIOD_D1 ) and the system of support and resistance levels, three in each. It can also display price tags for each level. You can color th

Description A colored multicurrency/multisymbol channel indicator Window Price Channel to be drawn on separate chart window of a financial symbol. It can color bullish and bearish candlesticks and moods based on the middle line of the indicator, as well as change the color of the upper and lower lines of the channel.
Purpose The indicator can be used for manual or automated trading in an Expert Advisor. Values of indicator buffer of the double type can be used for automated trading: The middle
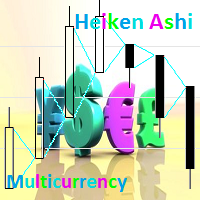
Description Heiken Ashi Multicurrency is a colored well-known multicurrency/multy-symbol indicator. It shows a financial instrument as a smoothed candlestick chart in a separate window below the chart of the main financial symbol. The indicator may be used with any broker, irrespective of the name of the financial instrument since it is necessary to manually enter the name as an input parameter. If you enter a non-existent or incorrect name of a financial instrument, you will receive an error m
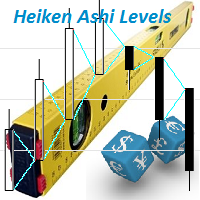
Description The indicator is intended for labeling the chart using horizontal levels and/or half-round prices on Heiken Ashi chart in a separate window. The indicator may be used with any broker, irrespective of the name of the financial instrument since it is necessary to manually enter the name as an input parameter. If you enter a non-existent or incorrect name of a financial instrument, you will receive an error message that this financial instrument is unknown (does not exist). A user can c

Description Heiken Ashi Pivot is a universal color multicurrency/multisymbol indicator of the Pivot Points levels systems on Heiken Ashi candlesticks. You can select one of its three versions: Standard Old Standard New and Fibo . It plots pivot levels in a separate window. The system will automatically calculate the Pivot Point on the basis of market data for the previous day ( PERIOD_D1 ) and the system of support and resistance levels, three in each. It can also display price tags for
Description Keltner's colored multicurrency/multisymbol channel indicator, also called STARC band, drawn in a separate window below the chart of the main financial symbol. The indicator uses the calculation technique of the three drawing options: basic, improved and modified . The first two were proposed by Keltner, the third one - by a successful trader L. Rakshe. You can also search for your own best parameters of the indicator. The upper, middle and lower bands can be colored. The indicator
Description Fibo Levels is an indicator that automatically plots Fibonacci levels. The levels are calculated and plotted over a certain interval using the number of bars specified by the user . When the price achieve one of the target levels (23.6%, 38.2%, 50% or 61.8%) the indicator at the request of the user gives a sound signal and/or sends the message by e-mail. Example of the e-mail notification: Subject: Fibo Up Signal Message: Signal,H1 - Correction of EURUSD reached 23.6% - 2014

Description Fibo Levels is a color multicurrency/multi-symbol indicator that automatically plots Fibonacci levels on a candlestick chart in a separate window below the chart of the main financial instrument. It can be used with any broker, regardless of the name of a financial instrument used because the symbol name must be entered manually as an input parameter. If you enter a non-existent or invalid name of a financial instrument, you will receive an error message saying that the specified f

Description Fibo Levels is a color multicurrency/multi-symbol indicator that automatically plots Fibonacci levels on a Heiken Ashi chart in a separate window below the chart of the main financial instrument. It can be used with any broker, regardless of the name of a financial instrument used because the symbol name must be entered manually as an input parameter. If you enter a non-existent or invalid name of a financial instrument, you will receive an error message saying that the specified

Description Fibo Levels is a color multicurrency/multi-symbol indicator that automatically plots Fibonacci levels on any of the following six standard indicators ( AD, OBV, MA, Momentum, ATR and StdDev ) in a separate window below the chart of the main financial instrument. It can be used with any broker, regardless of the name of a financial instrument used because the symbol name must be entered manually as an input parameter. If you enter a non-existent or invalid name of a financial ins

Description Impulse Pro is an indicator's impulse trading system based on Moving Average and MACD Line . The idea of the impulse system based on Moving Average and MACD Histogram was first offered by Dr. Alexander Elder in his book "Come Into My Trading Room". The system allows users to choose the calculation method (Moving Average and MACD Line) based on a single, double or triple moving average. You can color bullish and bearish moods.
Inputs Calc_Method - Moving Average and MACD Line calcula

Description Impulse Pro is an impulse system based on two indicators - Moving Average and MACD-Histogram . The impulse system was first designed by A. Elder and is featured in his book "Come Into My Trading Room: A Complete Guide to Trading". The system is based on the Moving Average and MACD-Histogram. This product is distinct in that it allows the user to choose the system calculation method (Moving Average and MACD-Histogram) based on a single, double or triple moving average. There is pos
Description The indicator determines the appearance of internal bars on the chart, and paints them in accordance with the bullish and/or bearish mood. The indicator is different from Inside Bar in the same way as Tendency Reversal Bars is different from Reversal Bars . In other words, the indicator defines the appearance of internal bars during a bullish or bearish trend rather than defining their single appearance. The indicator can notify of the appearance of a formed internal bar by playi

Description Impulse Pro Global is an indicator's impulse trading system based on Moving Average and MACD Line Global . The idea of the impulse system based on Moving Average and MACD Histogram was first offered by Dr. Alexander Elder in his book "Come Into My Trading Room". The system allows users to choose the calculation method ( Moving Average and MACD Line Global ) based on a single, double or triple moving average with identification of primary signal of probable reverse of the previ

Description Impulse System Global is an indicator impulse trading system based on Moving Average and MACD Histo Global . The idea of the impulse system which is based on Moving Average and MACD Histogram was first offered by Dr. Alexander Elder in his book "Come Into My Trading Room". The system allows users to choose the calculation method ( Moving Average and MACD Histo Global ) based on a single, double or triple moving average with identification of primary signal of probable reve

Description Impulse Grand Global is an indicator impulse trading system based on Moving Average and MACD Classic Global . The idea of the impulse system based on Moving Average and MACD Histogram was first offered by Dr. Alexander Elder in his book "Come Into My Trading Room". The system allows users to choose the calculation method ( Moving Average and MACD Classic Global ) based on a single, double or triple moving average with identification of primary signal of probable reverse of

Description Impulse Smart is an indicator impulse trading system based on Moving Average and MACD Classic Smart with sound notification . The idea of the impulse system based on Moving Average and MACD Histogram was first offered by Dr. Alexander Elder in his book "Come Into My Trading Room" . The system allows users to choose the calculation method ( Moving Average and MACD Classic Smart ) based on a single, double or triple moving average with identification of primary signal of pr

Description Fibo Levels Custom is a color multicurrency/multi-symbol indicator that automatically plots Fibonacci levels on the Market Mood Oscillator in a separate window below the chart of the main financial instrument. It can be used with any broker, regardless of the name of a financial instrument used because the symbol name must be entered manually as an input parameter. If you enter a non-existent or invalid name of a financial instrument, you will receive an error message sayin

Description Fibo Retracement is an indicator that automatically plots Fibonacci levels in the main chart based on Close prices , which distinguishes it from the Fibo Levels indicator that plots levels based on High/Low prices. Thus, using both indicators provides the trader with the opportunity of determining support and resistance zones by Fibonacci! The levels are calculated and plotted over a certain interval using the number of bars specified by the user. The user can display Fibonacci l

Description Strongest Level is an indicator that automatically plots the nearest levels of strongest resistance and support in the main chart based on prices of the current timeframe. Repeated usage of the indicator with various number of bars creates a system of support and resistance! The indicator calculates and plots levels based on number of bars set by the user. It is recommended to set numbers from a golden ratio according to Fibonacci (13, 21, 34, 55, 89, 144, 233, 377, 610 etc.). Users

Description Strongest Higher Level is an indicator that automatically plots the nearest level of strongest resistance and support in the main chart based on prices of the higher timeframe that differs it from Strongest Level indicator. Repeated usage of the indicator with various number of bars creates a system of support and resistance! The indicator calculates and plots levels based on number of bars set by the user. It is recommended to set numbers from a golden ratio according to Fibonacci
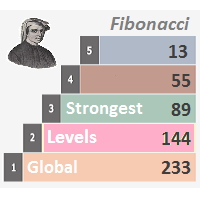
Description Strongest Levels Global is a colored multicurrency/multisymbols indicator that automatically plots a system of the nearest levels of strongest resistance and support in the separate window on one of nine different indicators of the current timeframe in accordance with user's choice. Repeated usage of the indicator with various number of bars creates an extended and confirmed system of support and resistance! The indicator calculates and plots levels based on the number of bars set b

Description DealsCopyMaster opens additional positions on a single symbol in the appropriate amount and tracks them automatically. Opening additional positions may be necessary in case a subscriber starts to lag behind the provider dramatically in the volumes of the currently opened positions and in the volumes difference when provider's balance was at some moment of time equal to the current subscriber's one. In multicurrency/multisymbol mode, the EA is attached to the chart of each financial i
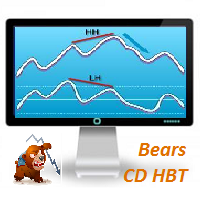
Description Bears CD HBT (Bears Convergence/Divergence High Bottom Top) is a universal analytical bears convergence/divergence indicator between a financial instrument and any of the twenty two standard indicators included in МT4 package. The indicator is the first out of the two possible versions (HBT and HTB) of the bearish convergence/divergence origins. Due to its multiple use feature, the indicator allows you to find convergences/divergences between the price and various standard indicators
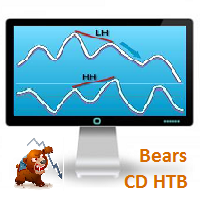
Bears CD HTB (Bears Convergence/Divergence High Top Bottom) is a universal analytical bears convergence/divergence indicator between a financial instrument and any of the twenty two standard indicators included in МetaTrader 4 package. The indicator is the second out of the two possible versions (HBT and HTB) of the bearish convergence/divergence origins. Due to its multiple use feature, the indicator allows you to find convergences/divergences between the price and various standard indicators
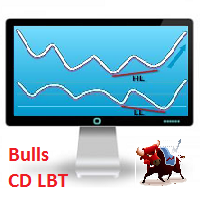
Description Bulls CD LBT (Bulls Convergence/Divergence Low Bottom Top) is a universal analytical bulls convergence/divergence indicator between a financial instrument and any of the twenty two standard indicators included in МT4 package. The indicator is the first out of the two possible versions (LBT and LTB) of the bullish convergence/divergence origins. Due to its multiple use feature, the indicator allows you to find convergences/divergences between the price and various standard indicators
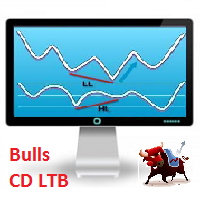
Description Bulls CD LTB (Bulls Convergence/Divergence Low Top Bottom) is a universal analytical bulls convergence/divergence indicator between a financial instrument and any of the twenty two standard indicators included in МT4 package. The indicator is the second out of the two possible versions (LBT and LTB) of the bullish convergence/divergence origins. Due to its multiple use feature, the indicator allows you to find convergences/divergences between the price and various standard indicators
Description A colored multicurrency/multisymbol indicator Aroon Global based on one of the twenty three standard indicators of MT4. The indicator consists of two lines: Aroon Up and Aroon Down . The main function of the indicator is to predict the trend change. The indicator may be used with any broker, irrespective of the name of the financial instrument since it is necessary to manually enter the name as an input parameter. If you enter a non-existent or incorrect name of a financial
Description Price CD HBT (Price Convergence/Divergence High Bottom Top) is a innovative universal analytical bears indicator of convergence/divergence between financial instruments. The indicator is the first out of the two possible versions (HBT and HTB) of the bearish convergence/divergence origins. Due to its multiple use feature, the indicator allows you to find convergences/divergences between the price of main financial instrument and other financial instruments simultaneously. Users can s
Description Price CD HTB (Price Convergence/Divergence High Top Bottom) is a innovative universal analytical bears indicator of convergence/divergence between financial instruments. The indicator is the first out of the two possible versions (HBT and HTB) of the bearish convergence/divergence origins. Due to its multiple use feature, the indicator allows you to find convergences/divergences between the price of main financial instrument and other financial instruments simultaneously. Users can s
Description Price CD LBT (Price Convergence/Divergence Low Bottom Top) is a innovative universal analytical bulls indicator of convergence/divergence between financial instruments. The indicator is the first out of the two possible versions (LBT and LTB) of the bullish convergence/divergence origins. Due to its multiple use feature, the indicator allows you to find convergences/divergences between the price of main financial instrument and other financial instruments simultaneously. Users can se
Description Price CD LTB (Price Convergence/Divergence Low Top Bottom) is a innovative universal analytical bulls indicator of convergence/divergence between financial instruments. The indicator is the second out of the two possible versions (LBT and LTB) of the bullish convergence/divergence origins. Due to its multiple use feature, the indicator allows you to find convergences/divergences between the price of main financial instrument and other financial instruments simultaneously. Users can s
Description Strongest Levels Multicurrency is a colored multicurrency/multisymbols indicator that automatically plots a system of the nearest levels of strongest resistance and support in the separate window on a chart of financial instrument in accordance with user's choice. The indicator calculates and plots levels based on the number of bars set by the user. It is recommended to set numbers from a golden ratio according to Fibonacci (13, 21, 34, 55, 89, 144, 233, 377, 610 etc.). The indicator
Information is a subject of the market mood. Information is objective when it comes from different sources. If information is identical then we may speak about its convergence. Otherwise, we may speak about its conflict (divergence). Indicators and oscillators are the s ources of information of the technical analysis. Bearish CD HBT Osc (Bearish Convergence/Divergence High Bottom Top Oscillator) is a universal analytical bears convergence/divergence indicator between any of the twenty three st
Information is a subject of the market mood. Information is objective when it comes from different sources. If information is identical then we may speak about its convergence. Otherwise, we may speak about its conflict (divergence). Indicators and oscillators are the sources of information of the technical analysis. Bearish CD HTB Osc (Bears Convergence/Divergence High Top Bottom Oscillator) is a universal analytical bears convergence/divergence indicator between any of the twenty three sta
Information is a subject of the market mood. Information is objective when it comes from different sources. If information is identical then we may speak about its convergence. Otherwise, we may speak about its conflict (divergence). Indicators and oscillators are the sources of information of the technical analysis. Bullish CD LBT Osc (Bullish Convergence/Divergence Low Bottom Top Oscillator) is a universal analytical bulls convergence/divergence indicator between any of the twenty three sta
Information is a subject of the market mood. Information is objective when it comes from different sources. If information is identical then we may speak about its convergence. Otherwise, we may speak about its conflict (divergence). Indicators and oscillators are the sources of information for technical analysis. Bullish CD LTB Osc (Bullish Convergence/Divergence Low Top Bottom Oscillator) is a universal analytical bulls convergence/divergence indicator between any of the twenty three stand

Description One of the Dow theory tenets states: "Trends are confirmed by volume". This product is a multicurrency/multisymbol indicator that has been designed to define large and/or small tick volumes according to the mentioned tenet. The indicator may be used with any broker, irrespective of the name of the financial instrument since it is necessary to manually enter the name as an input parameter. If you enter a non-existent or incorrect name of a financial instrument, you will receive an err

Description Pivot Lines is a universal color multicurrency/multisymbol indicator of the Pivot Points levels systems. You can select one of its three versions: Standard Old , Standard New and Fibo . It plots pivot levels for financial instruments in both windows simultaneously. The system will automatically calculate the Pivot Point on the basis of market data for the previous day ( PERIOD_D1 ) or week ( PERIOD_W1 ) and the system of support and resistance levels, three in each. It can also displ

Description Trend Trading is an innovative analyzer designed for trend following trading. The analyzer consists of a trend line, colored bars, arrow pointers and reference information. After completion of the current bar, the trend line, the color of the bar and the arrow pointers are not redrawn. Change of market sentiment can be calculated based on one of the fourteen basic indicators included in the standard package of MT4, it affects the color of the trend line. Optionally colored bars, arro

Description Stoploss Master Expert Advisor helps you to manage the virtual Stop Loss. It replaces the real Stop Loss levels by virtual ones with further trailing according to its own strategy of preserving a reached profit level. This EA is used when following the trend. In multicurrency/multisymbol mode, the EA is attached to the chart of each financial instrument separately and tracks positions only of a certain financial instrument. Management is performed only by market orders. The EA starts

Bears CD HTB Global (Bears Convergence/Divergence High Top Bottom Global) is an analytical bears convergence/divergence indicator (C, D or CD) between a financial instrument and 22 MT4 indicators working on all periods simultaneously. The indicator measures the power of CD for indicators and periods and is the second one out of the two possible versions (HBT and HTB).
Features The analyzer is not a lagging one. It works by ticks and is able to show CD in the main window even in case the MT4 in

Bulls CD LBT Global (Bulls Convergence/Divergence Low Bottom Top Global) is an analytical bulls convergence/divergence indicator (C, D or CD) between a financial instrument and 22 MT4 indicators working on all periods simultaneously. The indicator measures the power of CD for indicators and periods and is the first one out of the two possible versions (LBT and LTB).
Features The analyzer is not a lagging one. It works by ticks and is able to show CD in the main window even in case the MT4 i

The indicator looks for market sentiment impulses and notifies traders accordingly. The indicator can notify of a detected impulse via a sound or alert, as well as emails. You can select the color and display type for bullish and bearish moods. Mood arrow appears on the current bar and remains intact after the bar is formed provided that the bar forming conditions have not changed. At least 100 history bars are required for the indicator operation.
Inputs Period - period of the indicator calcul

The Sprint is an automated scalper EA for high-frequency trading on the financial instrument of the chart it is attached to. For multi-currency trading the EA should be attached to a chart of the corresponding financial instrument. The EA requires two account types, i.e. (MT5/MT4 or MT4/MT4) terminals on one computer. provider. receiver. The EA trades on the receiver account based on the advance market information of the provider.
Input Parameters Symbol Name - name of financial instrument of t
The BOSprint is an automated EA for trading the binary options on the financial instrument of the chart it is attached to. For multi-currency trading the EA should be attached to a chart of the corresponding financial instrument. The EA requires two account types, i.e. two MetaTrader 4 terminals on one computer. provider. receiver. The EA trades on the receiver account based on the advance market information of the provider.
Input Parameters Symbol Name - name of financial instrument of the cha
The BOSS (Binary Option Super System) indicator is a ready TRADING SYSTEM for binary options. The system is designed specifically for the currency market and for the traders who operate on the web-terminals and the MetaTrader 4 platform. This is a counter-trend system, i.e. it is based on the assumption that the price of a traded asset revert sooner or later, and the final trade will cover the previously incurred losses and make a profit. Signals of the system are not redrawn, they appear once t

The Five Minutes indicator is a ready TRADING SYSTEM for binary options. The system is designed specifically for the EURUSD M5 currency market with at least 80% payout and for trades who operate on the web-terminals and the MetaTrader 4 platform. This is a counter-trend system, i.e. it expects the price of traded asset to reverse. Signals of the system are not redrawn, they appear once the formation of the previous bar is completed, and are equipped with a sound notification. For decision-making

Keltner's colored channel indicator, also called STARC band, drawn in an additional chart window for any of the five basic indicators included into the MetaTrader 4 platform. The indicator uses the calculation technique of the three drawing options: basic, improved and modified . The first two were proposed by Keltner, the third one - by a successful trader L. Rakshe. You can search for your own optimal parameters of the indicator. It is also possible to color the upper, middle and lower bands,
The Rapid indicator is a ready binary options trading system . The system is designed for trading on a five-minute interval with the 15-minute expiration and with the payout at least 85%, it is designed for traders using web terminals and MetaTrader 4 platform. Available financial instruments: EURUSD, EURCHF, GBPUSD, GBPJPY, USDJPY and XAGUSD. This is a counter-trend system, i.e. it waits for the price reversal of a traded asset. The indicator signals are not redrawn, they appear after the close
This is a colored multi-timeframe liner regression indicator. It is used for the analysis of price movements and market mood. The market mood is judged by the slope of the linear regression and price being below or above this line.
Purpose The indicator can be used for manual or automated trading within an Expert Advisor. Values of indicator buffer of the double type can be used for automated trading: Regression line of M1 period - buffer 0. Regression line of M5 period - buffer 1. Regression l

The Averaging indicator is designed for traders who trade using averaging techniques or from time to time need to exit a floating loss resulting from erroneous trades by averaging trade results. Averaging of results means closing trades by TakeProfit calculated by the indicator. The indicator takes into account the volume of opened positions! When the number or volume of trades is increased or reduced, the TakeProfit level is automatically recalculated! The recommended TakeProfit level is displa

The Averaging utility is designed for one-time use and is intended for traders who trade using averaging techniques or from time to time need to exit a floating loss resulting from erroneous trades by averaging trade results. Averaging of results means closing trades by TakeProfit calculated by the script. The script takes into account the volume of opened positions! However, if the number or volume of trades is increased, the script should be relaunched on the chart! The total result of trades
This is the linear regression indicator for basic indicators included in the standard package of the MetaTrader 4 terminal. It is used for the analysis of price movements and market mood. The market mood is judged by the slope of the linear regression and price being below or above this line. Regression line breakthrough by the indicator line may serve as a market entry signal. There is possibility of setting the color for bullish and bearish sentiments of the basic indicators as well as plottin

The Hedging indicator is a trading tool, allowing to exit a floating loss that results from erroneous trades by using hedging of trade results. This tool also allows you to solve the problem of negative locking. Hedging of trade results means their simultaneous closing TakeProfit and Stop Loss calculated by the indicator. The indicator takes into account the volume of opened positions! When the number or volume of trades is increased or reduced, the TakeProfit and StopLoss levels are automatical

The HedgingScript utility is a trading tool, allowing to exit a floating loss that results from erroneous trades by using hedging of trade results. This tool also allows you to solve the problem of negative locking. Hedging of trade results means their simultaneous closing TakeProfit and Stop Loss calculated by the script. The script takes into account the volume of opened positions! However, if the number or volume of trades is increased, the script should be relaunched on the chart! The TakePr

Colored indicator of the linear channel based on the Fibonacci sequence. It is used for making trading decisions and analyzing market sentiment. The channel boundaries represent strong support/resistance levels, as they are the Fibonacci proportion levels. Users can select the number of displayed lines of channel boundaries on the chart by means of the input parameters. Attaching multiple instances of the indicator to the chart with different calculation periods leads to displaying a system of c

Colored indicator of the linear channel. Plotting and calculation is based on the Keltner method. It is used for making trading decisions and analyzing market sentiment. The input parameters provide the ability to adjust the channel on the chart. Attaching multiple instances of the indicator to the chart with different calculation periods leads to displaying a system of channels on the chart. Various options for plotting the channel are shown in the screenshots.
Purpose The indicator can be use
This is a color indicator of linear channel for RSI. The indicator and its calculations are based on Keltner's methodology. It is used for making trading decisions and analyzing market sentiment. Input parameters allow the user to customize the channel/channels. The indicator allows drawing two channels on a single chart of the RSI indicator. Possible options for channel drawing are shown in the screenshots.
Purpose The indicator can be used for manual or automated trading within an Expert Advi
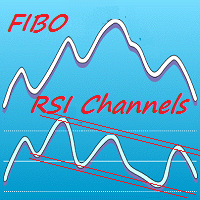
Colored indicator of the linear channels based on the Fibonacci sequence for the RSI. It is used for making trading decisions and analyzing market sentiment. The channel/channels boundaries represent strong support/resistance levels, as they are the Fibonacci proportion levels. Users can select the number of displayed lines of channel boundaries on the chart by means of the input parameters. Various options for using the indicator are shown in the screenshots. The middle of the channel is shown

Your Personal Assistant is an Expert Advisor for semi-automatic Forex trading. It is designed for trades who trade manually or prefer semi-automatic trading. Suitable for trading currencies, metals and CFD. The EA helps the trader in managing the open positions, as well as open deals using virtual pending orders based on graphical horizontal and/or trend lines. Thus, positions can be opened by the following method, including their joint use: Market orders (positions are opened by the trader) Pen
OP CD HBT (Opposite Prices Convergence/Divergence High Bottom Top) is an indicator of convergence/divergence of the bearish sentiment among the mirrored financial instruments. The indicator is the first out of the two possible versions (HBT and HTB) of the bearish convergence/divergence origins. Multiple use of the indicator allows you to find convergences/divergences between the price of the main financial instrument and any other financial instruments simultaneously. Users can select the sell
OP CD HTB (Opposite Prices Convergence/Divergence High Top Bottom) is an indicator of convergence/divergence of the bearish sentiment among the mirrored financial instruments. The indicator is the second out of the two possible versions (HBT and HTB) of the bearish convergence/divergence origins. Multiple use of the indicator allows you to find convergences/divergences between the price of the main financial instrument and any other financial instruments simultaneously. Users can select the sell
OP CD LBT (Opposite Prices Convergence/Divergence Low Bottom Top) is an indicator of convergence/divergence of the bullish sentiment among the mirrored financial instruments. The indicator is the first out of the two possible versions (LBT and LTB) of the bullish convergence/divergence origins. Multiple use of the indicator allows you to find convergences/divergences between the price of the main financial instrument and any other financial instruments simultaneously. Users can select the sell g
OP CD LTB (Opposite Prices Convergence/Divergence Low Top Bottom) is an indicator of convergence/divergence of the bullish sentiment among the mirrored financial instruments. The indicator is the second out of the two possible versions (LBT and LTB) of the bullish convergence/divergence origins. Multiple use of the indicator allows you to find convergences/divergences between the price of the main financial instrument and any other financial instruments simultaneously. Users can select the sell

The Bullet Expert trades automatically. It belongs to level breakout scalping strategies. It is designed for high-speed trading on the financial instrument it is attached to. In order to trade different financial instruments simultaneously the EA must be attached to the chart of each relevant financial instrument. The Expert Advisor trades using pending orders. Different combinations of input parameters, timeframes and financial instruments provide the trader with wide tactical trading opportuni

Fibo Bands is an innovative indicator and an analyzer for trading in the current trend direction. The indicator builds a Fibonacci channel (bands), and consists of a trend line (middle line), channel bands, colored bars and reference information. After completion of the current bar, the trend line, the channel and the color of the bar are not redrawn. However, the channel width can be changed after a reset or restart of the indicator depending on volatility. The channel is built in accordance wi
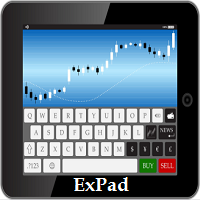
ExPad - a trade panel for comfortable trading on financial markets. Suitable for trading any financial instruments. In general, the panel is able to perform the following functions: Open and reverse of deals Operation with visible and hidden StopLoss and TakeProfit Independent management of visible and hidden StopLosses Profit protection due to Breakeven and Trailing Stop Choice of technique for Trailing Stop Distance from market price Moving Average Bolinger Bands Middle Line High and Low pri
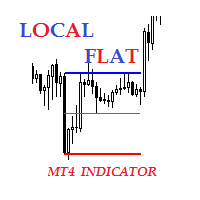
Description The indicator of local flat. The indicator allows to find local flats in the following options: Width of channels that is not more than certain number of points Width of channels that is not less than certain number of points Width of channels that is not more and not less than certain number of points The indicator displays the middle and boundaries of the channel. Attaching multiple instances of the indicator to the chart with different ranges leads to displaying a system of chann
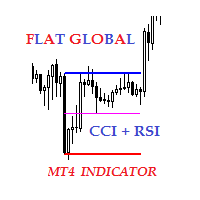
Description The indicator of local flat for CCI and RSI indicators. Users can select financial instruments. The indicator allows to find local flats in the following options: Width of channels that is not more than certain range Width of channels that is not less than certain range Width of channels that is not more and not less than certain range The indicator displays the middle and boundaries of the channel.
Purpose
The indicator can be used for manual or automated trading within an Expert

The Pips Owner trades automatically. It belongs to level breakout scalping strategies. It is designed for high-speed trading on the financial instrument it is attached to. In order to trade different financial instruments simultaneously the EA must be attached to the chart of each relevant financial instrument. The Expert Advisor trades using pending orders. Different combinations of input parameters, timeframes and financial instruments provide the trader with wide tactical trading opportun

The Five Minutes Strategy EA is designed for trading binary options. EURUSD on the five-minute period is strongly recommended. Trading is performed by the opening prices based on the signals of the Five Minutes indicator. It requires at least 100 bars in history to operate.
Input Parameters Initial Deposit - initial deposit. Lot Value - lot size. Lot Type - lot type: Fixed - fixed. Variable - variable. Last Lot Value - last lot value (used in cases when the EA is reattached) Day lot typ
The Rapid Strategy Expert Advisor is designed for binary option trading. M5 timeframe with the 15-minute expiration is recommended. Available financial instruments: EURUSD, EURCHF, GBPUSD, GBPJPY, USDJPY and XAGUSD. Trading multiple financial symbols at a time is not recommended. The EA trades at Open prices based on the signals of the Rapid indicator. It requires at least 100 history bars.
Input Parameters Experts Number - the number of expert advisors (corresponds to the number o

Pivot Points MT5 is a universal color multicurrency/multisymbol indicator of the Pivot Points levels systems. You can select one of its three versions: Standard Old, Standard New and Fibo . It plots pivot levels for financial instruments in a separate window . The system will automatically calculate the Pivot Point on the basis of market data for the previous day ( PERIOD_D1 ) and the system of support and resistance levels, three in each. A user can choose colors for the indicator lines. The on
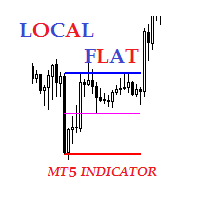
Description The indicator of local flat. The indicator allows to find local flats in the following options: Width of channels that is not more than certain number of points Width of channels that is not less than certain number of points Width of channels that is not more and not less than certain number of points The indicator displays the middle and boundaries of the channel. Attaching multiple instances of the indicator to the chart with different ranges leads to displaying a system of chann
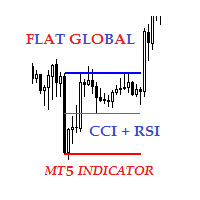
Description The indicator of local flat for CCI and RSI indicators. Users can select financial instruments. The indicator allows to find local flats in the following options: Width of channels that is not more than certain range Width of channels that is not less than certain range Width of channels that is not more and not less than certain range The indicator displays the middle and boundaries of the channel.
Purpose
The indicator can be used for manual or automated trading within an Expert

The utility is entended for preparing information for the Sprint EA . Preparing information for different financial instruments needs the EA to be attached to a chart of the corresponding financial instrument. The EA prepares information in online mode only. Input Parameters Symbol Name - name of financial instrument of the chart the EA is attached to. Connection Control - control of disconnections with the trade server: true - enable. false - disable. Send Mail - send an e-mail notification abo
Magic Triangles is a tick Expert Advisor designed for simultaneous trading on three symbols of the FOREX market. The possible combinations of the financial instruments: SYMBOL 1 SYMBOL 2 SYMBOL 3 EURUSD EURJPY USDJPY EURUSD EURCHF USDCHF EURGBP EURUSD GBPUSD USDCHF USDJPY CHFJPY USDCHF EURCHF EURUSD AUDCAD AUDJPY CADJPY Symbols are choosed in accordance with the following principle of triangulation: SYMBOL_1=SYMBOL_2/SYMBOL_3, for example: EURUSD = EURJPY/USDJPY. Inputs First Symbol - first