TickVolumeLinesEng
- Indicadores
- Sergei Turov
- Versión: 1.0
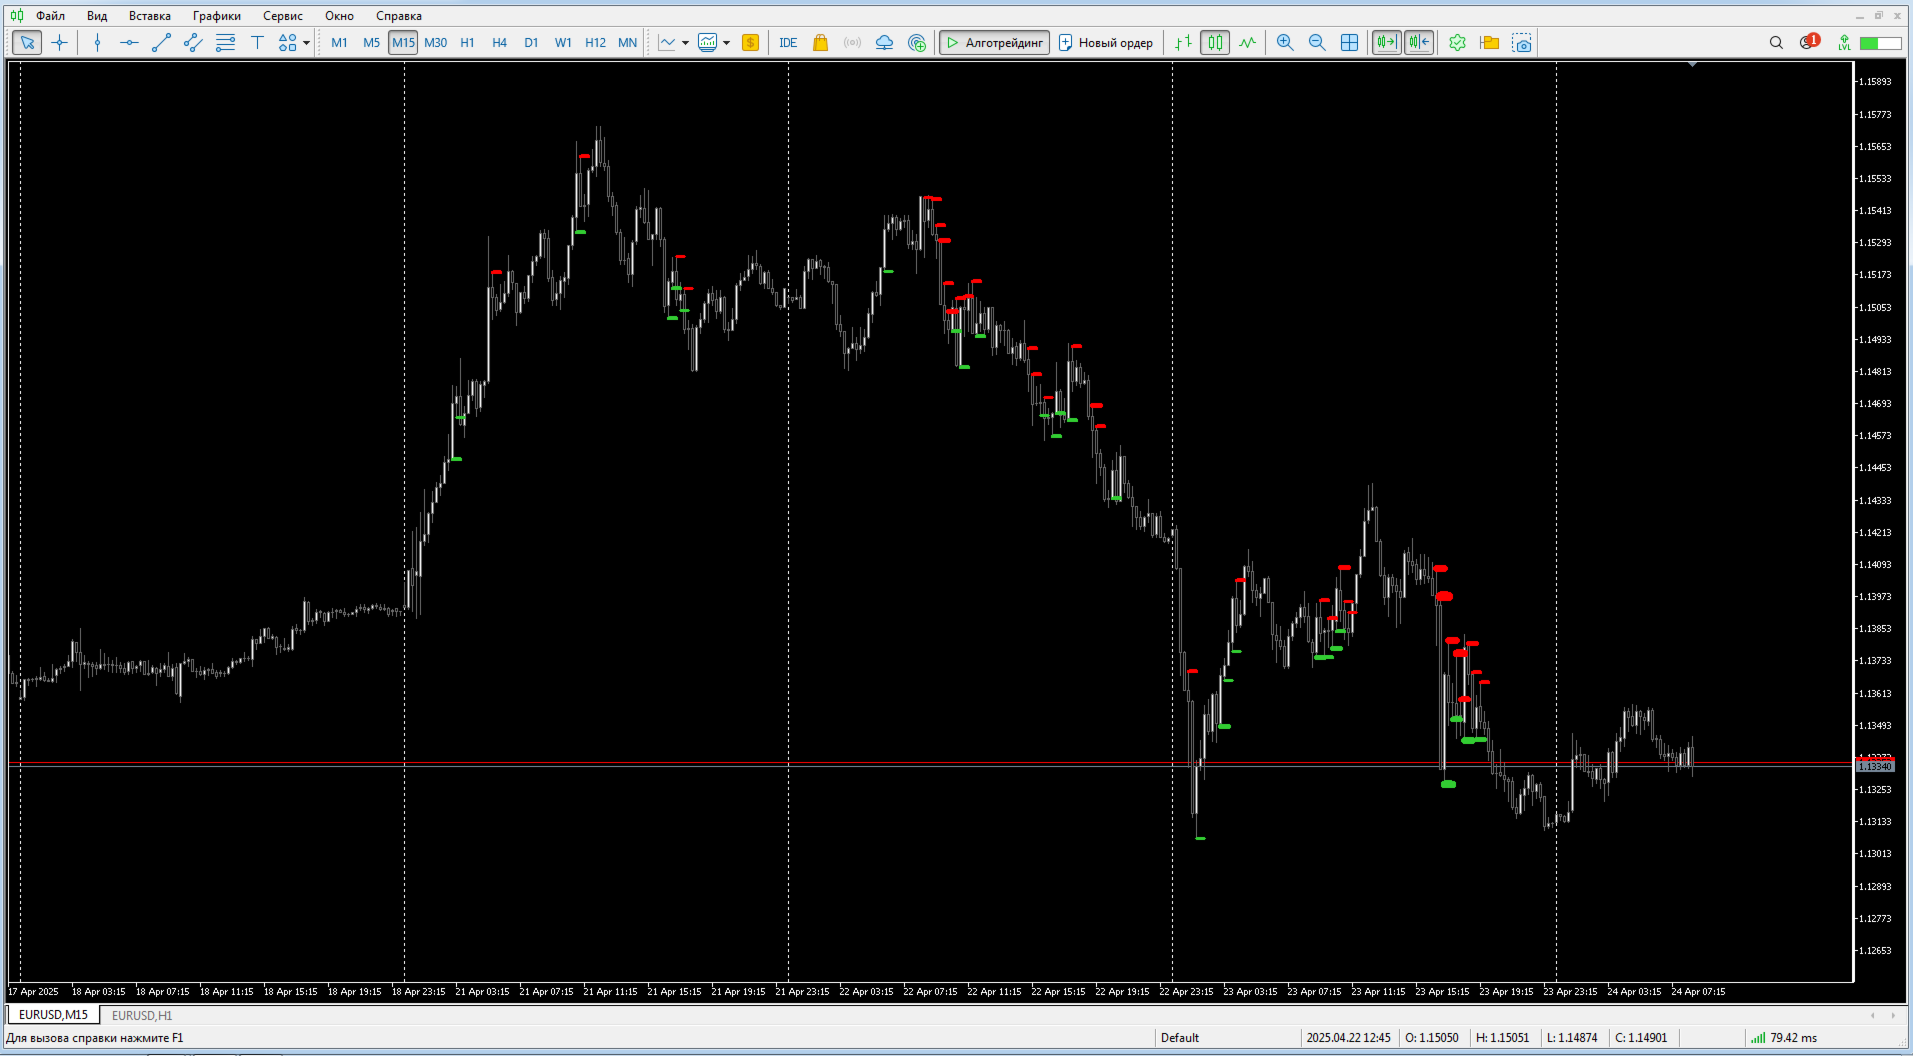
Indicator "Tick Volume Lines"
The indicator visualizes tick volume levels directly on the chart by drawing horizontal lines. It highlights price bars with significant tick volumes, providing traders with valuable insights into market activity and potential turning points.
Main Features:
-
Tick Volume Visualization:
-
Clearly indicates bars with high tick volumes by drawing horizontal lines.
-
-
Dynamic Line Thickness:
-
Line thickness dynamically represents the relative size of tick volumes, enhancing visual clarity.
-
-
Customizable Display:
-
Adjust the maximum line thickness, minimum tick volume threshold, and line duration.
-
-
Separate Bullish/Bearish Indication:
-
Bullish volumes are marked in green, bearish in red, facilitating easy identification of market sentiment.
-
Input Parameters:
-
LookbackDays — Number of days back to display the tick volume lines.
-
MaxLineWidth — Maximum thickness of the lines.
-
TimeFactor — Multiplier for line duration in seconds.
-
MinTickVolume — Minimum tick volume threshold to display a line.
Practical Applications:
The indicator is particularly useful for traders who:
-
Want to quickly spot market movements driven by high trading activity.
-
Use tick volume analysis to confirm price action signals.
-
Identify strong support and resistance areas based on tick volume activity.
Incorporate "Tick Volume Lines" into your analysis to enhance your trading decisions based on market activity!