TPSpro RFI Levels MT5
- Indicadores
- Roman Podpora
- Versión: 5.4
- Actualizado: 14 enero 2025
- Activaciones: 7
INSTRUCCIONES RUSO - ING Se recomienda utilizar con un indicador. - TPSpro TENDENCIA PRO
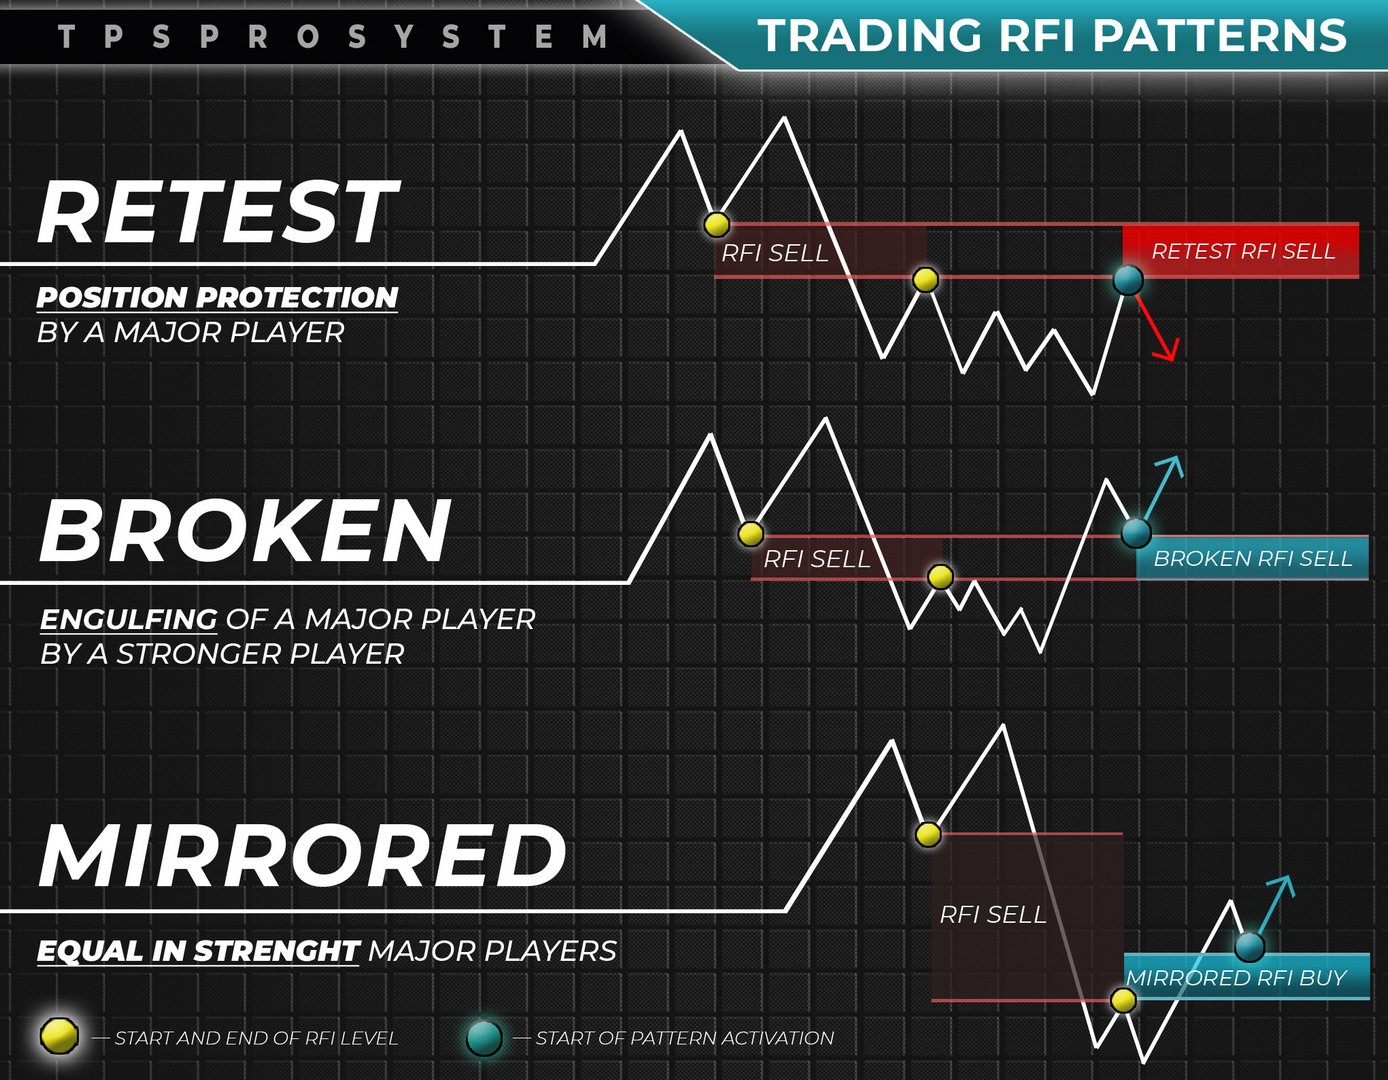
Un elemento clave en el trading son las zonas o niveles desde los que se toman las decisiones de compra o venta de un instrumento de trading. A pesar de los intentos de los principales actores de ocultar su presencia en el mercado, inevitablemente dejan rastros. Nuestra tarea era aprender a identificar estos rastros e interpretarlos correctamente.
Funciones principales:
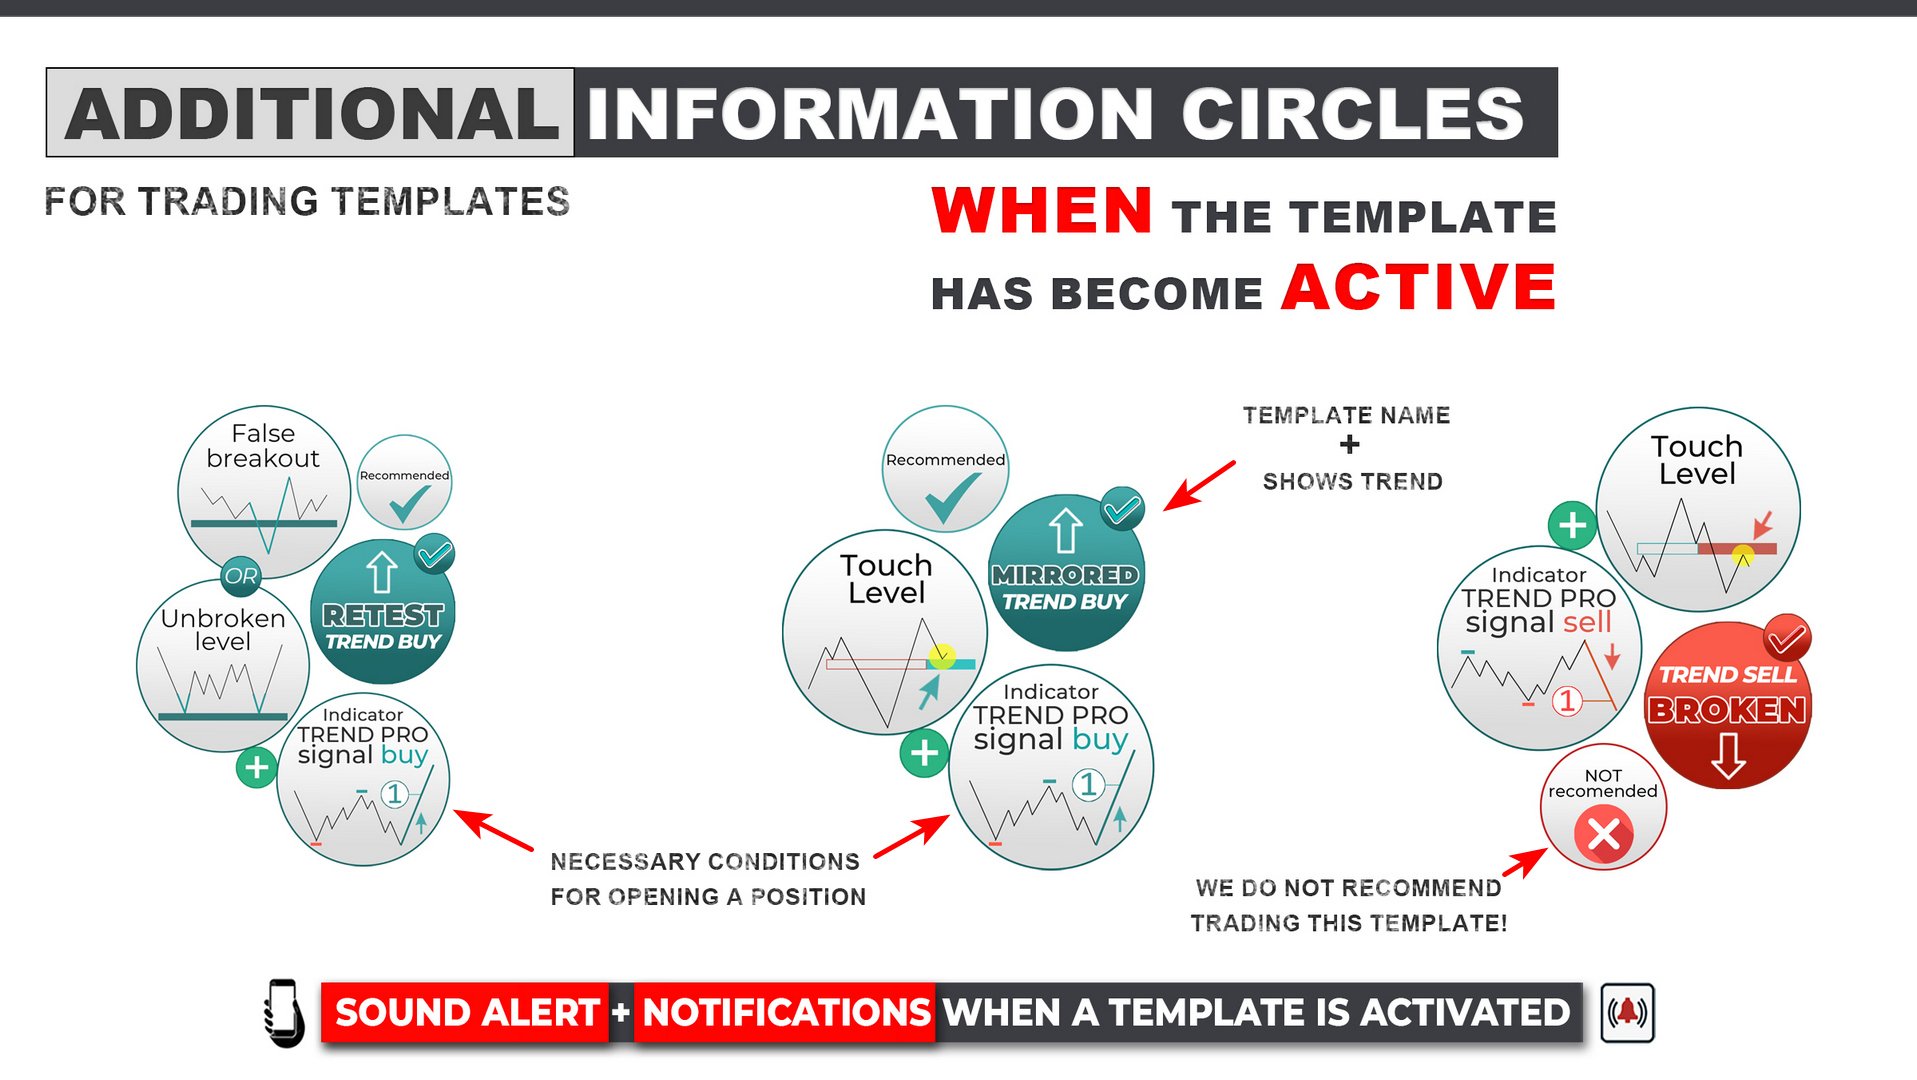
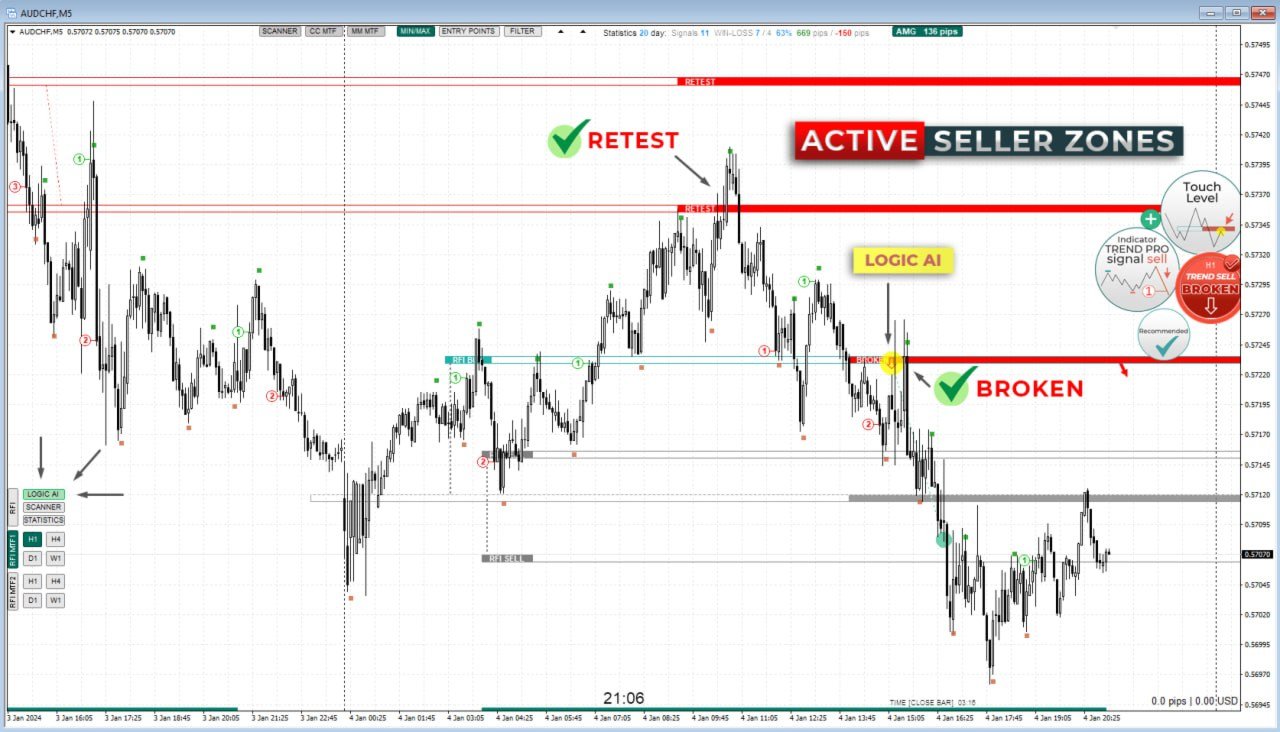
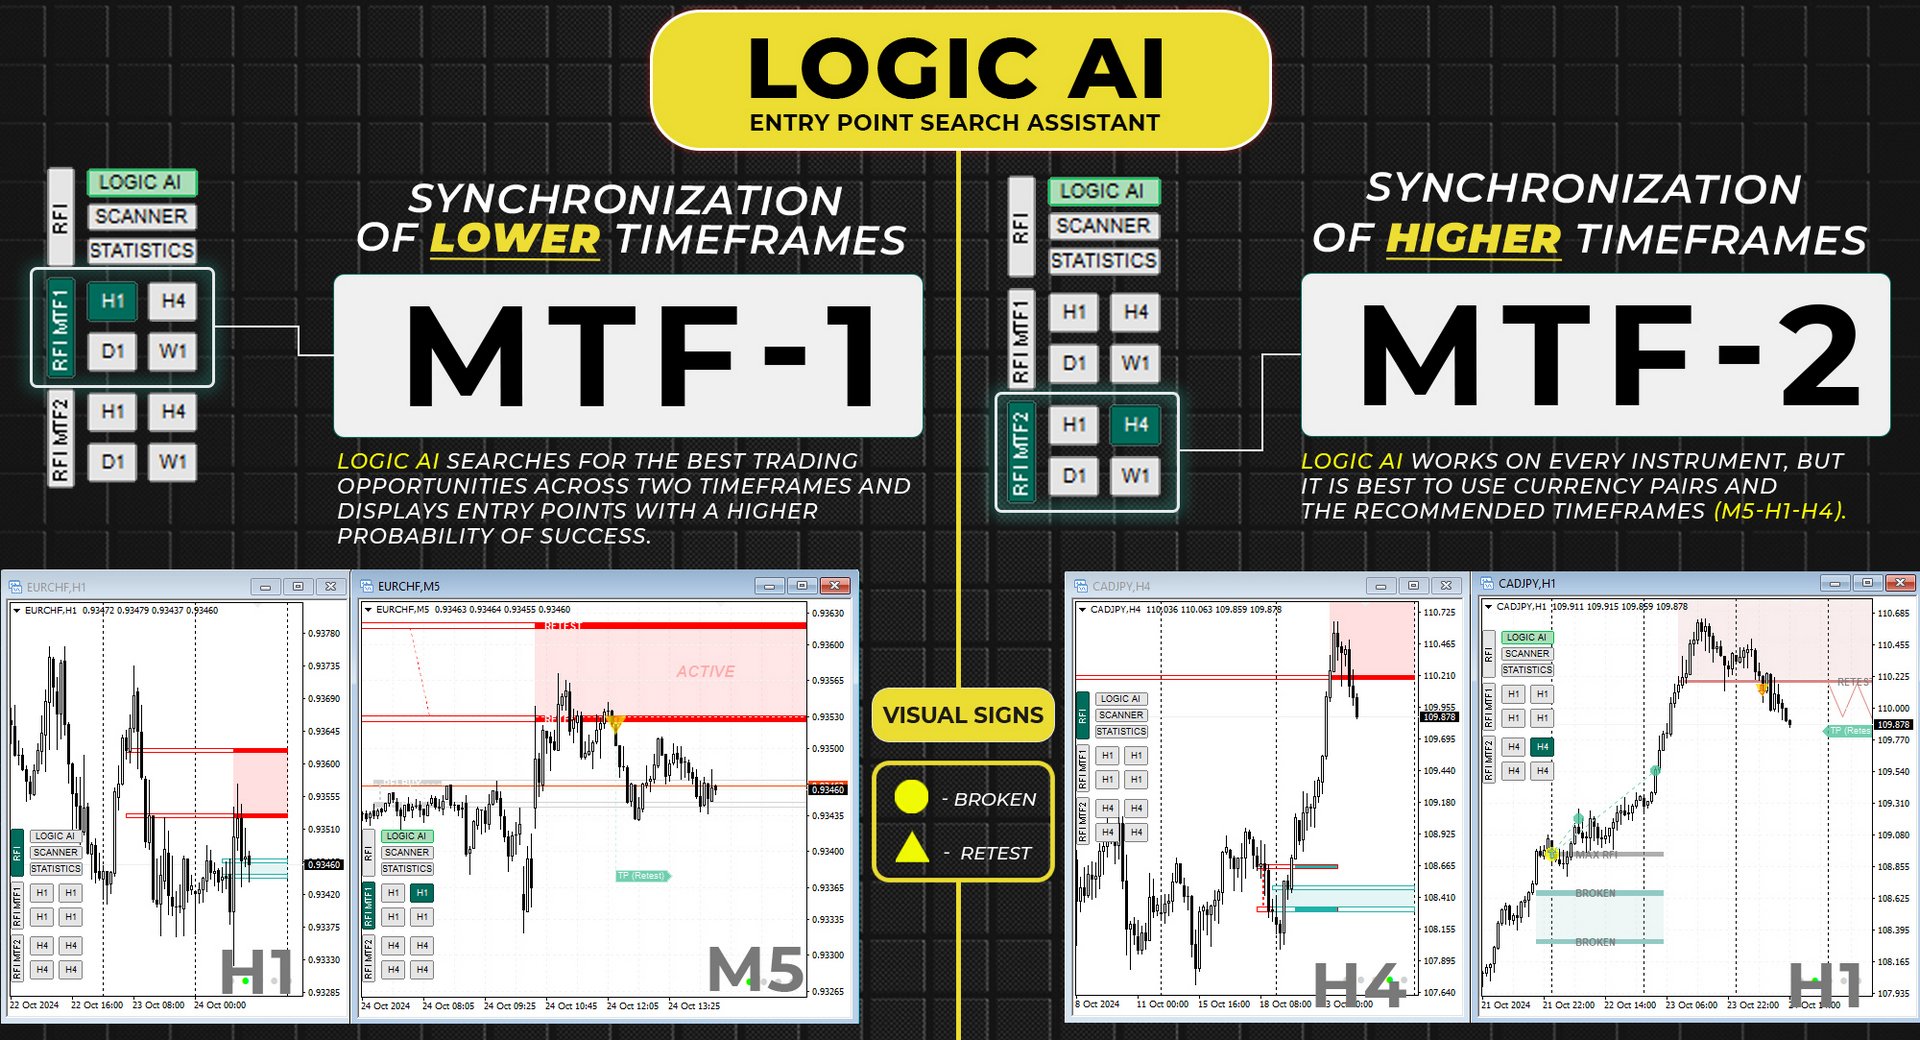
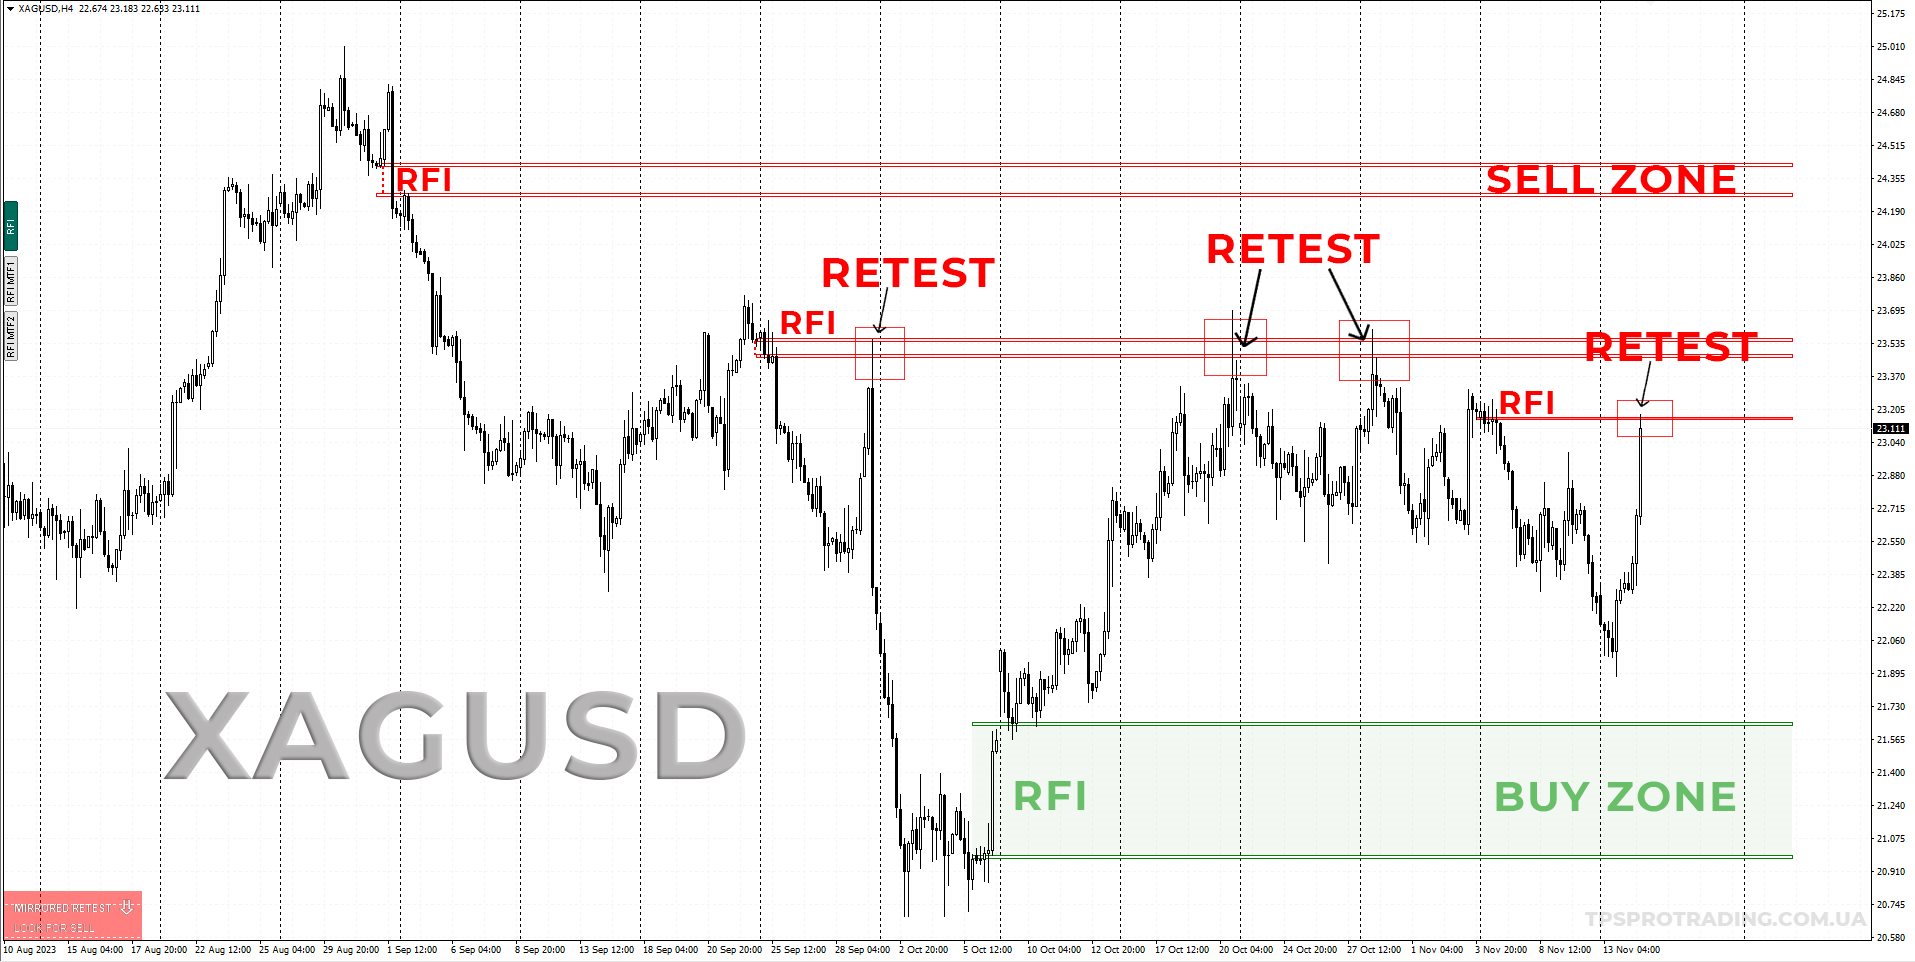
- ¡Mostrando zonas activas para vendedores y compradores! El indicador muestra todos los niveles/zonas de impulso iniciales correctos para la compra y la venta. Al activarse estos niveles/zonas, donde comienza la búsqueda de puntos de entrada, los niveles cambian de color y se rellenan con tonos específicos. Además, aparecen flechas para una comprensión más intuitiva de la situación.
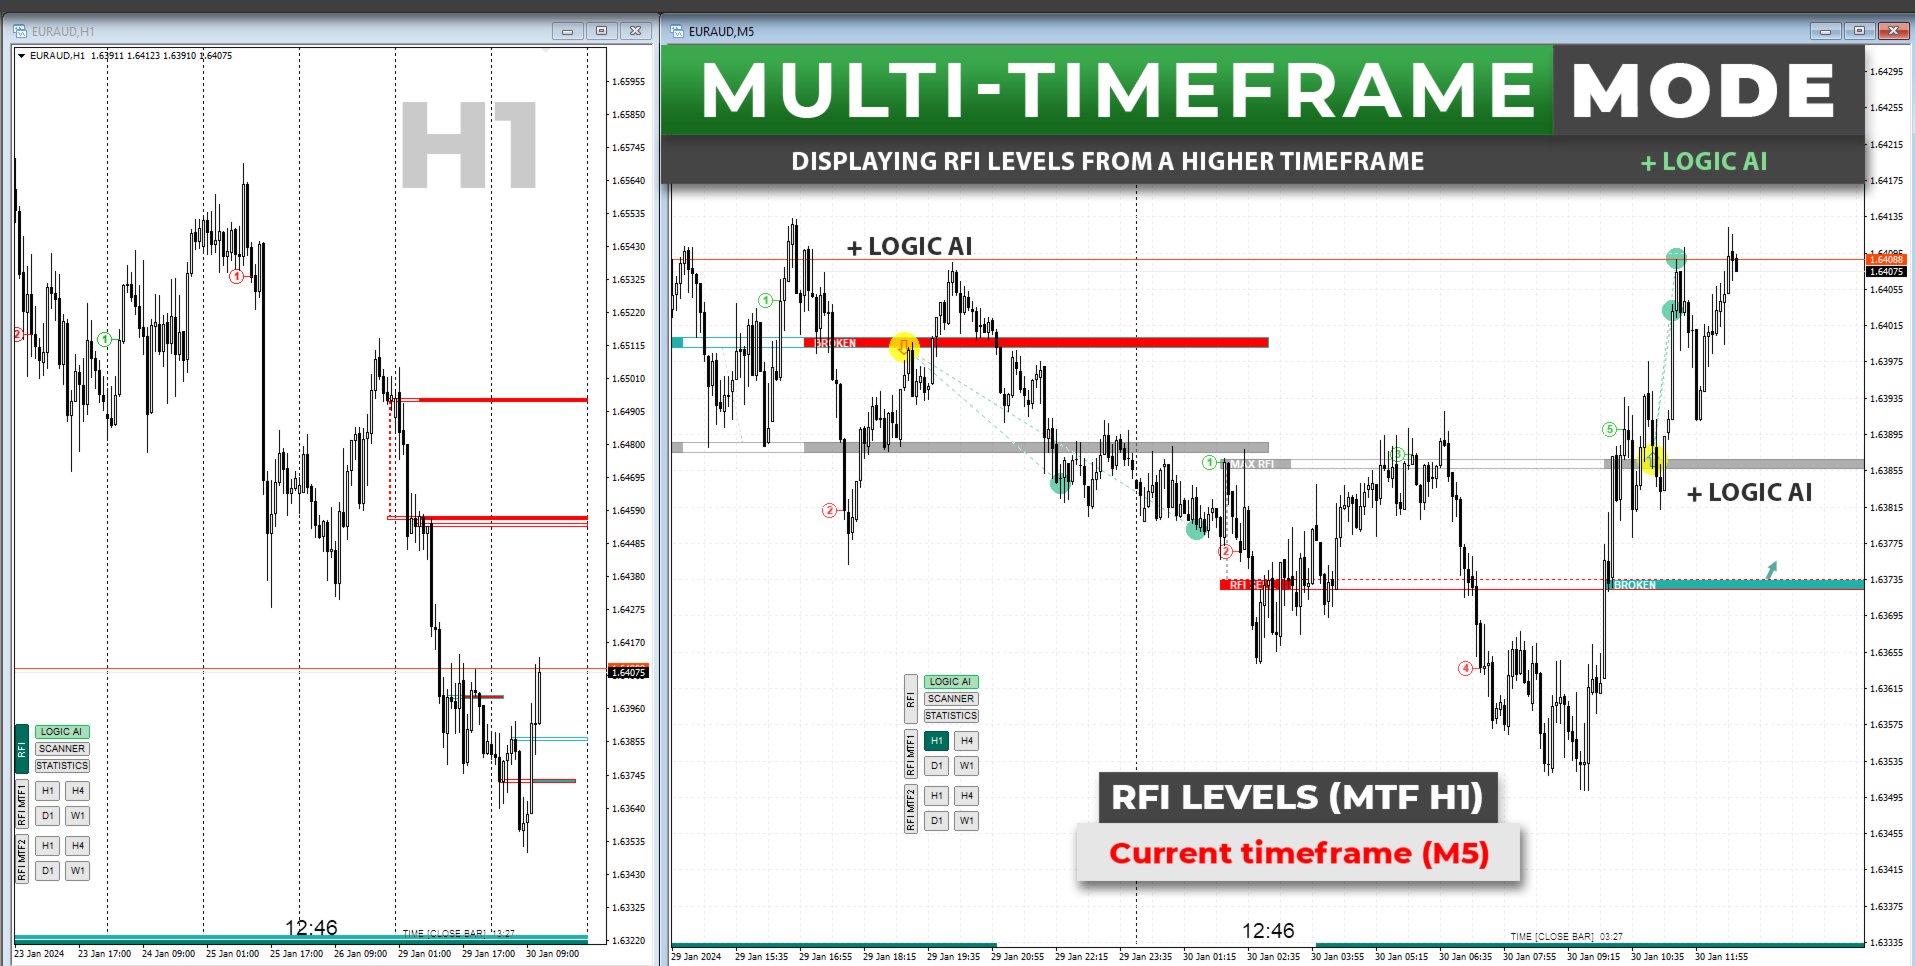
- Visualización de niveles/zonas de un período de tiempo superior (modo MTF)
Se agregó la función para visualizar niveles/zonas utilizando un intervalo de tiempo mayor. Además, el indicador cuenta con una función de detección automática de tendencias ( TPSproTREND PRO ).
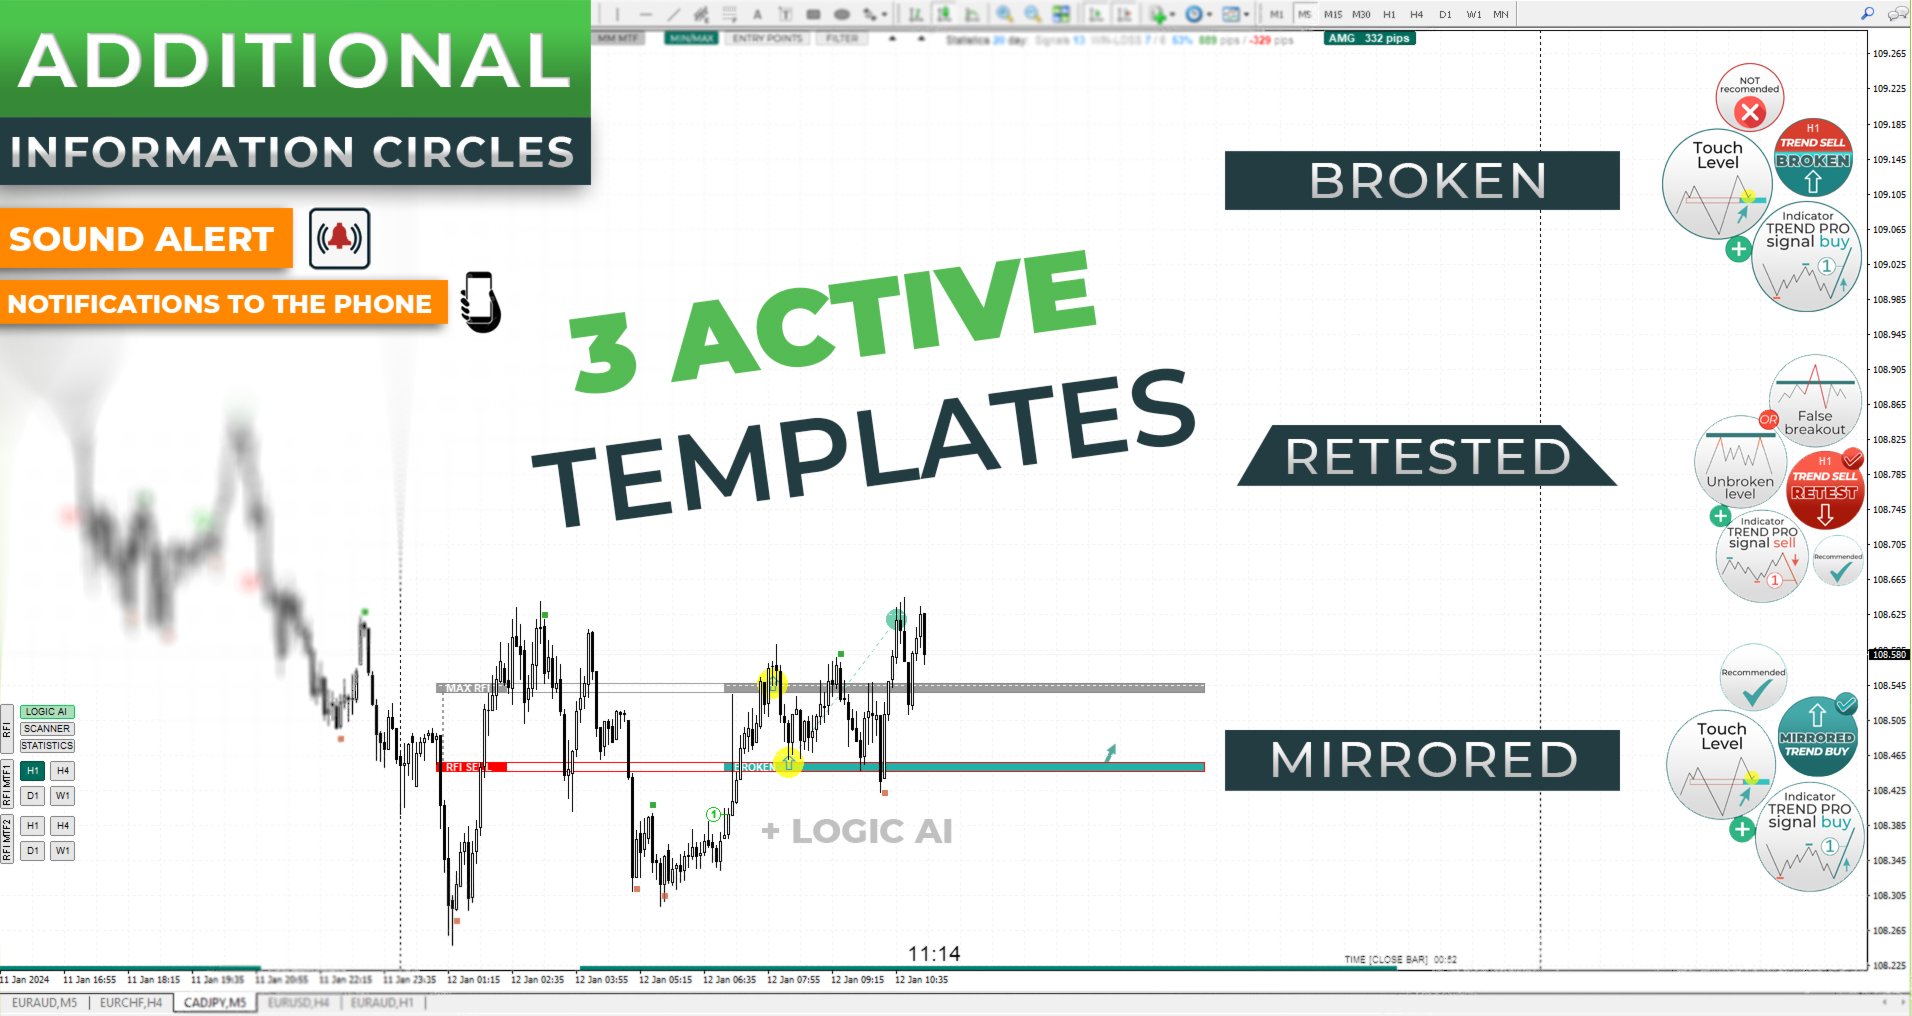
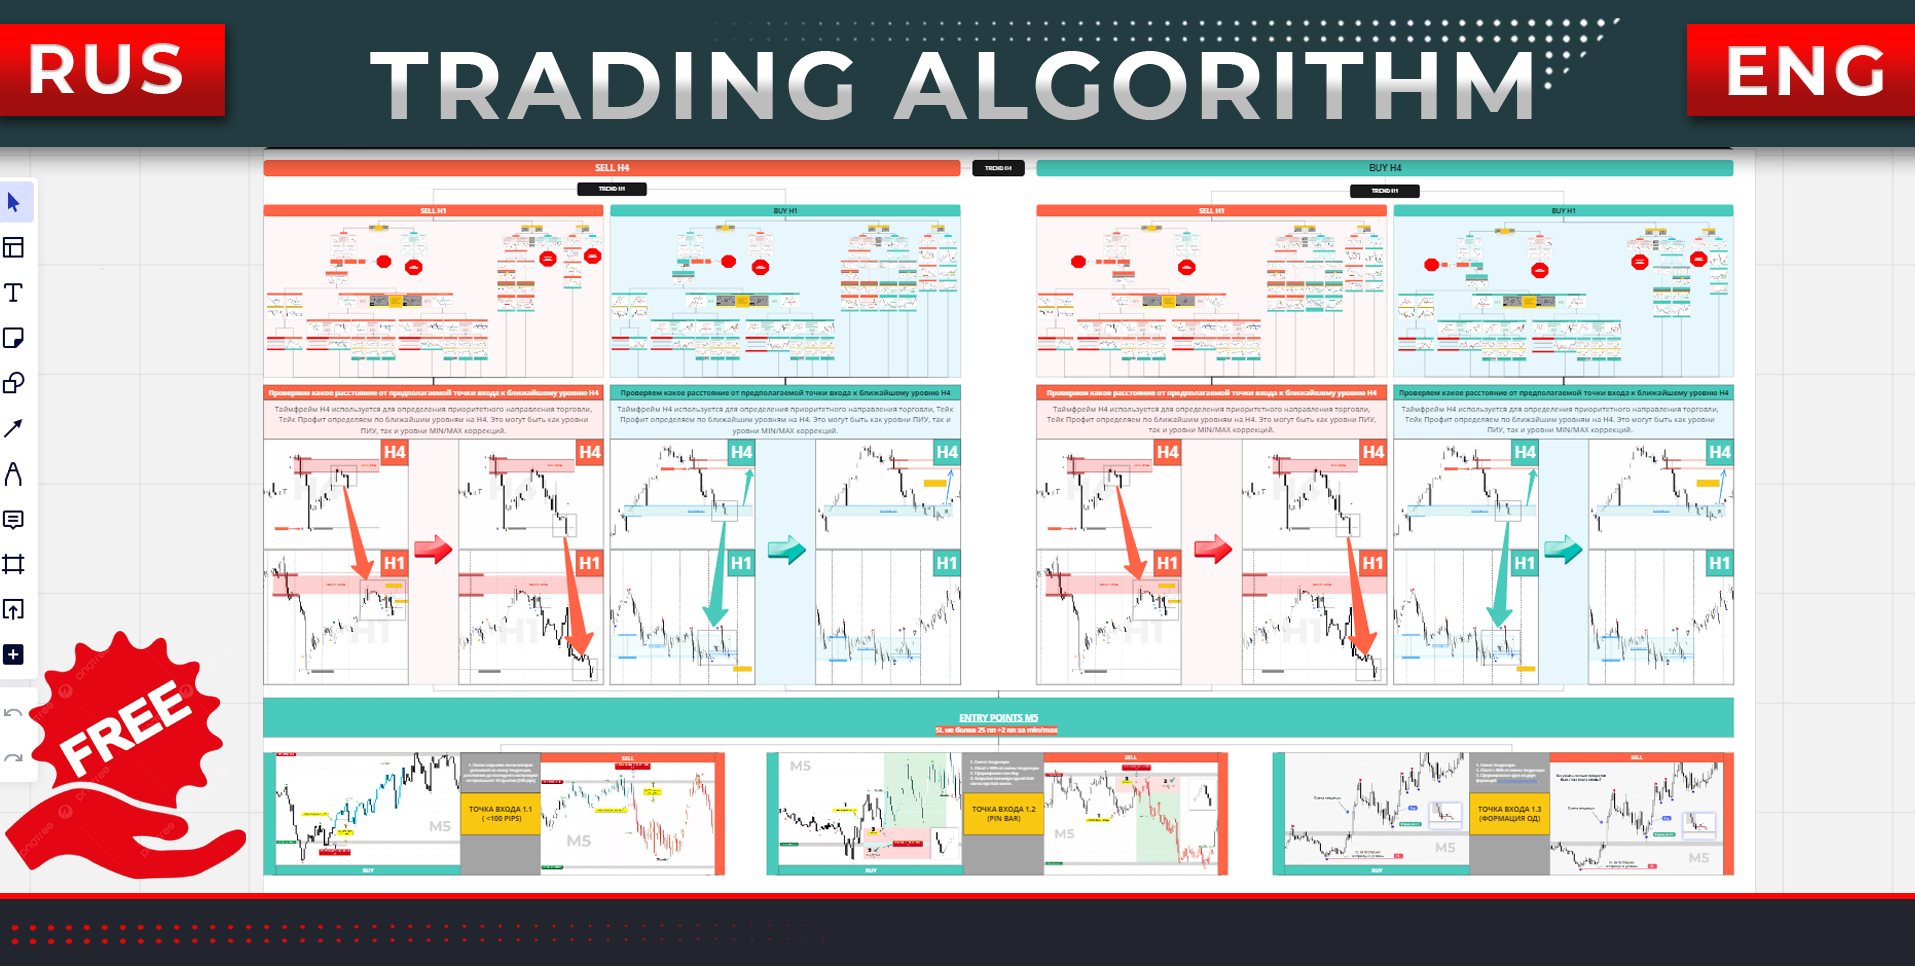
- Un algoritmo profesional independiente paso a paso para operar. El algoritmo está diseñado para operaciones intradía, tanto siguiendo la tendencia como en contra de ella. Se proporciona una instrucción detallada para cada plantilla activa.
- Funciona en varios marcos temporales . El indicador de niveles RFI de TPSpro se puede utilizar en cualquier período de tiempo del gráfico, comenzando desde el minuto (M1) y llegando hasta el mensual (MN).
- Alertas gráficas y sonoras. El indicador proporciona indicaciones tanto gráficas como sonoras, lo que garantiza que no se pierda las señales de entrada en la operación. También están disponibles las notificaciones en el teléfono móvil.
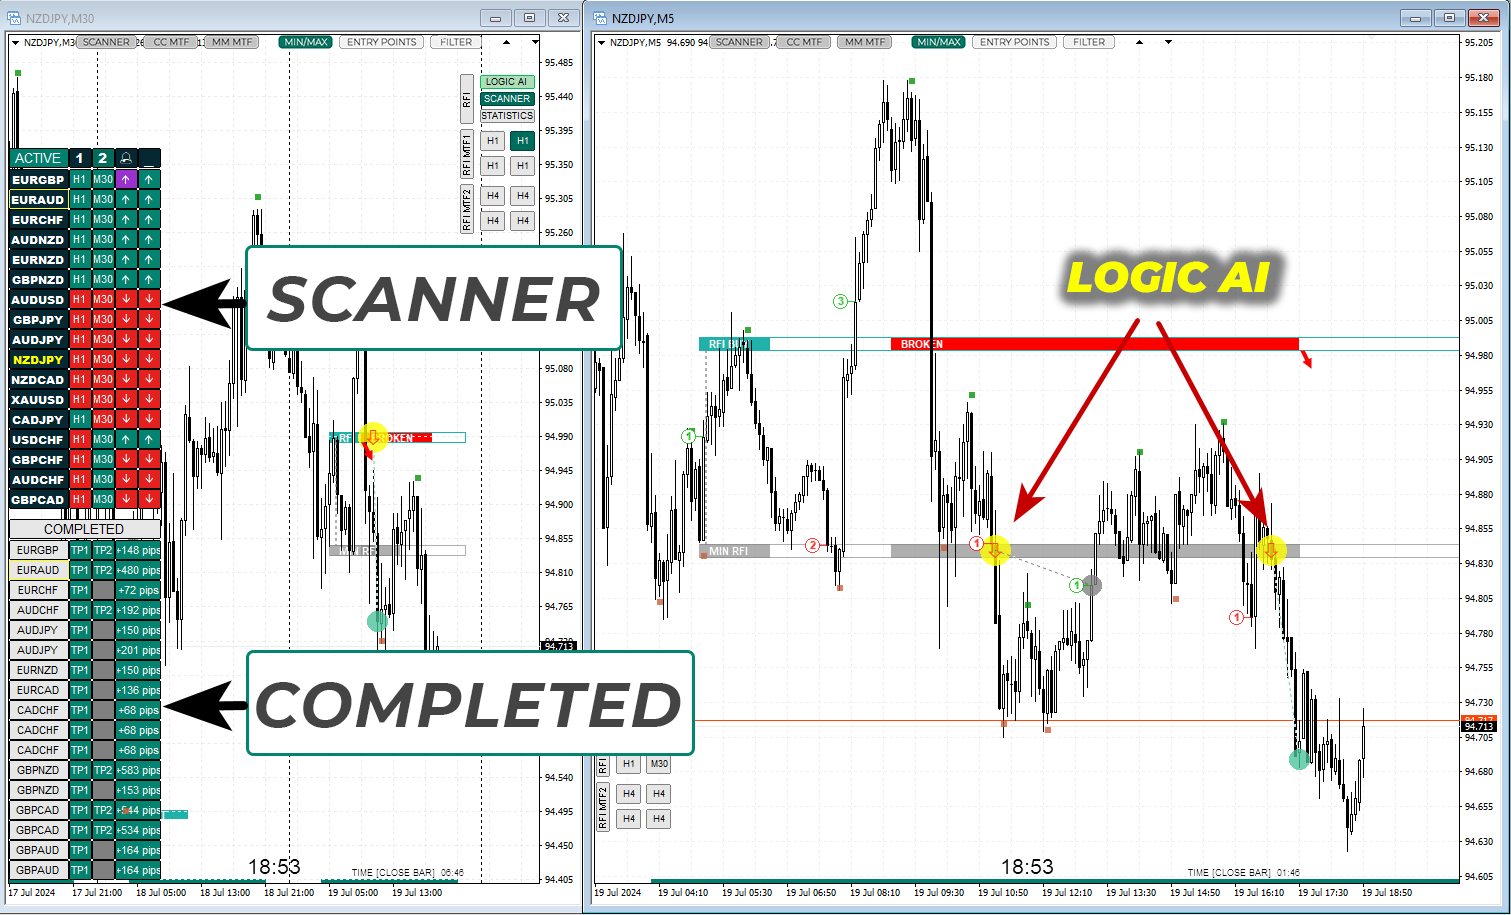
- Escáner de patrones activos simple y efectivo. Este es un escáner de patrones activos extremadamente compacto que alerta y envía notificaciones automáticamente a su teléfono cuando los patrones se activan en todos los períodos de tiempo en una dirección.
- Para expertos y principiantes.
Una guía de video e instrucciones paso a paso le explicarán cómo trabajar con el indicador utilizando un ejemplo específico, incluso si lo está haciendo por primera vez.
- Es fácil determinar niveles para los puntos de entrada al mercado tanto detrás de la tendencia como contra la tendencia.
- Determinar objetivos (puntos de salida) en cualquier período de tiempo con gran precisión.
- Incluir niveles (RFI) de un marco temporal superior: modo MTF.
- Sólo existen tres plantillas para determinar la prioridad del comercio.
Teclas de acceso rápido:
- R-- Mostrar todos los niveles de RFI en el historial
- Z- Ocultar/mostrar panel
- L - Visualización del inicio de los niveles (modo MTF-2)


I've been using TPSpro RFI Levels for a while now, and it has significantly improved my trading decisions. The signals are highly accurate, and the interface is intuitive, making it easy to use even for those who aren't tech-savvy.