Trading System Double Trend
- Indicadores
- Vitalyi Belyh
- Versión: 1.0
- Activaciones: 10
El sistema de comercio Double Trend es un sistema de comercio independiente que consta de varios indicadores. Determina la dirección de la tendencia general y da señales en la dirección del movimiento de precios.
Se puede utilizar para operaciones de especulación, intradía o intrasemanal.
Posibilidades
Los parámetros de entrada se configuran para cada tendencia en el sistema.
como usar
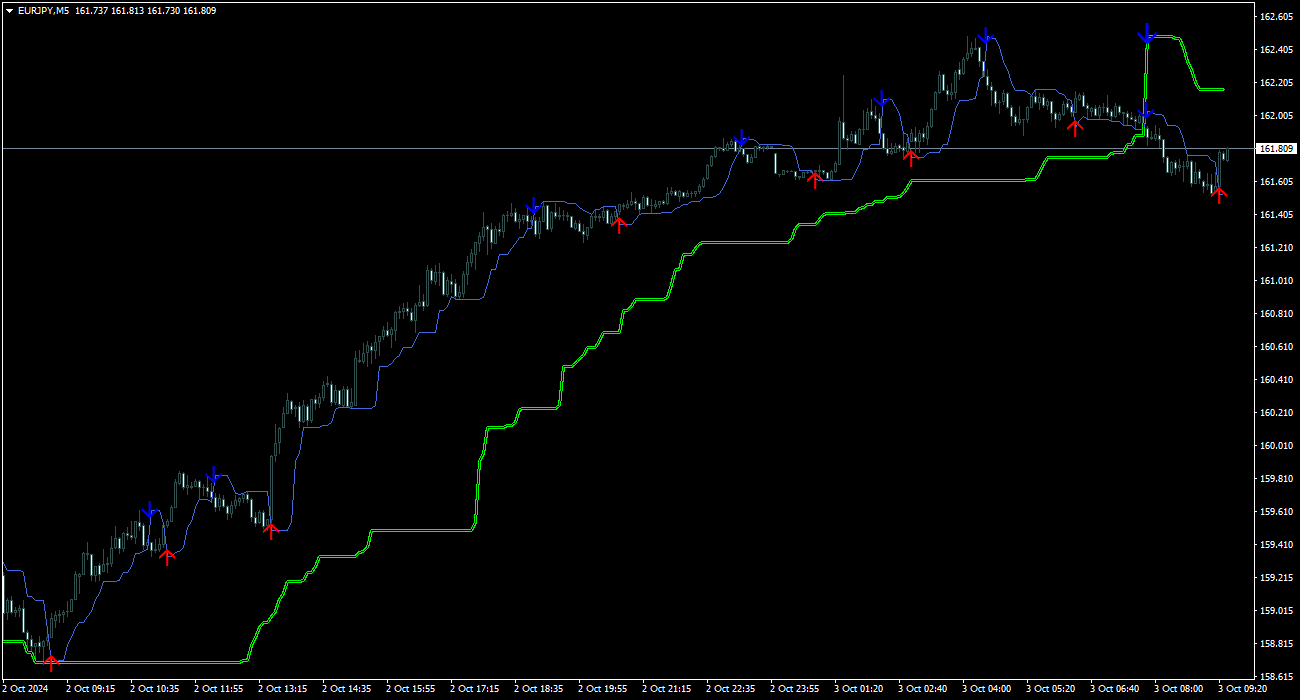
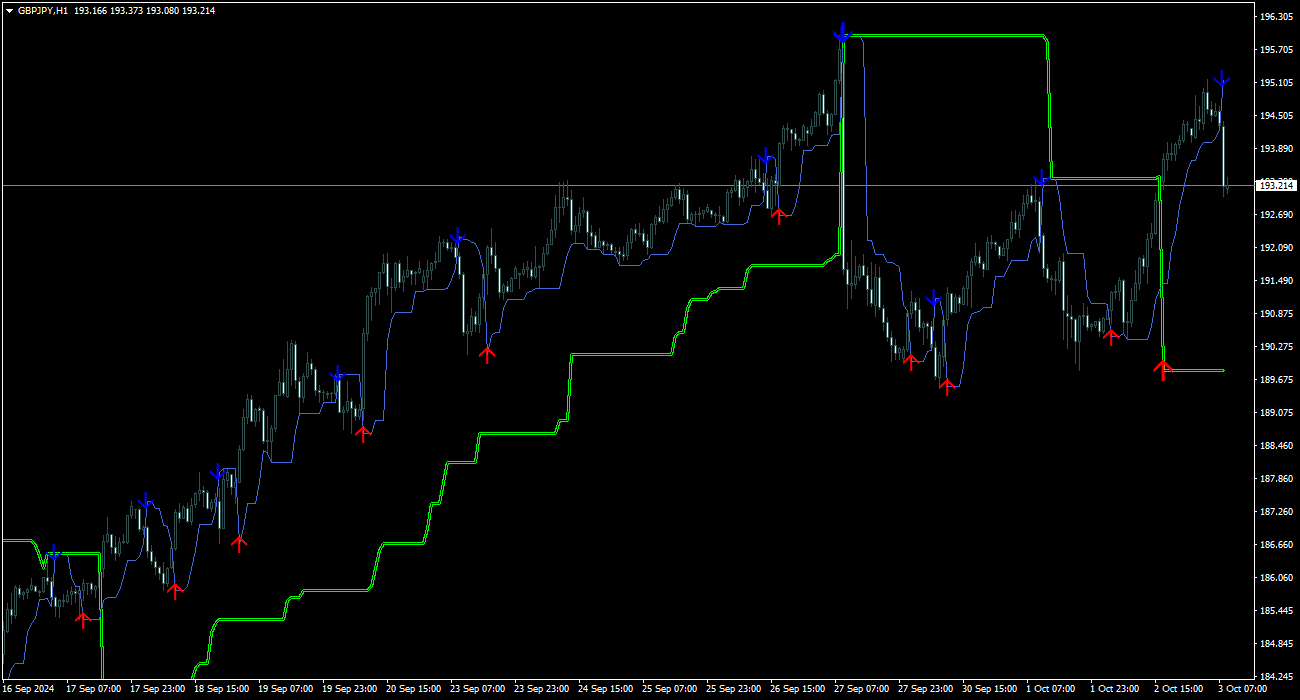
Tendencia general - línea verde clara, si está por encima del precio - la tendencia es a la baja, si está por debajo del precio - la tendencia es al alza. Cuando la tendencia cambia, aparecen flechas de señal.
Tendencia de la señal: una línea azul que sigue el precio. Una flecha azul que sigue una tendencia bajista es una señal de venta. Una flecha roja a lo largo de la tendencia alcista es una señal de compra. Si la flecha está dirigida contra la tendencia, es una señal de salida.
Se puede utilizar para operaciones de especulación, intradía o intrasemanal.
Posibilidades
- Funciona en cualquier marco temporal e instrumento comercial (Forex, criptomonedas, metales, acciones, índices).
- Lectura visual sencilla de información sin cargar un gráfico.
- El indicador no vuelve a dibujar y no completa las señales.
- Funciona sólo cuando la vela se cierra.
- Hay varios tipos de alertas para señales.
- Fácil de entender visualmente, sólo necesitas adjuntarlo al gráfico y seguir las sencillas recomendaciones de las señales.
Los parámetros de entrada se configuran para cada tendencia en el sistema.
- General trend : determina la tendencia general.
- Signal trend : da señales de entradas y salidas.
- Play sound / Display pop-up message / Send push notification / Send email : usar notificaciones cuando aparecen flechas de señal y paradas.
- Sound for signals - Archivo de sonido para señales.
como usar
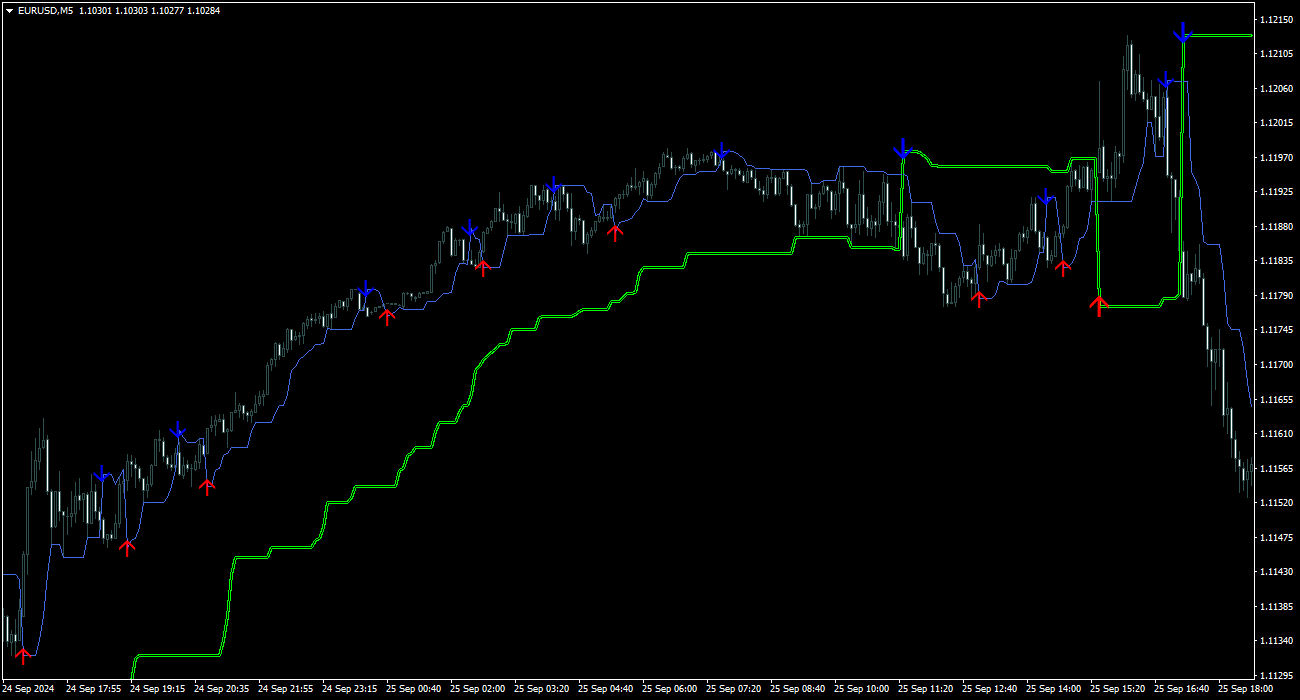
Tendencia general - línea verde clara, si está por encima del precio - la tendencia es a la baja, si está por debajo del precio - la tendencia es al alza. Cuando la tendencia cambia, aparecen flechas de señal.
Tendencia de la señal: una línea azul que sigue el precio. Una flecha azul que sigue una tendencia bajista es una señal de venta. Una flecha roja a lo largo de la tendencia alcista es una señal de compra. Si la flecha está dirigida contra la tendencia, es una señal de salida.