Trading System Double Trend
- Indicatori
- Vitalyi Belyh
- Versione: 1.0
- Attivazioni: 10
Trading System Double Trend è un sistema di trading indipendente composto da diversi indicatori. Determina la direzione della tendenza generale e fornisce segnali nella direzione del movimento dei prezzi.
Può essere utilizzato per lo scalping, il trading intraday o intraweek.
Possibilità
I parametri di input sono configurati per ciascun trend nel sistema.
Come usare
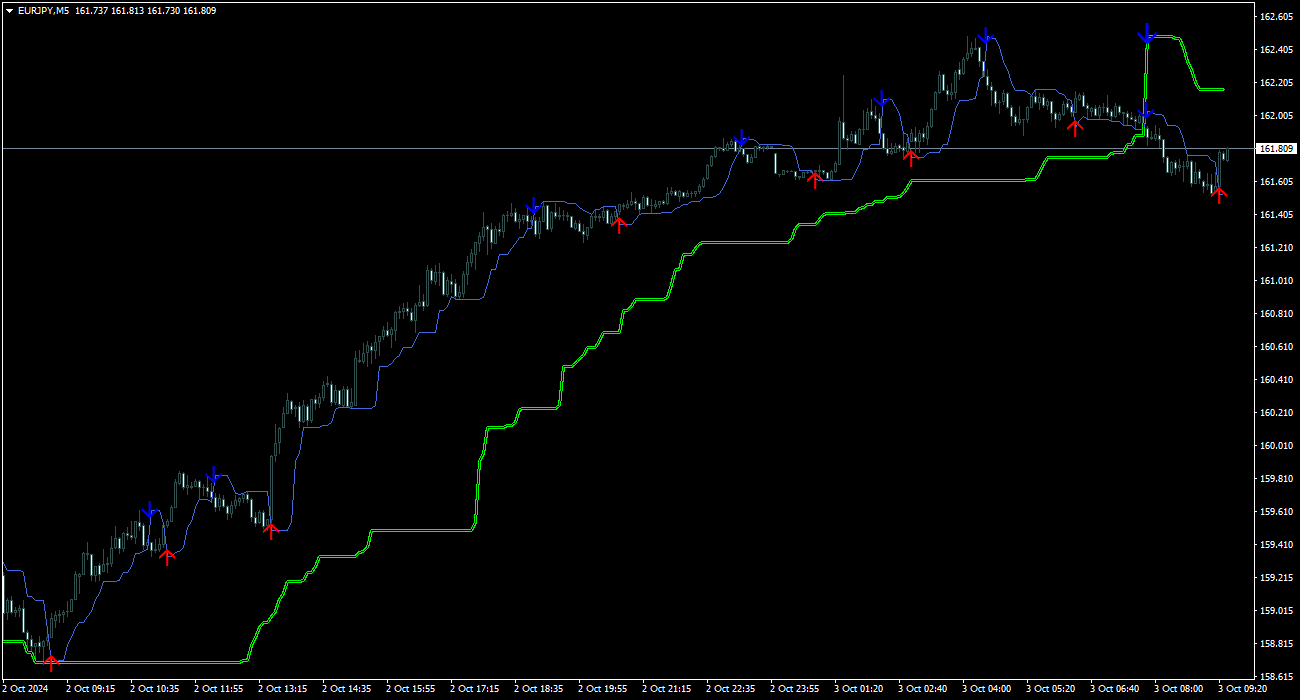
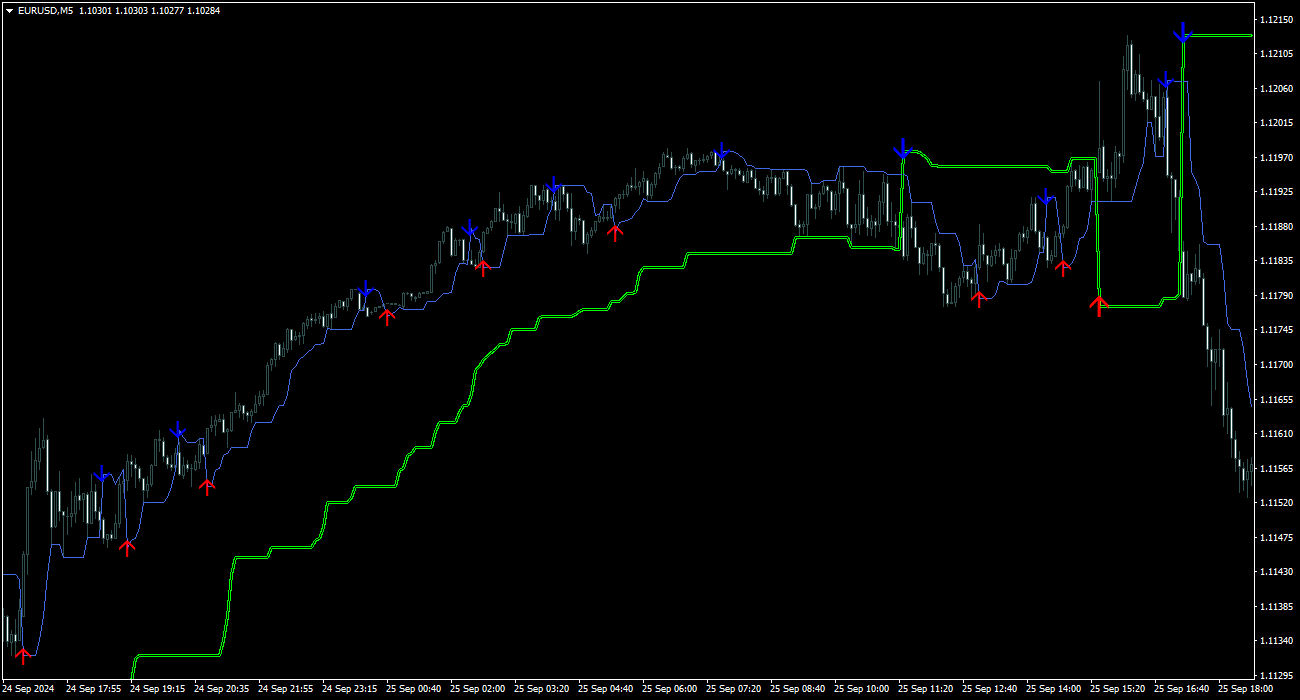
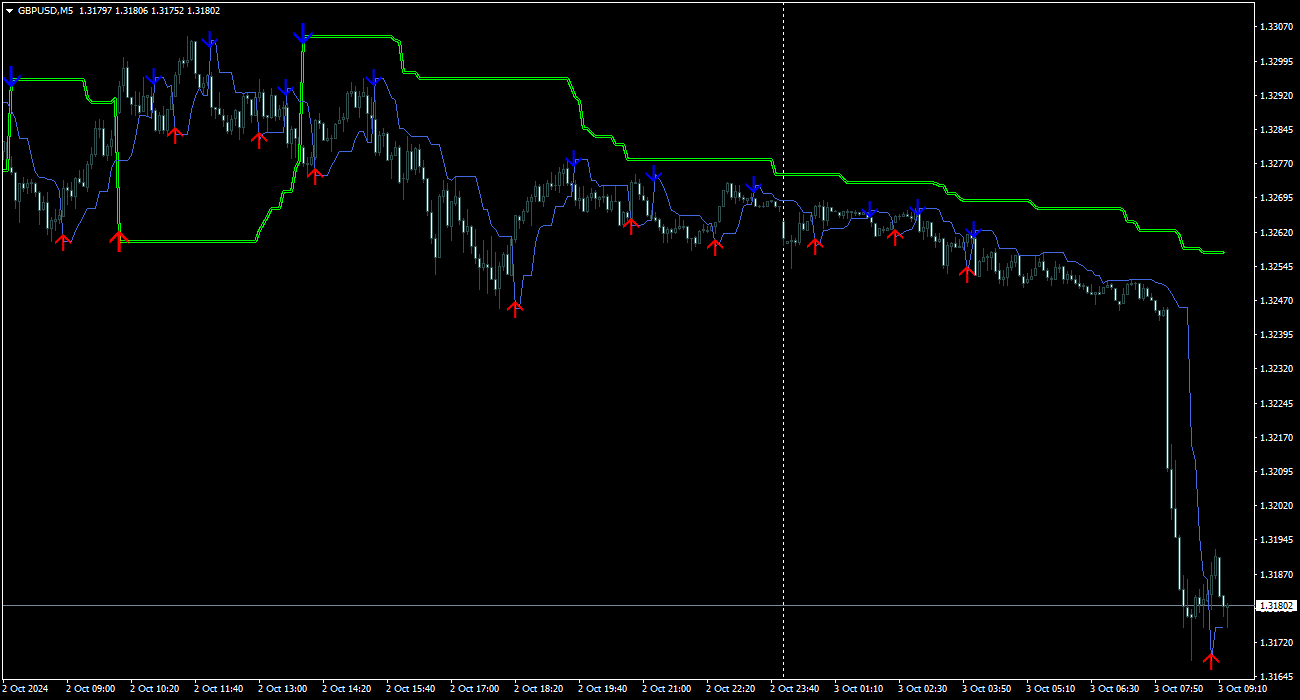
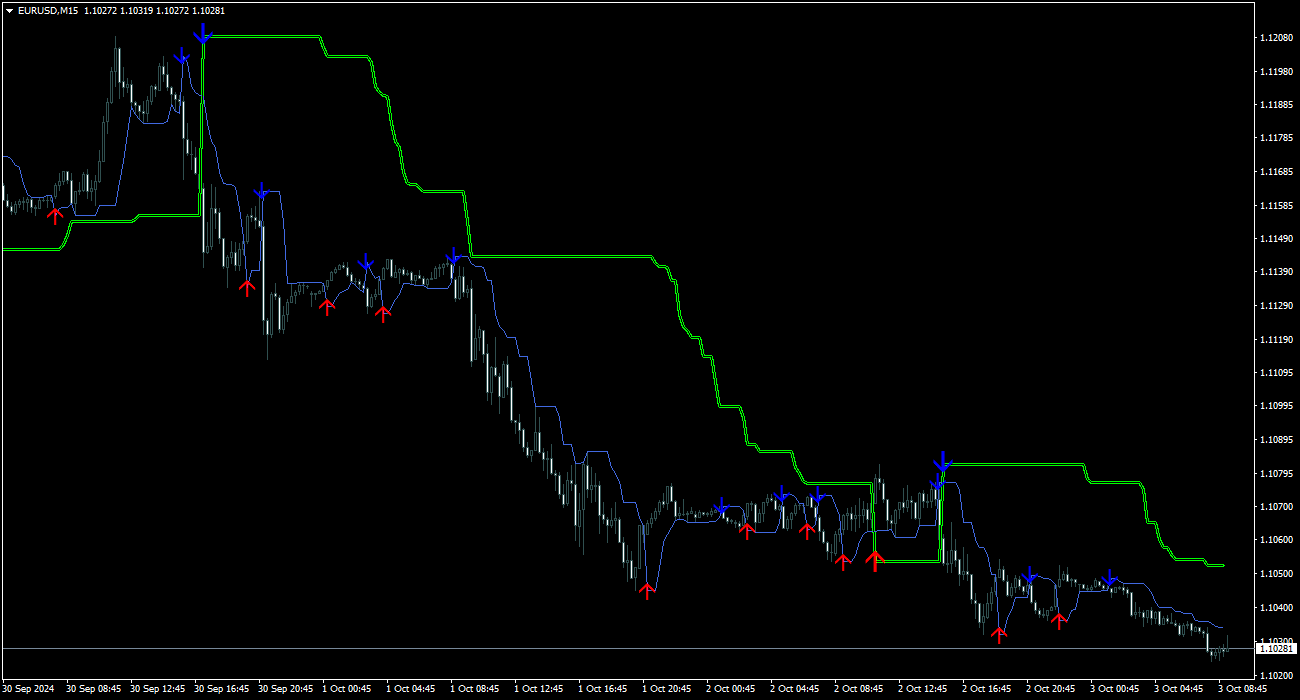
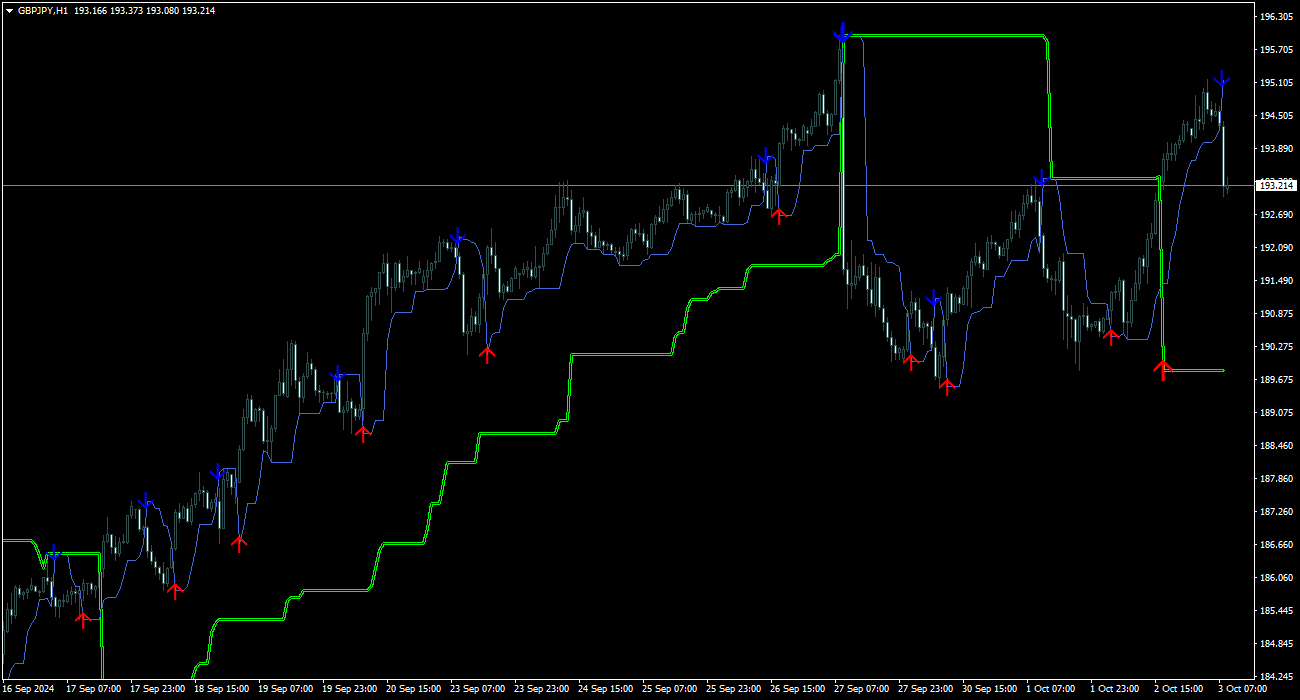
Tendenza generale - linea verde chiaro, se è sopra il prezzo - la tendenza è al ribasso, se sotto il prezzo - la tendenza è al rialzo. Quando la tendenza cambia, ci sono frecce di segnalazione.
Tendenza del segnale: una linea blu che segue il prezzo. Una freccia blu che segue un trend al ribasso è un segnale di vendita. Una freccia rossa lungo il trend rialzista è un segnale da acquistare. Se la freccia è diretta contro il trend, è un segnale per uscire.
Può essere utilizzato per lo scalping, il trading intraday o intraweek.
Possibilità
- Funziona su qualsiasi intervallo temporale e strumento di trading (Forex, criptovalute, metalli, azioni, indici).
- Semplice lettura visiva delle informazioni senza caricare un grafico
- L'indicatore non ridisegna e non completa i segnali
- Funziona solo quando la candela si chiude
- Esistono diversi tipi di avvisi per i segnali
- Facile da capire visivamente, basta allegarlo al grafico e seguire le semplici raccomandazioni dei segnali.
I parametri di input sono configurati per ciascun trend nel sistema.
- General trend - Determina la tendenza generale
- Signal trend : fornisce segnali per le entrate e le uscite.
- Play sound / Display pop-up message / Send push notification / Send email : utilizza le notifiche quando vengono visualizzate le frecce e le fermate del segnale.
- Sound for signals - File audio per i segnali.
Come usare
Tendenza generale - linea verde chiaro, se è sopra il prezzo - la tendenza è al ribasso, se sotto il prezzo - la tendenza è al rialzo. Quando la tendenza cambia, ci sono frecce di segnalazione.
Tendenza del segnale: una linea blu che segue il prezzo. Una freccia blu che segue un trend al ribasso è un segnale di vendita. Una freccia rossa lungo il trend rialzista è un segnale da acquistare. Se la freccia è diretta contro il trend, è un segnale per uscire.