Indicadores técnicos para MetaTrader 5

Desbloquee el poder del comercio de tendencias con el indicador Trend Screener: ¡su solución definitiva para el comercio de tendencias impulsada por lógica difusa y un sistema multidivisa!Mejore su comercio de tendencias con Trend Screener, el revolucionario indicador de tendencias impulsado por lógica difusa. Es un poderoso indicador de seguimiento de tendencias que combina más de 13 herramientas y funciones premium y 3 estrategias comerciales, lo que lo convierte en una opción versátil para co

Moneytron — профессиональный сигнальный индикатор тренда
Индикатор Moneytron предназначен для тех, кто хочет зарабатывать стабильно и системно, торгуя по тренду. Он автоматически определяет: • Точки входа (Buy/Sell сигналы) • 3 уровня тейк-профита (TP1, TP2, TP3) • 3 уровня стоп-лосса (SL1, SL2, SL3) • Показывает реальную статистику успешности сделок прямо на графике
Особенности: • Работает на всех валютных парах и металлах • Идеален для таймфреймов M30, H1 и выше • Подходит как для начинающи

Golden Trend indicator is The best indicator for predicting trend movement this indicator never lags and never repaints and never back paints and give arrow buy and sell before the candle appear and it will help you and will make your trading decisions clearer its work on all currencies and gold and crypto and all time frame This unique indicator uses very secret algorithms to catch the trends, so you can trade using this indicator and see the trend clear on charts manual guide and

PUMPING STATION – Tu estrategia personal "todo incluido"
Te presentamos PUMPING STATION, un indicador revolucionario para Forex que transformará tu forma de operar en una experiencia emocionante y eficaz. No es solo un asistente, sino un sistema de trading completo con potentes algoritmos que te ayudarán a operar de forma más estable. Al comprar este producto, recibes GRATIS: Archivos de configuración exclusivos: para una configuración automática y un rendimiento óptimo. Manual en video paso a

Support And Resistance Screener está en un indicador de nivel para MetaTrader que proporciona múltiples herramientas dentro de un indicador. Las herramientas disponibles son: 1. Cribador de estructura de mercado. 2. Zona de retroceso alcista. 3. Zona de retroceso bajista. 4. Puntos pivotes diarios 5. Puntos de pivote semanales 6. Puntos Pivotes mensuales 7. Fuerte soporte y resistencia basado en patrón armónico y volumen. 8. Zonas de nivel de banco. OFERTA POR TIEMPO LIMITADO: El indicador de so

FX Power: Analiza la Fuerza de las Divisas para Decisiones de Trading Más Inteligentes Descripción General
FX Power es tu herramienta esencial para comprender la fuerza real de las principales divisas y el oro en cualquier condición de mercado. Al identificar divisas fuertes para comprar y débiles para vender, FX Power simplifica las decisiones de trading y descubre oportunidades de alta probabilidad. Ya sea que quieras seguir las tendencias o anticipar reversiones utilizando valores extremos

FX Volume: Experimente el Verdadero Sentimiento del Mercado desde la Perspectiva de un Bróker Resumen Rápido
¿Desea llevar su estrategia de trading a otro nivel? FX Volume ofrece información en tiempo real sobre cómo los traders minoristas y los brókers están posicionados, mucho antes de que aparezcan informes retrasados como el COT. Ya sea que busque beneficios consistentes o simplemente quiera una ventaja más profunda en los mercados, FX Volume le ayuda a identificar desequilibrios important

VERSION MT4 — ИНСТРУКЦИЯ RUS — INSTRUCTIONS ENG
Funciones principales: Señales de entrada precisas ¡SIN RENDERIZACIÓN! Si aparece una señal, ¡sigue siendo relevante! Esta es una diferencia importante con respecto a los indicadores de redibujo, que pueden proporcionar una señal y luego cambiarla, lo que puede provocar una pérdida de fondos depositados. Ahora puedes ingresar al mercado con mayor probabilidad y precisión. También existe la función de colorear las v

Te presento un excelente indicador técnico: Grabber, que funciona como una estrategia de trading "todo incluido" lista para usar.
En un solo código se integran potentes herramientas de análisis técnico del mercado, señales de trading (flechas), funciones de alertas y notificaciones push. Cada comprador de este indicador recibe además de forma gratuita: Grabber Utility: una herramienta para la gestión automática de órdenes abiertas Video manual paso a paso: cómo instalar, configurar y operar con

El indicador que redefinió el trading, se convirtió en el punto de referencia para el análisis de gráficos y estableció nuevos estándares en el trading. Zonas de reversión / Zonas de volumen máximo / Zonas activas de un jugador grande INSTRUCCIONES RUS INSTRUCCIONES ENG / Recomendamos utilizar con el indicador - TPSpro TREND PRO Cada comprador de este indicador recibe adicionalmente GRATIS:
6 meses de acceso a señales comerciales del servicio RFI SIGNALS: puntos

FX Levels: Zonas de Soporte y Resistencia con Precisión Excepcional para Todos los Mercados Resumen Rápido
¿Busca una manera confiable de identificar niveles de soporte y resistencia en cualquier mercado — ya sean divisas, índices, acciones o materias primas? FX Levels combina el método tradicional “Lighthouse” con un enfoque dinámico vanguardista, ofreciendo una precisión casi universal. Gracias a nuestra experiencia real con brokers y a las actualizaciones automáticas diarias más las de tiem

El Capturador de Tendencias:
La Estrategia del Capturador de Tendencias con Indicador de Alerta es una herramienta versátil de análisis técnico que ayuda a los traders a identificar las tendencias del mercado y los posibles puntos de entrada y salida. Presenta una Estrategia dinámica del Capturador de Tendencias, adaptándose a las condiciones del mercado para una clara representación visual de la dirección de la tendencia. Los traders pueden personalizar los parámetros para que se ajusten a su
FREE

Los Bloques de Orden de Oferta y Demanda:
El indicador "Bloques de Orden de Oferta y Demanda" es una herramienta sofisticada basada en Conceptos de Dinero Inteligente, fundamentales para el análisis técnico de Forex. Se enfoca en identificar zonas de oferta y demanda, áreas cruciales donde los traders institucionales dejan huellas significativas. La zona de oferta, que indica órdenes de venta, y la zona de demanda, que indica órdenes de compra, ayudan a los traders a anticipar posibles reversa
FREE

Gold Stuff mt5: un indicador de tendencia diseñado específicamente para el oro, también se puede usar en cualquier instrumento financiero. El indicador no se vuelve a dibujar ni se retrasa. El marco de tiempo recomendado es H1.
IMPORTANTE! Póngase en contacto conmigo inmediatamente después de la compra para obtener instrucciones y bonificación! Puede obtener una copia gratuita de nuestro indicador Strong Support y Trend Scanner, por favor envíe un mensaje privado. ¡a mí!
PARÁMETROS
Draw Ar

IX Power: Descubre perspectivas de mercado para índices, materias primas, criptomonedas y forex Descripción general
IX Power es una herramienta versátil diseñada para analizar la fortaleza de índices, materias primas, criptomonedas y símbolos de forex. Mientras que FX Power ofrece la máxima precisión para pares de divisas mediante el uso de datos de todos los pares disponibles, IX Power se centra exclusivamente en los datos del mercado del símbolo subyacente. Esto convierte a IX Power en una e

Este es posiblemente el indicador de reconocimiento automático de formación de precios más completo que puede encontrar para la plataforma MetaTrader. Detecta 19 patrones diferentes, toma las proyecciones de Fibonacci tan en serio como usted, muestra la zona de reversión potencial (PRZ) y encuentra niveles adecuados de stop-loss y take-profit. [ Guía de instalación | Guía de actualización | Solución de problemas | FAQ | Todos los productos ]
Detecta 19 formaciones de precios armónicos diferen

FourAverage es una nueva palabra en la detección de tendencias. Con el desarrollo de las tecnologías de la información y un gran número de participantes, los mercados financieros son cada vez menos susceptibles de ser analizados por indicadores obsoletos. Los medios técnicos convencionales de análisis, como la media Móvil o el Estocástico, en su forma pura no son capaces de determinar la dirección de la tendencia o su reversión. ¿Puede un indicador indicar la dirección correcta del precio futuro

Candle Timer Countdown muestra el tiempo restante antes de que se cierre la barra actual y se forme una nueva barra. Puede utilizarse para la gestión del tiempo.
¡Versión MT4 aquí !
Características destacadas
Realiza un seguimiento de la hora del servidor, no de la hora local Color de texto y tamaño de fuente configurables Visualización opcional de la variación diaria del símbolo Optimizado para reducir el uso de la CPU
Parámetros de entrada
Mostrar variación diaria: verdadero / falso Tamaño
FREE

Matrix Arrow Indicator MT5 es una tendencia única 10 en 1 que sigue un indicador 100% sin repintado de marcos temporales múltiples que se puede usar en todos los símbolos/instrumentos: divisas , materias primas , criptomonedas , índices , acciones . Matrix Arrow Indicator MT5 determinará la tendencia actual en sus primeras etapas, recopilando información y datos de hasta 10 indicadores estándar, que son: Índice de movimiento direccional promedio (ADX) Índice de canales de prod

El indicador Trend Line Map es un complemento para Trend Screener Indicator. Funciona como un escáner para todas las señales generadas por el evaluador de tendencias (Trend Line Signals).
Es un escáner de líneas de tendencia basado en el indicador de evaluación de tendencias. Si no tiene el indicador Trend Screener Pro, Trend Line Map Pro no funcionará. It's a Trend Line Scanner based on Trend Screener Indicator. If you don't have Trend Screener Pro Indicator, the Trend Line Map Pro will n
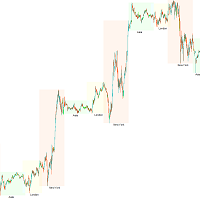
Los traders deben prestar atención al impacto de las zonas horarias de negociación, ya que los diferentes horarios de actividad del mercado y los volúmenes de negociación pueden afectar directamente la volatilidad y las oportunidades de negociación de los pares de divisas. Con el fin de ayudar a los traders a tener una comprensión integral de la situación del mercado y formular mejores estrategias de negociación, hemos desarrollado un indicador de sesión de negociación.
Este indicador muestra
FREE

El Buscador de Niveles de Soporte y Resistencia:
El Buscador de Niveles de Soporte y Resistencia es una herramienta avanzada diseñada para mejorar el análisis técnico en el trading. Con niveles de soporte y resistencia dinámicos, se adapta en tiempo real a medida que se desarrollan nuevos puntos clave en el gráfico, proporcionando un análisis dinámico y receptivo. Su capacidad única de múltiples marcos temporales permite a los usuarios mostrar niveles de soporte y resistencia de diferentes mar
FREE

Este tablero muestra los últimos patrones armónicos disponibles para los símbolos seleccionados, por lo que ahorrará tiempo y será más eficiente / versión MT4 . Indicador gratuito: Basic Harmonic Pattern
Columnas del indicador
Symbol: aparecerán los símbolos seleccionados Trend : alcista o bajista Pattern : tipo de patrón (gartley, mariposa, murciélago, cangrejo, tiburón, cifrado o ABCD) Entry : precio de entrada SL: precio de stop loss TP1: 1er precio de toma de beneficios

Indicador único que implementa un enfoque profesional y cuantitativo para el comercio de reversión a la media. Aprovecha el hecho de que el precio se desvía y vuelve a la media de manera predecible y medible, lo que permite reglas claras de entrada y salida que superan ampliamente las estrategias comerciales no cuantitativas. [ Installation Guide | Update Guide | Troubleshooting | FAQ | All Products ]
Señales comerciales claras Sorprendentemente fácil de operar Colores y tamaños personalizables

FX Dynamic: Rastrea la volatilidad y las tendencias con un análisis ATR personalizable Descripción general
FX Dynamic es una herramienta potente que emplea los cálculos de Average True Range (ATR) para brindar a los traders información incomparable sobre la volatilidad diaria e intradía. Al establecer umbrales de volatilidad claros —por ejemplo, 80%, 100% y 130%— puedes identificar rápidamente oportunidades de beneficio o recibir alertas cuando el mercado excede sus rangos habituales. FX Dynam

Ante todo, vale la pena enfatizar que esta Herramienta de Trading es un Indicador No Repintado, No Redibujado y No Retrasado, lo que la hace ideal para el trading profesional.
Curso en línea, manual del usuario y demostración. El Indicador de Conceptos de Acción del Precio Inteligente es una herramienta muy potente tanto para traders nuevos como experimentados. Combina más de 20 indicadores útiles en uno solo, combinando ideas avanzadas de trading como el Análisis del Trader del Círculo Interi

- Lifetime update free Contact me for instruction, any questions! Related Product: Gold Trade Expert MT5 - Non-repaint - I just sell my products in Elif Kaya Profile, any other websites are stolen old versions, So no any new updates or support. Introduction The breakout and retest strategy is traded support and resistance levels. it involves price breaking through a previous level. The break and retest strategy is designed to help traders do two main things, the first is to avoid false breako

¿Cansado de trazar líneas de soporte y resistencia? La resistencia de soporte es un indicador de marco de tiempo múltiple que detecta y traza automáticamente los soportes y las líneas de resistencia en el gráfico con un giro muy interesante: a medida que los niveles de precios se prueban con el tiempo y aumenta su importancia, las líneas se vuelven más gruesas y oscuras. [ Guía de instalación | Guía de actualización | Solución de problemas | FAQ | Todos los productos ] Mejora tu análisis técnic

Royal Scalping Indicator is an advanced price adaptive indicator designed to generate high-quality trading signals. Built-in multi-timeframe and multi-currency capabilities make it even more powerful to have configurations based on different symbols and timeframes. This indicator is perfect for scalp trades as well as swing trades. Royal Scalping is not just an indicator, but a trading strategy itself. Features Price Adaptive Trend Detector Algorithm Multi-Timeframe and Multi-Currency Trend Low

This is an indicator that includes the best basic forex indicators , without redrawing. Based on this data, a sell or buy signal is generated. It does not disappear anywhere after the signal, which gives us the opportunity to see the results on the history.
It can be used on any currency pair, crypto, metals, stocks
It is best used on an hourly chart, but other periods are also acceptable.
The best results for the period H1,H4,daily
If customers have any questions, I will answer them and af

Tendencia del oro : se trata de un buen indicador técnico bursátil. El algoritmo del indicador analiza el movimiento del precio de un activo y refleja la volatilidad y las posibles zonas de entrada.
Las mejores señales del indicador:
- Para VENTA = histograma rojo + puntero rojo CORTO + flecha amarilla de señal en la misma dirección. - Para COMPRA = histograma azul + puntero azul LARGO + flecha de señal aqua en la misma dirección.
Ventajas del indicador:
1. El indicador produce señales co

Descubra el Canal de Regresión LT, un poderoso indicador técnico que combina elementos de análisis de Fibonacci, análisis de Envoltura y extrapolar Fourier. Este indicador está diseñado para evaluar la volatilidad del mercado mientras mejora la precisión en la identificación de niveles de sobrecompra y sobreventa a través del análisis de Fibonacci. También utiliza la extrapolar Fourier para predecir movimientos del mercado al integrar datos de estos indicadores. Nuestra herramienta versátil se p
FREE
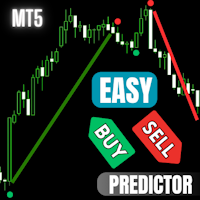
Easy Buy Sell is a market indicator for opening and closing positions. It becomes easy to track market entries with alerts.
It indicates trend reversal points when a price reaches extreme values and the most favorable time to enter the market. it is as effective as a Fibonacci to find a level but it uses different tools such as an algorithm based on ATR indicators and Stochastic Oscillator. You can modify these two parameters as you wish to adapt the settings to the desired period. It cannot
FREE

Special offer : ALL TOOLS , just $35 each! New tools will be $30 for the first week or the first 3 purchases ! Trading Tools Channel on MQL5 : Join my MQL5 channel to update the latest news from me Volumatic VIDYA (Variable Index Dynamic Average) es un indicador avanzado diseñado para rastrear tendencias y analizar la presión de compra-venta en cada fase de una tendencia. Utilizando el Promedio Dinámico de Índice Variable (Variable Index Dynamic Average) como técnica principal de s

Primero que todo, vale la pena enfatizar que este Sistema de Trading es un Indicador No Repintado, No Redibujado y No Retrasado, lo que lo hace ideal tanto para el trading manual como para el automatizado. Curso en línea, manual y descarga de ajustes preestablecidos. El "Sistema de Trading Inteligente MT5" es una solución completa de trading diseñada para traders nuevos y experimentados. Combina más de 10 indicadores premium y presenta más de 7 estrategias de trading robustas, lo que lo convier
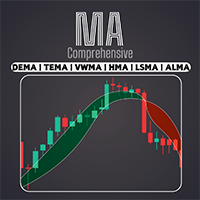
Acceda a una amplia gama de medias móviles, incluyendo EMA, SMA, WMA, y muchas más con nuestro indicador profesional Comprehensive Moving Average . Personalice su análisis técnico con la combinación perfecta de medias móviles para adaptarse a su estilo único de trading / Versión MT4
Características
Posibilidad de activar dos MAs con diferentes configuraciones. Posibilidad de personalizar la configuración del gráfico. Posibilidad de cambiar el color de las velas en función de las MAs cruzad
FREE
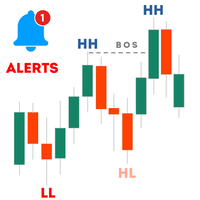
El Indicador Haven Market Structure ayuda a los traders a identificar puntos de reversión y rupturas de la estructura en cualquier marco de tiempo. Marca los máximos más altos (HH), los máximos más bajos (LH), los mínimos más altos (HL), los mínimos más bajos (LL) y resalta los niveles de ruptura de la estructura (BOS).
Otros productos -> AQUÍ Características principales: Longitud personalizable para identificar puntos de reversión: Establezca la longitud para identificar con precisión lo
FREE

Presentamos Quantum TrendPulse , la herramienta de trading definitiva que combina el poder de SuperTrend , RSI y Stochastic en un indicador integral para maximizar su potencial de trading. Diseñado para traders que buscan precisión y eficiencia, este indicador le ayuda a identificar tendencias del mercado, cambios de impulso y puntos de entrada y salida óptimos con confianza. Características principales: Integración con SuperTrend: siga fácilmente la tendencia predominante del

Auto Order Block with break of structure based on ICT and Smart Money Concepts (SMC)
Futures Break of Structure ( BoS )
Order block ( OB )
Higher time frame Order block / Point of Interest ( POI ) shown on current chart
Fair value Gap ( FVG ) / Imbalance - MTF ( Multi Time Frame )
HH/LL/HL/LH - MTF ( Multi Time Frame )
Choch MTF ( Multi Time Frame )
Volume Imbalance , MTF vIMB
Gap’s Power of 3
Equal High / Low’s

En primer lugar, vale la pena enfatizar que este Indicador de Trading no repinta, no redibuja y no se retrasa, lo que lo hace ideal tanto para el trading manual como para el automatizado. Manual del usuario: configuraciones, entradas y estrategia. El Analista Atómico es un Indicador de Acción del Precio PA que utiliza la fuerza y el impulso del precio para encontrar una mejor ventaja en el mercado. Equipado con filtros avanzados que ayudan a eliminar ruidos y señales falsas, y aumentan el poten

Experimente el comercio como nunca antes con nuestro incomparable indicador MT5 Fair Value Gap (FVG)
aclamado como el mejor de su clase. Este indicador de mercado MQL5 va más allá de lo común,
proporcionando a los operadores un nivel inigualable de precisión y conocimiento de la dinámica del mercado. EA Version: WH Fair Value Gap EA MT5
Características:
Análisis de brechas de valor razonable, el mejor de su clase. Personalización. Alertas en tiempo real. Perfección fácil de usar Compatibili
FREE

Easy Buy Sell is a market indicator for opening and closing positions. It becomes easy to track market entries with alerts.
It indicates trend reversal points when a price reaches extreme values and the most favorable time to enter the market. it is as effective as a Fibonacci to find a level but it uses different tools such as an algorithm based on ATR indicators and Stochastic Oscillator. You can modify these two parameters as you wish to adapt the settings to the desired period. It cannot

El Indicador de Tiempo de Sesiones de Trading:
El "Indicador de Tiempo de Sesiones de Trading" es una poderosa herramienta de análisis técnico diseñada para mejorar su comprensión de las diferentes sesiones de trading en el mercado de divisas. Este indicador integrado de forma transparente proporciona información crucial sobre los horarios de apertura y cierre de las principales sesiones, incluidas Tokio, Londres y Nueva York. Con el ajuste automático de la zona horaria, atiende a los traders
FREE

KT Trend Trading Suite es un indicador multifuncional que combina una estrategia de seguimiento de tendencias con múltiples puntos de ruptura como señales de entrada.
Una vez que se establece una nueva tendencia, el indicador proporciona varias oportunidades de entrada para aprovecharla con éxito. Se utiliza un umbral de retroceso para evitar señales de entrada poco significativas.
La versión para MT4 está disponible aquí https://www.mql5.com/en/market/product/46268
Características
Combina
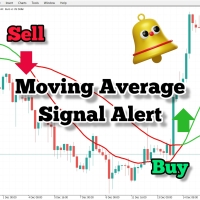
Si utiliza medias móviles en su estrategia de trading, entonces este indicador puede ser muy útil para usted. Proporciona alertas cuando hay un cruce de dos medias móviles, envía alertas audibles, muestra notificaciones en su plataforma de trading y también envía un correo electrónico sobre el evento. Viene con ajustes fácilmente personalizables para adaptarse a su propio estilo y estrategia de trading. Parámetros ajustables: MA rápida MA lenta Enviar correo electrónico Alertas audibles Notific
FREE

Trend Hunter es un indicador de tendencias para trabajar en los mercados Forex, criptomonedas y CFD. Una característica especial del indicador es que sigue con confianza la tendencia, sin cambiar la señal cuando el precio perfora ligeramente la línea de tendencia. El indicador no se vuelve a dibujar; aparece una señal para ingresar al mercado después del cierre de la barra.
Al avanzar a lo largo de una tendencia, el indicador muestra puntos de entrada adicionales en la dirección de la tendenci

El indicador de detección de tendencias complementará cualquier estrategia y también se puede utilizar como una herramienta independiente.
Ventajas
Fácil de usar, no sobrecarga el gráfico con información innecesaria; Puede usarse como filtro para cualquier estrategia; Tiene niveles integrados de soporte y resistencia dinámicos, que se pueden usar tanto para obtener ganancias como para establecer límites de pérdidas; El indicador no cambia de color después de que se cierra la vela; Funciona e

Was: $299 Now: $149 Supply Demand uses previous price action to identify potential imbalances between buyers and sellers. The key is to identify the better odds zones, not just the untouched ones. Blahtech Supply Demand indicator delivers functionality previously unavailable on any trading platform. This 4-in-1 indicator not only highlights the higher probability zones using a multi-criteria strength engine, but also combines it with multi-timeframe trend analysis, previously confirmed swings

El indicador básico de oferta y demanda es una potente herramienta diseñada para mejorar su análisis de mercado y ayudarle a identificar áreas clave de oportunidad en cualquier gráfico. Con una interfaz intuitiva y fácil de usar, este indicador gratuito de Metatrader le ofrece una visión clara de las zonas de oferta y demanda, lo que le permite tomar decisiones de trading más informadas y precisas / Versión gratuita para MT4 Escáner del cuadro de mando para este indicador: ( Basic Supply
FREE

Visual Heatmap Book Analyser
This indicator monitors the market liquidity and generates colors based on order patterns, quantities, and renewal activities in the book. This allows you to visualize the order flow and identify areas of high and low liquidity and activity. The indicator uses machine learning techniques to analyze the order behavior in the book, enabling it to detect patterns and trends in orders, allowing you to make informed decisions about your trading operations. The color pale

KT Candlestick Patterns detecta y marca en tiempo real los 24 patrones de velas japonesas más confiables. Desde el siglo XVIII, los traders japoneses han utilizado estos patrones para predecir la dirección del precio. Es cierto que no todos los patrones de velas tienen la misma fiabilidad para predecir el mercado. Sin embargo, cuando se combinan con otros métodos de análisis técnico como Soporte y Resistencia, proporcionan una visión clara del comportamiento del mercado.
Este indicador incluye

ICT, SMC, SMART MONEY CONCEPTS, SMART MONEY, Smart Money Concept, Support and Resistance, Trend Analysis, Price Action, Market Structure, Order Blocks, BOS/CHoCH, Breaker Blocks , Momentum Shift, Supply&Demand Zone/Order Blocks , Strong Imbalance, HH/LL/HL/LH, Fair Value Gap, FVG, Premium & Discount Zones, Fibonacci Retracement, OTE, Buy Side Liquidity, Sell Side Liquidity, BSL/SSL Taken, Equal Highs & Lows, MTF Dashboard, Multiple Time Frame, BigBar, HTF OB, HTF Market Structure

Dark Absolute Trend is an Indicator for intraday trading. This Indicator is based on Trend Following strategy but use also candlestick patterns and Volatility. We can enter in good price with this Indicator, in order to follow the main trend on the current instrument. It is advised to use low spread ECN brokers. This Indicator does Not repaint and N ot lag . Recommended timeframes are M5, M15 and H1. Recommended working pairs: All. I nstallation and Update Guide - Troubleshooting

Este es un genial indicador para MT5 que ofrece señales precisas para entrar en una transacción sin redibujar. Se puede aplicar a cualquier activo financiero: fórex, criptomonedas, metales, acciones, índices. Nos dará valoraciones bastante precisas y nos dirá cuándo es mejor abrir y cerra una transacción. Eche un vistazo al vídeo (6:22), ¡contiene un ejemplo de procesamiento de una sola señal que ha amortizado el indicador! La mayoría de los tráders mejoran sus resultados comerciales durante l

[ MT4 Version ] Are you tired of spending months on demo or live accounts to test your trading strategies? The Backtesting Simulator is the ultimate tool designed to elevate your backtesting experience to new heights. Utilizing Metatrader historical symbol information, it offers an unparalleled simulation of real market conditions. Take control of your testing speed, test ideas quickly or at a slower pace, and witness remarkable improvements in your testing performance. Forget about wasting tim

Si te gusta este proyecto, deja una revisión de 5 estrellas. El precio medio ponderado es la relación del valor negociado con el volumen
total
cambió sobre un horizonte temporal particular. Es una medida del precio promedio
a
que un stock se comercializa sobre el horizonte comercial. VWAP a menudo se
utiliza como
referencia comercial de inversores que pretenden ser lo más pasivos posible en
su
ejecución. Con este indicador podrás dibujar el VWAP para: Día actual. Semana actual. Mes actual. C
FREE
Por favor, deje una reseña positiva.
Nota importante: La imagen que se muestra en las capturas de pantalla es de mis indicadores, el indicador "Suleiman Levels" y el indicador "RSI Trend V", incluyendo, por supuesto, la "Vela de Tiempo" adjunta, que originalmente es parte del indicador integral para análisis avanzado y niveles exclusivos, "Suleiman Levels". Si le gusta, pruebe el indicador "RSI Trend V":
https://www.mql5.com/en/market/product/132080 y si le gusta, pruebe el indicador "Suleiman
FREE

Este indicador identifica los patrones armónicos más populares que predicen los puntos de reversión del mercado. Estos patrones armónicos son formaciones de precios que se repiten constantemente en el mercado de divisas y sugieren posibles movimientos futuros de los precios / Free MT4 Version Además, este indicador tiene incorporada una señal de entrada en el mercado, así como varios take profits y stop losses. Debe tenerse en cuenta que aunque el indicador de patrón armónico puede propor
FREE

After your purchase, feel free to contact me for more details on how to receive a bonus indicator called VFI, which pairs perfectly with Easy Breakout for enhanced confluence!
Easy Breakout MT5 is a powerful price action trading system built on one of the most popular and widely trusted strategies among traders: the Breakout strategy ! This indicator delivers crystal-clear Buy and Sell signals based on breakouts from key support and resistance zones. Unlike typical breakout indicators

Royal Wave is a Trend-Power oscillator which has been programmed to locate and signal low-risk entry and exit zones. Its core algorithm statistically analyzes the market and generates trading signals for overbought, oversold and low volatile areas. By using a well-designed alerting system, this indicator makes it easier to make proper decisions regarding where to enter and where to exit trades. Features Trend-Power Algorithm Low risk Entry Zones and Exit Zones Predictions for Overbought and Over

Gartley Hunter Multi - An indicator for searching for harmonic patterns simultaneously on dozens of trading instruments and on all possible timeframes. Manual (Be sure to read before purchasing) | Version for MT4 Advantages 1. Patterns: Gartley, Butterfly, Shark, Crab. Bat, Alternate Bat, Deep Crab, Cypher
2. Simultaneous search for patterns on dozens of trading instruments and on all possible timeframes
3. Search for patterns of all possible sizes. From the smallest to the largest
4. All fou

MetaForecast predice y visualiza el futuro de cualquier mercado basándose en las armonías de los datos de precios. Aunque el mercado no siempre es predecible, si existe un patrón en el precio, MetaForecast puede predecir el futuro con la mayor precisión posible. En comparación con otros productos similares, MetaForecast puede generar resultados más precisos al analizar las tendencias del mercado.
Parámetros de entrada Past size (Tamaño del pasado) Especifica el número de barras que MetaForecast

Trend Trading es un indicador diseñado para sacar el máximo provecho posible de las tendencias que tienen lugar en el mercado, mediante el cronometraje de retrocesos y rupturas. Encuentra oportunidades comerciales al analizar qué está haciendo el precio durante las tendencias establecidas. [ Guía de instalación | Guía de actualización | Solución de problemas | FAQ | Todos los productos ]
Opere en los mercados financieros con confianza y eficiencia Aproveche las tendencias establecidas sin ser

CONTACT US after purchase to get the Indicator Manual. DOWNLOAD NOW —Discount valid for the first 10 Buyers ONLY!
Download the Metatrader 4 Version Read the product description carefully before purchasing the product. Due to regulatory restrictions, our service is unavailable in certain countries such as India, Pakistan, and Bangladesh. Disclaimer: • Our products are available only on mql5.com. • We never contact anyone or sell our products privately. • We do not provide any personal tradin
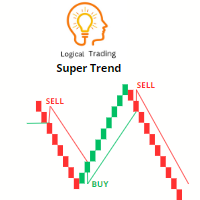
El indicador Super Trend es una herramienta popular de análisis técnico utilizada por traders para identificar la dirección de una tendencia y los posibles puntos de entrada y salida en el mercado. Es un indicador que sigue la tendencia y proporciona señales basadas en la acción del precio y la volatilidad.
El indicador Super Trend consta de dos líneas: una indica la tendencia alcista (generalmente de color verde) y la otra indica la tendencia bajista (generalmente de color rojo). Las líneas s
FREE

Over 100,000 users on MT4 and MT5 Blahtech Candle Timer displays the remaining time before the current bar closes and a new bar forms. It can be used for time management Links [ Install | Update | Training ] Feature Highlights
The only candle timer on MT5 with no stutter and no lag S electable Location Tracks server time not local time Multiple colour Schemes Configurable Text Customisable alerts and messages Optimised to reduce CPU usage Input Parameters Text Location - Beside / Upper Le
FREE

*** "A market analysis tool that integrates Smart Money Concept (SMC) and Reversal Signals, featuring an automated system for analyzing Market Structure, Order Blocks, Liquidity, POI, Premium & Discount Zones, Trade Session, and a customizable Dashboard tailored to your trading style." ***
*** Kindly read this message :Would you like a Risk Per Trade Calculator as well? This version does not include a Risk Per Trade Calculator, but you can get it in the Utility section!**** **** https://www.mq

Reversal Algo es un indicador técnico diseñado para ayudar a los traders a identificar posibles puntos de reversión en la tendencia del mercado. A través de un análisis profundo de los datos históricos de precios, este indicador detecta máximos y mínimos clave que podrían indicar un cambio en la dirección del mercado. Su sistema de señales visuales claras permite a los traders identificar zonas críticas donde podría producirse una reversión de tendencia. Características principales Detección de

Economiza tiempo y toma decisiones más certeras con las VWAPs ancladas Si deseas probar el poder de esta herramienta, puedes descargar el indicador gratuito de VWAPs ancladas para MT5 . Además de trabajar de forma independiente, este indicador también es una extensión para la versión gratuita Sweet VWAP. Esto se debe a que, al hacer clic en la versión gratuita, la VWAP que ves en el puntero del ratón se fijará. Y para una mejor comprensión, lo que estará fijado allí es este indicador, con todas

ATREND: Cómo Funciona y Cómo Usarlo #### Cómo Funciona El indicador "ATREND" para la plataforma MT5 está diseñado para proporcionar a los traders señales de compra y venta robustas mediante una combinación de metodologías de análisis técnico. Este indicador utiliza principalmente el Rango Verdadero Promedio (ATR) para medir la volatilidad, junto con algoritmos de detección de tendencias para identificar posibles movimientos del mercado. Deja un mensaje después de la compra y recibe un regalo es
MetaTrader Market - robots comerciales e indicadores técnicos para los trádres, disponibles directamente en el terminal.
El sistema de pago MQL5.community ha sido desarrollado para los Servicios de la plataforma MetaTrader y está disponible automáticamente para todos los usuarios registrados en el sitio web MQL5.com. Puede depositar y retirar el dinero a través de WebMoney, PayPal y tarjetas bancarias.
Está perdiendo oportunidades comerciales:
- Aplicaciones de trading gratuitas
- 8 000+ señales para copiar
- Noticias económicas para analizar los mercados financieros
Registro
Entrada
Si no tiene cuenta de usuario, regístrese
Para iniciar sesión y usar el sitio web MQL5.com es necesario permitir el uso de Сookies.
Por favor, active este ajuste en su navegador, de lo contrario, no podrá iniciar sesión.