• Información general
  • Comentarios (11)
  • Discusión (59)
  • Novedades

Chart Patterns All in One

4.25

Deja un comentario después de la compra para recibir 4 indicadores de alta calidad como bono.

El indicador Chart Patterns All-in-One ayuda a los traders a visualizar varios patrones de gráficos comúnmente utilizados en el análisis técnico. Este indicador apoya la identificación de posibles comportamientos del mercado, pero no garantiza rentabilidad. Se recomienda probar el indicador en modo demo antes de comprar.

Oferta actual: Descuento del 50% en el indicador "Chart Patterns All in One".

Patrones incluidos:

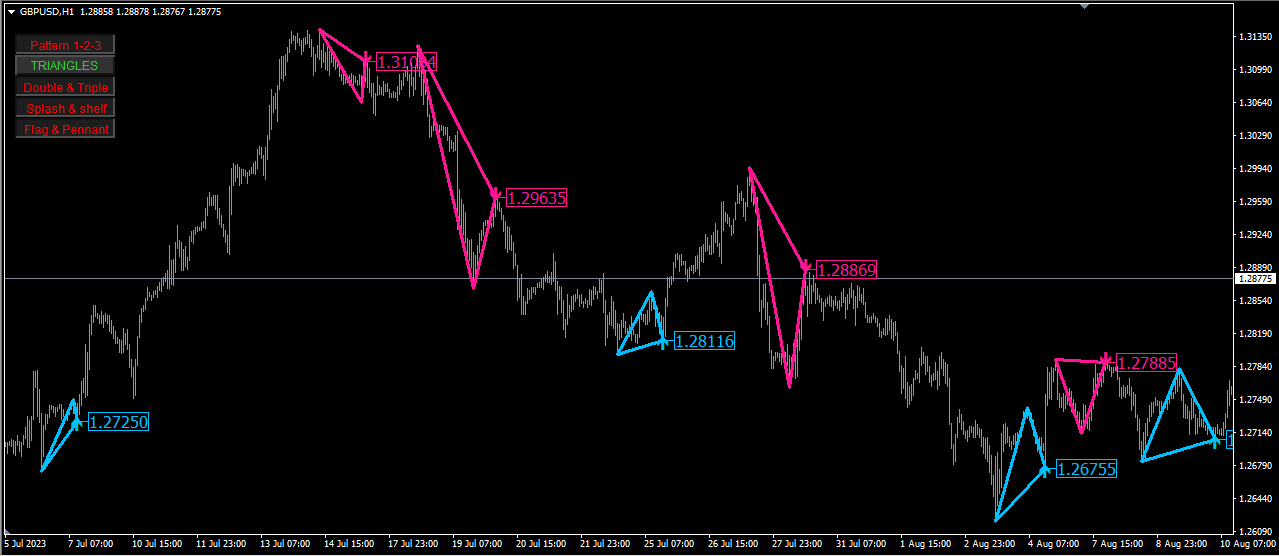
  • Patrón 1-2-3: Detecta reversiones del mercado utilizando tres puntos clave (máximos o mínimos).

    • Compra: Dos mínimos consecutivos seguidos por un máximo más bajo.
    • Venta: Dos máximos consecutivos seguidos por un mínimo más alto.
    • Visualización: Líneas y flechas conectan los puntos identificados.
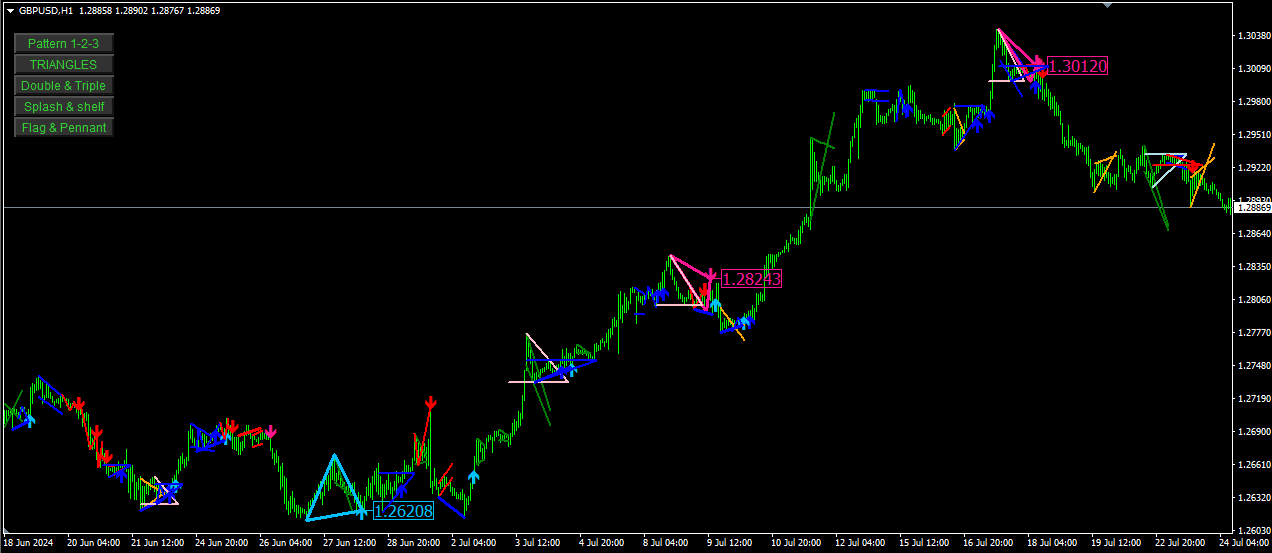
  • Doble techo y doble suelo: Indica posibles reversiones cuando el precio forma dos máximos consecutivos (Doble techo) o dos mínimos consecutivos (Doble suelo) que son aproximadamente iguales.

    • Doble techo: Reversión bajista.
    • Doble suelo: Reversión alcista.
    • Visualización: Líneas conectan los picos o valles, y flechas marcan los puntos de reversión.
  • Triple techo y triple suelo: Similar al doble techo/suelo, pero con tres máximos o mínimos consecutivos, lo que indica una señal de reversión más fuerte.

    • Triple techo: Reversión bajista.
    • Triple suelo: Reversión alcista.
    • Visualización: Líneas y flechas marcan el patrón.
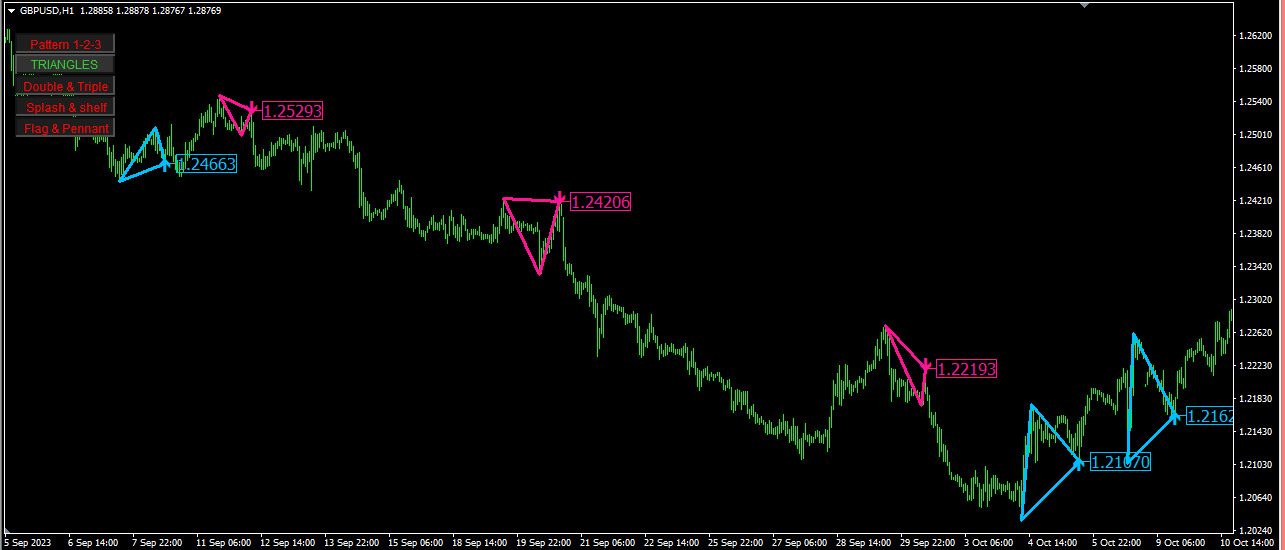
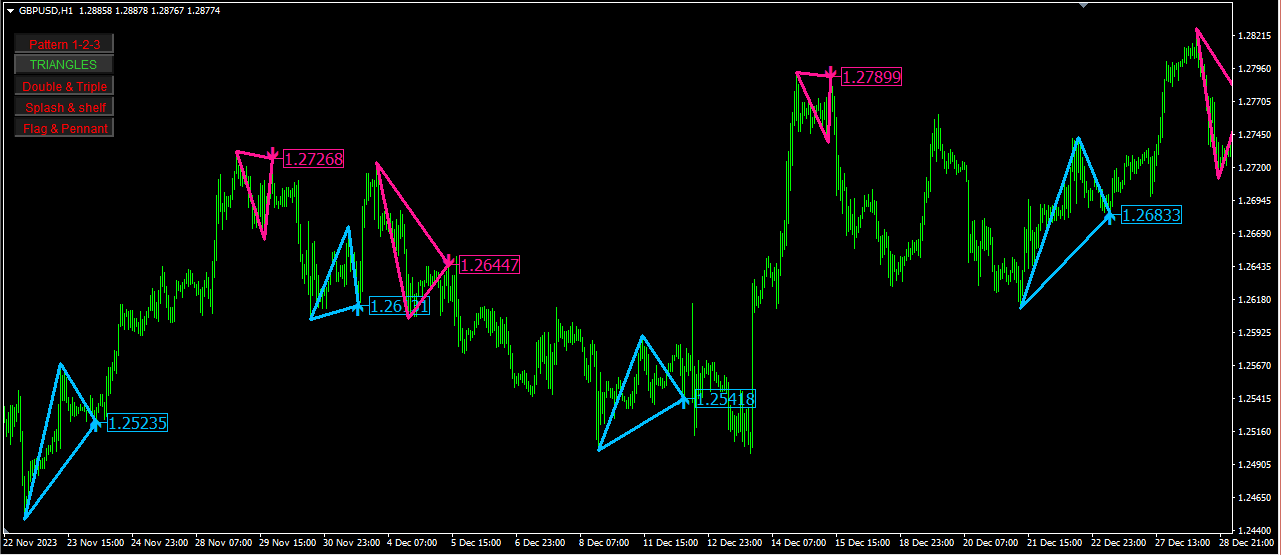
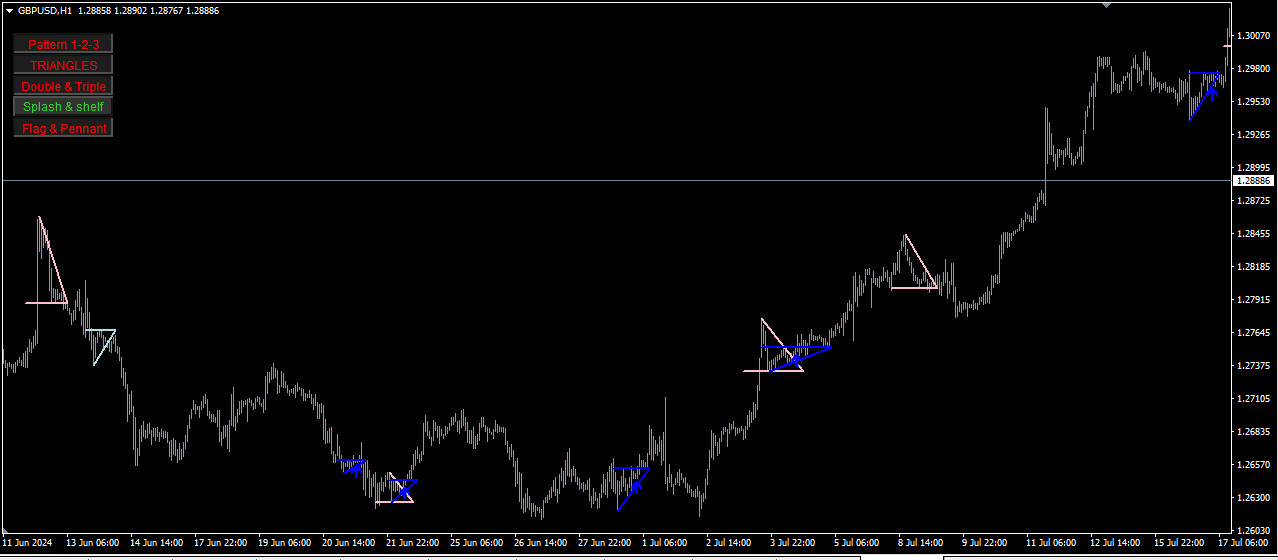
  • Triángulos: Identifican períodos de consolidación antes de que continúe la tendencia (basados en Zig-Zag, pueden aparecer tarde o desaparecer ocasionalmente).

    • Triángulo ascendente: Continuación alcista.
    • Triángulo descendente: Continuación bajista.
    • Visualización: Los triángulos se dibujan en el gráfico con flechas que marcan los puntos de ruptura.
    • A pesar de las posibles demoras o desapariciones debido al Zig-Zag, este patrón sigue siendo efectivo. Para más detalles, mira el video.
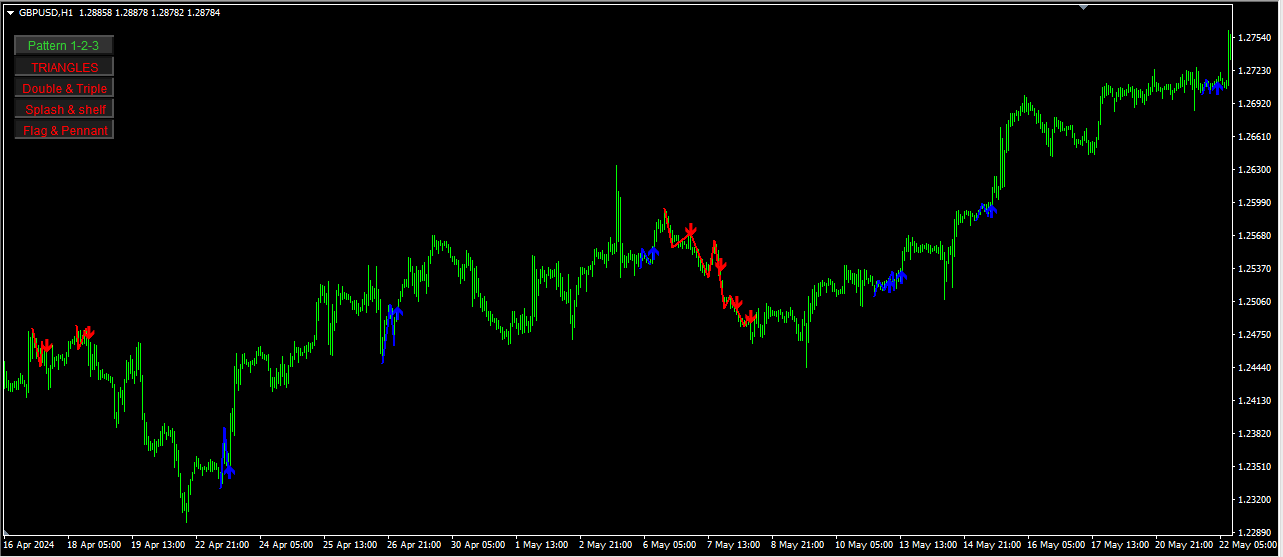
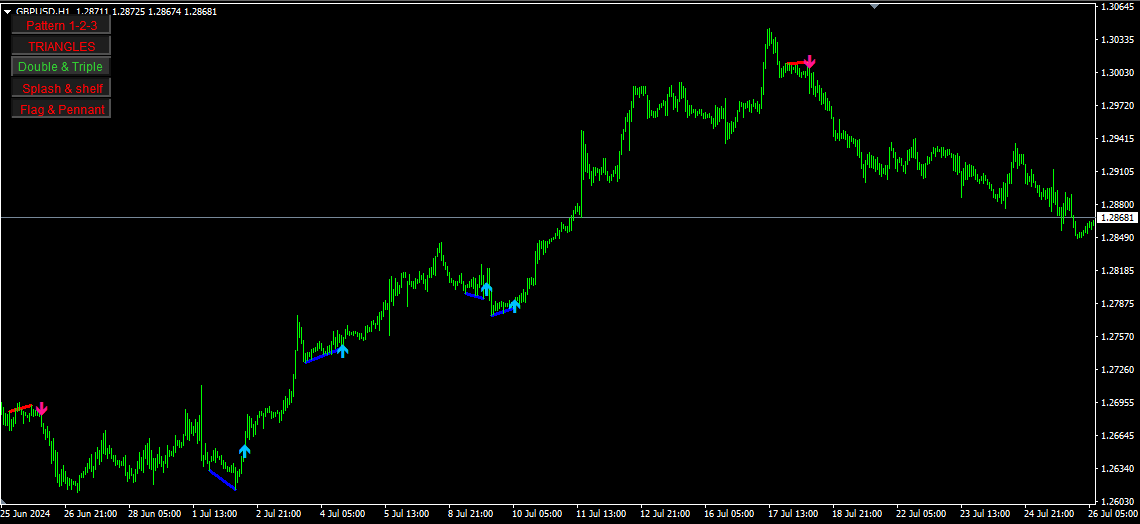
  • Splash y Shelf: Identifica movimientos bruscos de precios (Splash) seguidos de fases de consolidación (Shelf), lo que puede indicar rupturas potenciales.

    • Splash: Movimiento brusco.
    • Shelf: Consolidación después del Splash.
    • Visualización: Líneas de tendencia y horizontales para los patrones Splash y Shelf.
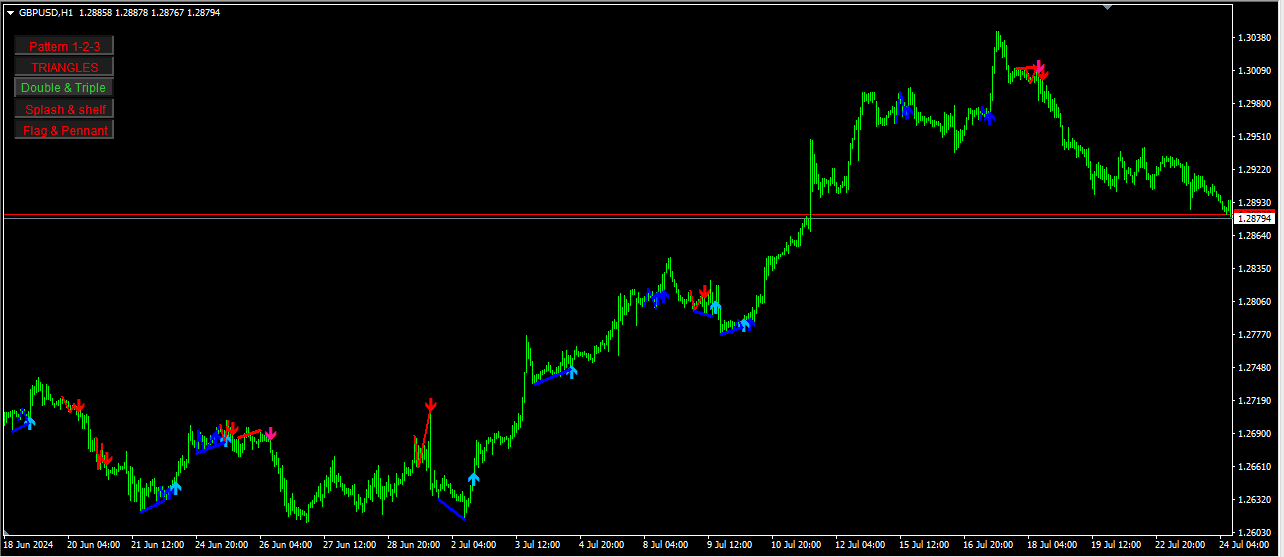
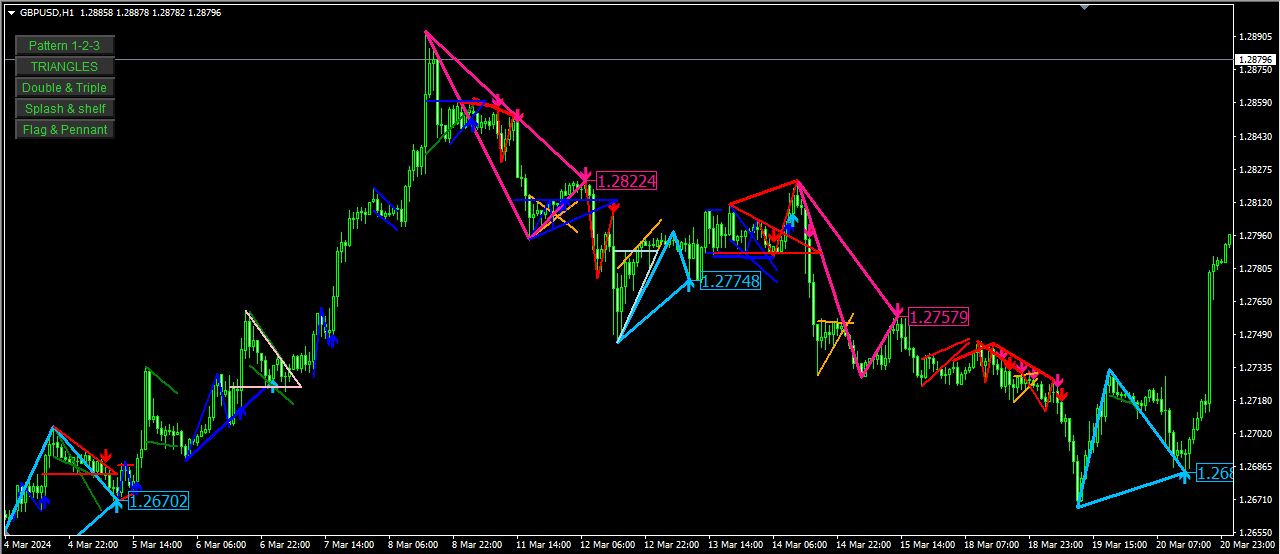
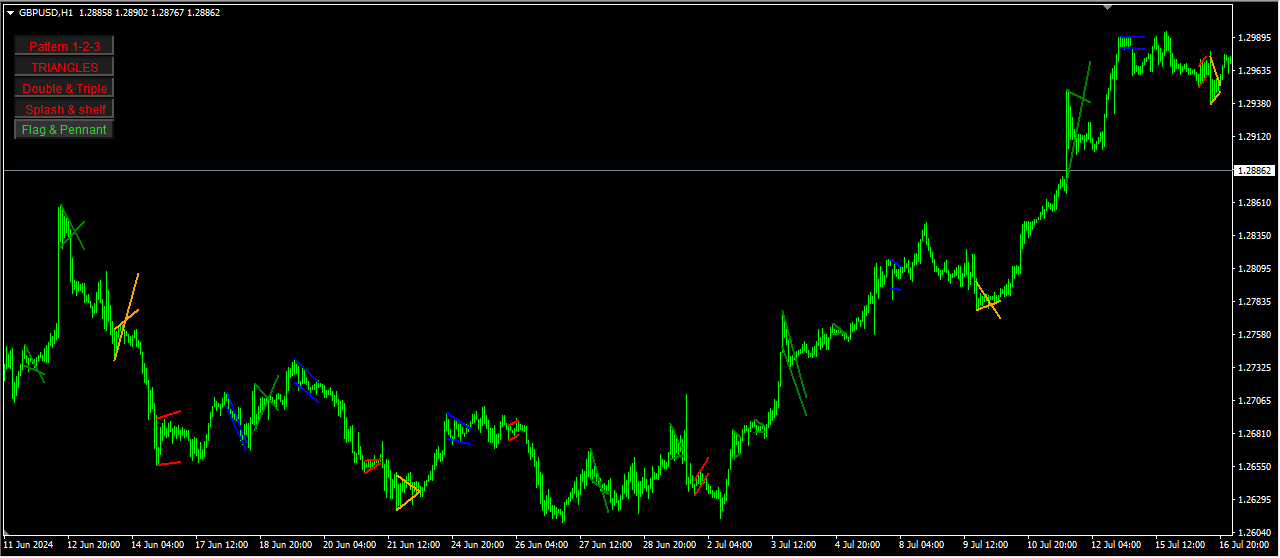
  • Bandera y banderín: Patrones de continuación a corto plazo que señalan una breve pausa antes de que la tendencia continúe.

    • Bandera alcista: Continuación de la tendencia alcista.
    • Bandera bajista: Continuación de la tendencia bajista.
    • Banderín: Patrón de continuación que forma un pequeño triángulo simétrico.
    • Visualización: Formas y flechas indican el patrón y los puntos de ruptura.

Características:

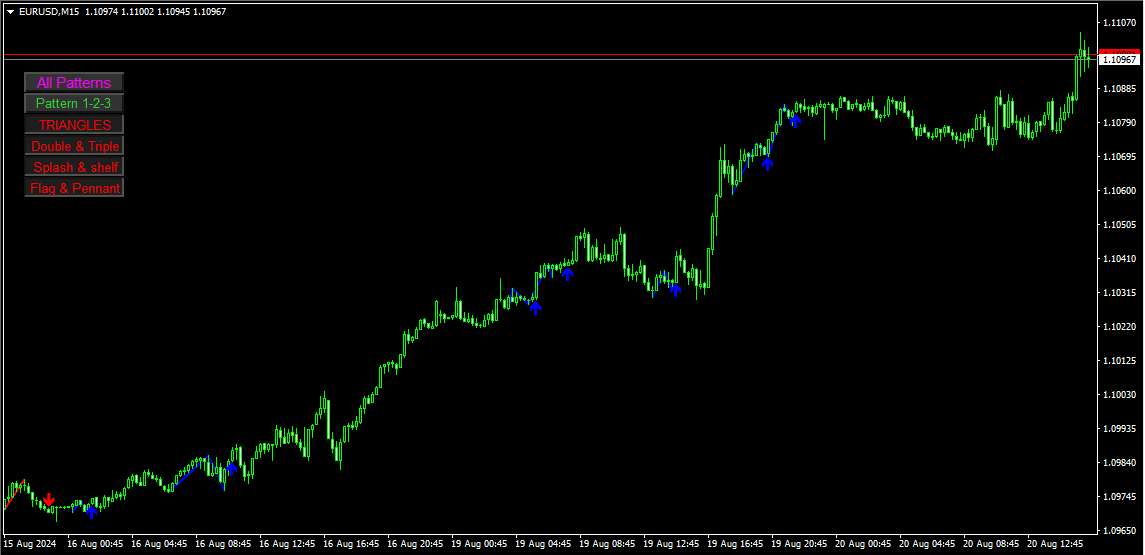
  • Alternar patrones: Activa o desactiva fácilmente los patrones con botones en el gráfico.
  • Configuraciones personalizables: Ajusta colores, anchos de línea y configuraciones específicas de los patrones.
  • Alertas y notificaciones: Configura alertas cuando se detectan patrones.

Visualización:

  • Líneas y flechas: Representación visual clara de los patrones.
  • Botones interactivos: Alterna la visibilidad de los patrones directamente en el gráfico.

Este indicador todo en uno simplifica el análisis de múltiples patrones de gráficos, ofreciendo una herramienta flexible y personalizable para los usuarios de MT4.

Comentarios 11
Mikeladze Roland
21
Mikeladze Roland 2024.09.17 10:55 
 

I’ve been testing before purchase and using the Chart Patterns All in One indicator for a while now, and I have to say it’s an excellent tool—especially if you understand how to properly use all the features it offers. One thing to be aware of: the triangles are based on the ZigZag indicator, which means they can sometimes disappear or appear later as the price action evolves. This is a natural behavior of any ZigZag-based tool, and it’s clearly mentioned in the product description. However, there’s a smart way to make the most of these triangles: by using a confirmation timeframe. This means before you take a trade based on a triangle signal, you first confirm it on a higher timeframe. By doing this, you can significantly improve the reliability of the signals, even when dealing with patterns that may repaint. That said, it’s important to note that the ZigZag-based triangles are just one of the many patterns available in this indicator. The other patterns—such as the 1-2-3, Double Top/Bottom, and others—do not repaint and work flawlessly. To sum it up, this is a great indicator from Mr. Beridze for those who know how to appreciate good, professional, and effective work. It’s an essential tool to understand what’s happening on your chart and the direction of price. 5 stars for this!

fangfang
51
fangfang 2024.09.07 19:21 
 

I personally think that triangles are very useful as a tool for determining direction. As long as you are not greedy, weekly profits are more lucrative than working. The author is very meticulous, and the user manual covers languages from various countries. The overall experience is great.

Junichi Isono
753
Junichi Isono 2024.08.27 01:40 
 

It is a very accurate indicator. I'm waiting for a sign on the 4-hour timeframe and looking for an entry point on the 15-minute timeframe, and both signs are valid.

Productos recomendados
Reversal Pattern Pro
Boonyapagorn Rodvattanajinda
Reversal Patterns Pro Reversal Patterns Pro is a Price Action (PA) analytical tool that scans the reversal patterns.  - Finds and marks the most dependable Japanese candlestick patterns in real-time. - Supports all time frames (Best for Scalping) - Doesn't repaint making it an exceptional indicator for Expert Advisors. Input parameters : - Support & Resistance Mode ( true or false ) for enabling advanced filtering - Donchian Period - RSI Period - RSI Oversold Level - RSI Overbought Level - 
The Penta-O is a 6-point retracement harmonacci pattern which usually precedes big market movements. Penta-O patterns can expand and repaint quite a bit. To make things easier this indicator implements a twist: it waits for a donchian breakout in the right direction before signaling the trade. The end result is an otherwise repainting indicator with a very reliable trading signal. The donchian breakout period is entered as an input. [ Installation Guide | Update Guide | Troubleshooting | FAQ | A
Trade with Gann on your side!! MASTER CIRCLE 360 CIRCLE CHART, originally created by Gann admitted that this is “The Mother of all charts”. It is one of the last studies that this great trader left for us. The numeric tab le is apparently quite simple like all the tables and is based on square numbers, the SQUARE OF 12 and is by evolution, one of the most important square numbers. Here we can find CYCLE, PRICE AND TIME thanks to angles and grades, to show past and future support and resistance.
Monster Harmonic Indicator
Paul Geirnaerdt
4.59 (29)
Monster Harmonics Indicator is a harmonic pattern indicator. It recognizes Gartley, Bat, Crab, Butterfly, Cypher, White Swan, Black Swan, Shark and several other patterns. Projected patterns that are not yet completed are recognized, too. Monster even shows the PRZ (Potential Reversal Zone). Users can add their own user defined patterns to Monster. Besides the current pattern, Monster also shows all patterns in the symbols history. Monster will provide alerts for developing patterns. Introduced
Introduction to X3 Chart Pattern Scanner X3 Cherart Pattern Scanner is the non-repainting and non-lagging indicator detecting X3 chart patterns including Harmonic pattern, Elliott Wave pattern, X3 patterns, and Japanese Candlestick patterns. Historical patterns match with signal patterns. Hence, you can readily develop the solid trading strategy in your chart. More importantly, this superb pattern scanner can detect the optimal pattern of its kind. In addition, you can switch on and off individu
The indicator provides a superior alternative to price action analysis. It enables the identification of normalized patterns, which are then transformed into a graphical representation to forecast future steps within a time series. In the top-left corner, you'll find information regarding the expected prediction accuracy, determined through a complex MSQE calculation. You have the flexibility to adjust the time window, making it easy to validate the indicator's performance. Additionally, you can
Day Pattern
Oleksandr Martsynyshen
Description: - D ay Pattern - an indicator that helps to identify patterns of price changes for the development of trading algorithms and strategies. For whom this tool? - For developers of trading strategies and algorithms. - Medium- and long-term traders. Time frames H1-W1. Features of the indicator: - There is a function of exporting indicator values to a file of the csv format. - Using the information panel, you can conduct an express analysis of trading tool. - The indicat
All Symbols   AND  All Time frames Scan                                                                                                                 Document Introduction   The ABCD is a basic harmonic pattern. The ABCD pattern is a visual, geometric chart pattern comprised of three consecutive price swings. It looks like a diagonal lightning bolt and can indicate an upcoming trading opp
RTrends
Nikolay Likhovid
The RTrends indicator does two things: first, it automatically draws the layout of the price chart by plotting trend lines and, secondly, it produces bearish and bullish signals. The layout reflects the fractal nature of the market. Trends from different time horizons are applied simultaneously on the chart. Thus, from a single chart a trader can see trend lines of higher timeframes. The lines, depending on the horizon, differ in color and width: the older the horizon, the thicker the line is. T
Indicador de Forex "Patrón de gancho" para MT4 El indicador "Patrón de gancho" es un indicador muy potente para el trading de acción del precio: no se repite el proceso ni se producen retrasos; El indicador detecta patrones de gancho alcistas y bajistas en el gráfico: Gancho alcista: señal de flecha azul en el gráfico (ver imágenes) Gancho bajista: señal de flecha roja en el gráfico (ver imágenes) Se incluyen alertas para PC, dispositivos móviles y correo electrónico El indicador "Patrón de g
Master Scalping M1 es un indicador innovador que utiliza un algoritmo para determinar la tendencia de forma rápida y precisa. El indicador calcula el tiempo de apertura y cierre de posiciones, los algoritmos del indicador le permiten encontrar los momentos ideales para ingresar a una operación (comprar o vender un activo), lo que aumenta el éxito de las transacciones para la mayoría de los comerciantes. Beneficios del indicador: Fácil de usar, no sobrecarga el gráfico con información innecesari
El indicador muestra patrones armónicos en el gráfico   sin repintar   con el mínimo retraso posible. La búsqueda de la parte superior de los indicadores se basa en el principio de onda del análisis de precios. La configuración avanzada le permite elegir parámetros para su estilo de negociación. En la apertura de una vela (barra), cuando se forma un nuevo patrón, se fija una flecha de la dirección probable del movimiento del precio, que permanece sin cambios. El indicador reconoce los siguientes
PZ 123 Pattern
PZ TRADING SLU
1 (1)
El patrón 123 es uno de los patrones de gráficos más populares, potentes y flexibles. El patrón se compone de tres puntos de precio: un fondo, un pico o valle, y un retroceso de Fibonacci entre 38.2% y 71.8%. Un patrón se considera válido cuando el precio se rompe más allá del último pico o valle, momento en el que el indicador traza una flecha, levanta una alerta y se puede colocar el comercio. [ Guía de instalación | Guía de actualización | Solución de problemas | FAQ | Todos los productos ]
Introduction to Chart Pattern MT Chart Pattern MT is a chart pattern scanner to detect the triangle pattern, falling wedge pattern, rising wedge pattern, channel pattern and so on. Chart Pattern MT uses highly sophisticated chart pattern detection algorithm. However, we have designed it in the easy to use with intuitive user interface. Chart Pattern MT will show all the patterns in your chart in the most efficient format for your trading. You do not have to do tedious manual pattern detection an
Gold Phoenix
Yaroslav Varankin
The perfect tool for Scalng in the Forex markets You can trade both from signal to signal and using take profit  The algorithm does not use Zigzag!  No redrawing!  This is a channel instrument that uses a moving average as a filter. Moving Average  There are 2 parameters for the settings Ma Period = 5 period Moving Average  Channel 1.0 distance of channel lines from the chart Price Signal Filter - calculation of signal opening and filter There is a complete set of Alert There is a multi-timefram
Le presentamos el indicador "Candle closing counter", que se convertirá en su asistente indispensable en el mundo del trading. Es por eso que saber cuándo se cerrará la vela puede ayudar: Si usted tiene gusto de negociar usando patrones de la vela, usted sabrá cuando la vela será cerrada. Este indicador le permitirá comprobar si se ha formado un patrón conocido y si hay una posibilidad de negociación. El indicador le ayudará a prepararse para la apertura del mercado y el cierre del mercado.
The CCI Divergence is a reasonably useful indicator in itself, but it is even more effective when used with divergence pattern trading. The CCI Divergence indicator signal is one of the most potent signals among the indicators that exist in the market. Here is new version for Divergence Indicator using CCI method, with more improvements. Divergences indicate a potential investment point because the directional moment does not confirm the price. A bullish divergence occurs when the underlying
Gartley Projection D
Oleksandr Medviediev
3.71 (7)
El indicador identifica los patrones armónicos (XABCD) según los desarrollos de H.M.Gartley ("Beneficios en el mercado de valores", 1935г). Proyecta el punto D como un punto en la proyección en perspectiva (especifique ProjectionD_Mode = true en la configuración). No vuelve a dibujar. Cuando se cierra una barra del período de trabajo, si el punto del patrón identificado no se ha movido durante las barras Patterns_Fractal_Bars, aparece una flecha en el gráfico (en la dirección del movimiento
Point61 Indicator
Evgeniy Machok
5 (1)
The Point61 indicator is the result of many years of monitoring of price behavior of currency pairs and metals. It is not a secret, that in times of uncertainty, traders are looking for possible levels of support and resistance - the point, where price should stop its movement. There are 2 possible scenarios at these points: 1. Reverse (correction) to the opposite direction; 2. Breakthrough to continue movement. Very often these points are used to set stop orders - TakeProfit or
VR Cub
Vladimir Pastushak
VR Cub es un indicador para obtener puntos de entrada de alta calidad. El indicador fue desarrollado para facilitar los cálculos matemáticos y simplificar la búsqueda de puntos de entrada a una posición. La estrategia comercial para la cual se diseñó el indicador ha demostrado su eficacia durante muchos años. La simplicidad de la estrategia comercial es su gran ventaja, que permite que incluso los operadores novatos negocien con éxito con ella. VR Cub calcula los puntos de apertura de posiciones
Price Breakout pattern Scanner is the automatic scanner for traders and investors. It can detect following patterns automatically from your chart. Head and Shoulder - Common tradable pattern. Reverse Head and Shoulder - This pattern is the reverse formation of the Head and Shoulder. Double Top - When the price hits resistance level twice and decline toward the support level, the trader can anticipate sudden bearish breakout through the support level. Double Bottom - The double bottom pattern is
Trend lines master
The Trading Team Ltd
5 (1)
Launch promotion For a limited time only:  30$ instead of 157$ Summary Create precise trend lines in a second Description This indicator will draw your trend lines automatically with great precision, saving you some precious time. It uses Bill Williams Fractals to identify the key points and draws both inner and outer trend lines. Features Automatically draws precise trend lines
Noize Absorption Index MT4
Ekaterina Saltykova
5 (1)
Noize Absorption Index - is the manual trading system that measures the difference of pressure between bears forces and bulls forces. Green line - is a noize free index that showing curent situation. Zero value of index shows totally choppy/flat market.Values above zero level shows how powerfull bullish wave is and values below zero measures bearish forces.Up arrow appears on bearish market when it's ready to reverse, dn arrow appears on weak bullish market, as a result of reverse expectation. S
The main idea of this indicator is rates analysis and prediction by Fourier transform. Indicator decomposes exchange rates into main harmonics and calculates their product in future. You may use the indicator as a standalone product, but for better prediction accuracy there is another related indicator - FreqoMaster - which uses FreqoMeterForecast as a backend engine and combines several instances of FreqoMeterForecast for different frequency bands. Parameters: iPeriod - number of bars in the ma
This is an arrow indicator without a future function,developed based on the most advanced profit trading algorithms.It has the most innovative and advanced dual trend analysis module, as well as the latest and highly effective market trend prediction algorithm.Trends are your friends, and following larger trends can earn the maximum profit in foreign exchange. This indicator helps traders identify current trends and track them. Someone once made a profit of 10 times in a week by relying on it.No
Elliott Wave Trend was designed for the scientific wave counting. This tool focuses to get rid of the vagueness of the classic Elliott Wave Counting using the guideline from the template and pattern approach. In doing so, firstly Elliott Wave Trend offers the template for your wave counting. Secondly, it offers Wave Structural Score to assist to identify accurate wave formation. It offers both impulse wave Structural Score and corrective wave Structure Score. Structural Score is the rating to sh
Owl smart levels
Sergey Ermolov
4.34 (35)
Versión MT5  |   FAQ El   Indicador Owl Smart Levels   es un sistema comercial completo dentro de un indicador que incluye herramientas de análisis de mercado tan populares como   los fractales avanzados de Bill Williams , Valable ZigZag que construye   la estructura de onda correcta   del mercado y   los niveles de Fibonacci   que marcan los niveles exactos de entrada. en el mercado y lugares para tomar ganancias. Descripción detallada de la estrategia Instrucciones para trabajar con el indi
Forex Gump
Andrey Kozak
2.4 (5)
Forex Gump is a fully finished semi-automatic trading system. In the form of arrows, signals are displayed on the screen for opening and closing deals. All you need is to follow the instructions of the indicator. When the indicator shows a blue arrow, you need to open a buy order. When the indicator shows a red arrow, you need to open a sell order. Close orders when the indicator draws a yellow cross. In order to get the most effective result, we recommend using the timeframes H1, H4, D1. There
Infinity Trend Pro
Yaroslav Varankin
1 (1)
This is a trend indicator without redrawing Developed instead of the binary options strategy (by the color of the Martingale candlestick) Also works well in forex trading When to open trades (binary options) A signal will appear in the place with a candle signaling the current candle It is recommended to open a deal for one candle of the current timeframe M1 and M5 When a blue dot appears, open a deal up When a red dot appears, open a trade down. How to open trades on Forex. When a signal is rec
Chart Patterns Detect 15 patterns (Ascending Triangle, Descending Triangle, Rising Wedge, Falling Wedge, Bullish Flag, Bearish Flag, Bullish Rectangle, Bearish Rectangle Symmetrical triangle, Head and Shoulders, Inverted Head and Shoulders, Triple top, Triple Bottom, Double Top, Double Bottom) Use historical data to calculate the probability of each pattern to succeed (possibility to filter notification according to the chance of success) gives graphic indication about the invalidation level and
Los compradores de este producto también adquieren
Gann Made Easy
Oleg Rodin
4.85 (82)
Gann Made Easy es un sistema de comercio de Forex profesional y fácil de usar que se basa en los mejores principios de comercio utilizando la teoría del Sr. W. D. Gann. El indicador proporciona señales precisas de COMPRA y VENTA, incluidos los niveles de Stop Loss y Take Profit. Puede comerciar incluso sobre la marcha utilizando notificaciones PUSH. ¡Por favor, póngase en contacto conmigo después de la compra! ¡Compartiré mis consejos comerciales con usted y excelentes indicadores de bonificació
Atomic Analyst
Issam Kassas
5 (2)
En primer lugar, vale la pena enfatizar que este Indicador de Trading no repinta, no redibuja y no se retrasa, lo que lo hace ideal tanto para el trading manual como para el automatizado. Manual del usuario: configuraciones, entradas y estrategia. El Analista Atómico es un Indicador de Acción del Precio PA que utiliza la fuerza y el impulso del precio para encontrar una mejor ventaja en el mercado. Equipado con filtros avanzados que ayudan a eliminar ruidos y señales falsas, y aumentan el poten
Scalper Inside PRO
Alexey Minkov
4.73 (56)
An exclusive indicator that utilizes an innovative algorithm to swiftly and accurately determine the market trend. The indicator automatically calculates opening, closing, and profit levels, providing detailed trading statistics. With these features, you can choose the most appropriate trading instrument for the current market conditions. Additionally, you can easily integrate your own arrow indicators into Scalper Inside Pro to quickly evaluate their statistics and profitability. Scalper Inside
¡Actualmente 20% OFF ! ¡La mejor solución para cualquier novato o trader experto! Este software funciona con 28 pares de divisas. Se basa en 2 de nuestros principales indicadores (Advanced Currency Strength 28 y Advanced Currency Impulse). Proporciona una gran visión general de todo el mercado de divisas. Muestra los valores de Advanced Currency Strength, la velocidad de movimiento de las divisas y las señales para 28 pares de divisas en todos los (9) marcos temporales. Imagine cómo mejorar
Enigmera
Ivan Stefanov
5 (3)
ENIGMERA: El núcleo del mercado https://www.enigmera.com Introducción Este indicador y sistema de negociación es un enfoque extraordinario de los mercados financieros. ENIGMERA utiliza los ciclos fractales para calcular con precisión los niveles de soporte y resistencia. Muestra la auténtica fase de acumulación y proporciona dirección y objetivos.  Un sistema que funciona tanto si estamos en una tendencia como en una corrección.  ¿Cómo funciona? ENIGMERA consta de tres líneas: la línea de s
TPSproTREND PrO
Roman Podpora
4.79 (19)
TPSpro TREND PRO   es un indicador de tendencia que analiza automáticamente el mercado y proporciona información sobre la tendencia y cada uno de sus cambios, además de dar señales para ingresar operaciones sin volver a dibujar. El indicador utiliza cada vela, analizándolas por separado. refiriéndose a diferentes impulsos: impulso hacia arriba o hacia abajo. ¡Puntos de entrada exactos a transacciones de divisas, criptomonedas, metales, acciones e índices! Versión MT5                   DESCRIPCI
Dynamic Forex28 Navigator: la herramienta de trading de Forex de última generación. ACTUALMENTE CON UN 49 % DE DESCUENTO. Dynamic Forex28 Navigator es la evolución de nuestros indicadores populares de larga data, que combina el poder de tres en uno: Indicador avanzado Currency Strength28 (695 reseñas) + Indicador avanzado Currency IMPULSE con ALERT (520 reseñas) + Señales combinadas CS28 (bonificación). Detalles sobre el indicador https://www.mql5.com/en/blogs/post/758844 ¿Qué ofrece el i
Trend Punch
Mohamed Hassan
4.95 (19)
This indicator is unstoppable when combined with our other indicator called  Support & Resistance . After purchase, send us a message and you will get it   for  FREE as a BONUS! Introducing Trend Punch , the revolutionary forex trend indicator that will transform the way you trade! Trend Punch is uniquely designed to provide precise buy and sell arrows during strong market trends, making your trading decisions clearer and more confident. Whether you're trading major currency pairs or exotic sym
FX Volume
Daniel Stein
4.58 (33)
Obtenga su actualización diaria del mercado con detalles y capturas de pantalla a través de nuestro Morning Briefing aquí en mql5 y en Telegram ! FX Volume es el PRIMER y ÚNICO indicador de volumen que proporciona una visión REAL del sentimiento del mercado desde el punto de vista de un bróker. Proporciona una visión impresionante de cómo los participantes institucionales del mercado, como los brokers, están posicionados en el mercado Forex, mucho más rápido que los informes COT. Ver esta info
TPSpro RFI Levels
Roman Podpora
4.82 (22)
INSTRUCCIONES      RUSO  -  ING     Se recomienda utilizar con un indicador.   -    TPSpro   TENDENCIA PRO -   Versión MT5 Un elemento clave en el trading son las zonas o niveles desde los que se toman las decisiones de compra o venta de un instrumento de trading. A pesar de los intentos de los principales actores de ocultar su presencia en el mercado, inevitablemente dejan rastros. Nuestra tarea era aprender a identificar estos rastros e interpretarlos correctamente. Funciones principales: ¡Mo
FX Power MT4 NG
Daniel Stein
5 (13)
Obtenga su actualización diaria del mercado con detalles y capturas de pantalla a través de nuestro Morning Briefing aquí en mql5 y en Telegram ! FX Power MT4 NG es la nueva generación de nuestro popular medidor de fuerza de divisas, FX Power. ¿Y qué ofrece este medidor de fuerza de nueva generación? Todo lo que le encantaba del FX Power original PLUS Análisis de fuerza de ORO/XAU Resultados de cálculo aún más precisos Períodos de análisis configurables individualmente Límite de cálculo persona
Ante todo, vale la pena enfatizar que esta Herramienta de Trading es un Indicador No Repintado, No Redibujado y No Retrasado, lo que la hace ideal para el trading profesional. Curso en línea, manual del usuario y demostración. El Indicador de Conceptos de Acción del Precio Inteligente es una herramienta muy potente tanto para traders nuevos como experimentados. Combina más de 20 indicadores útiles en uno solo, combinando ideas avanzadas de trading como el Análisis del Trader del Círculo Interio
Ultimate Gold Advisor para MetaTrader 4 El Ultimate Gold Advisor es una herramienta tecnológica avanzada diseñada para optimizar la experiencia de trading en MetaTrader 4. Creada para satisfacer las necesidades de los traders más experimentados, este indicador combina precisión, análisis sofisticado y funcionalidad versátil, ofreciendo soporte para tomar decisiones de trading informadas. Ideal para el trading de oro, pero también aplicable a una amplia gama de activos, el Ultimate Gold Advisor p
Legacy of Gann
Pavel Zamoshnikov
4.83 (12)
The indicator very accurately determines the levels of the possible end of the trend and profit fixing. The method of determining levels is based on the ideas of W.D.Gann, using an algorithm developed by his follower Kirill Borovsky. Extremely high reliability of reaching levels (according to K. Borovsky  - 80-90%) Indispensable for any trading strategy – every trader needs to determine the exit point from the market! Precisely determines targets on any timeframes and any instruments (forex, met
Gold Channel is a volatility-based indicator, developed with a specific timing algorithm for the XAUUSD pair, which consists of finding possible corrections in the market. This indicator shows two outer lines, an inner line (retracement line) and an arrow sign, where the theory of the channel is to help identify overbought and oversold conditions in the market. The market price will generally fall between the boundaries of the channel. If prices touch or move outside the channel it is a tra
Currency Strength Wizard es un indicador muy poderoso que le proporciona una solución todo en uno para operar con éxito. El indicador calcula el poder de este o aquel par de divisas utilizando los datos de todas las monedas en múltiples marcos de tiempo. Estos datos se representan en forma de índice de moneda fácil de usar y líneas eléctricas de moneda que puede usar para ver el poder de esta o aquella moneda. Todo lo que necesita es adjuntar el indicador al gráfico que desea operar y el indicad
GOLD Impulse with Alert
Bernhard Schweigert
4.56 (9)
Este indicador es una super combinación de nuestros 2 productos Advanced Currency IMPULSE with ALERT  +   Currency Strength Exotics . ¡Funciona para todos los marcos de tiempo y muestra gráficamente el impulso de fuerza o debilidad para las 8 divisas principales más un Símbolo! Este Indicador está especializado en mostrar la aceleración de la fuerza de la divisa para cualquier símbolo como Oro, Pares Exóticos, Materias Primas, Índices o Futuros. Es el primero de su clase, cualquier símbol
Scalper Vault
Oleg Rodin
5 (27)
Scalper Vault es un sistema profesional de reventa que le brinda todo lo que necesita para una reventa exitosa. Este indicador es un sistema comercial completo que puede ser utilizado por operadores de divisas y opciones binarias. El marco de tiempo recomendado es M5. El sistema le proporciona señales de flecha precisas en la dirección de la tendencia. También le proporciona señales superiores e inferiores y niveles de mercado de Gann. Los indicadores proporcionan todo tipo de alertas, incluidas
Matrix Arrow Indicator MT4
Juvenille Emperor Limited
5 (3)
Matrix Arrow Indicator MT4 es una tendencia única 10 en 1 que sigue un indicador 100% sin repintado de marcos temporales múltiples que se puede usar en todos los símbolos/instrumentos: divisas, materias primas, criptomonedas, índices, acciones.  Matrix Arrow Indicator MT4 determinará la tendencia actual en sus primeras etapas, recopilando información y datos de hasta 10 indicadores estándar, que son: Índice de movimiento direccional promedio (ADX) Índice de canales de productos básicos (CCI) Ve
ACTUALMENTE 31% DE DESCUENTO Este indicador es una herramienta de transacción única, de alta calidad y asequible porque hemos incorporado una serie de características propias y una fórmula secreta. Con solo un gráfico, da Alertas para los 28 pares de divisas. ¡Imagina cómo mejorarás porque puedes identificar el punto de activación exacto de una nueva tendencia u oportunidad de crecimiento! Basado en nuevos algoritmos subyacentes , hace que sea aún más fácil identificar y confirmar operaciones po
Blahtech Supply Demand
Blahtech Limited
4.61 (33)
Was: $299  Now: $99   Supply Demand uses previous price action to identify potential imbalances between buyers and sellers. The key is to identify the better odds zones, not just the untouched ones. Blahtech Supply Demand indicator delivers functionality previously unavailable on any trading platform. This 4-in-1 indicator not only highlights the higher probability zones using a multi-criteria strength engine, but also combines it with multi-timeframe trend analysis, previously confirmed swings
AW Prime Oscillator
AW Trading Software Limited
5 (1)
Una combinación de dos osciladores. El primero muestra los puntos de entrada, el segundo muestra la tendencia actual. El indicador puede mostrar señales de oscilador mediante flechas en dos modos, todas señales de oscilador rápido o señales solo en la dirección de la tendencia actual. Tiene un panel de múltiples períodos de tiempo y tres tipos de notificaciones de señales. Beneficios: Adecuado para operaciones intradía y especulación. Filtrado de tendencias Configuración sencilla y sensible Pan
¡Descubra el secreto para el comercio de Forex exitoso con nuestro indicador MT4 personalizado! ¿Alguna vez se ha preguntado cómo lograr el éxito en el mercado de Forex, obteniendo ganancias constantemente al tiempo que minimiza el riesgo? ¡Aquí está la respuesta que ha estado buscando! Permítanos presentar nuestro indicador MT4 patentado que revolucionará su enfoque para el comercio. Versatilidad única Nuestro indicador está especialmente diseñado para usuarios que prefieren las formacio
ACTUALMENTE 26% DE DESCUENTO ¡La mejor solución para cualquier operador novato o experto! Este indicador es una herramienta única, de alta calidad y asequible porque hemos incorporado una serie de características propias y una nueva fórmula. ¡Con sólo UN gráfico puede leer la Fuerza de la Divisa para 28 pares de Divisas! Imagínese cómo mejorará su operativa porque podrá señalar el punto exacto de activación de una nueva tendencia o de una oportunidad de scalping. Manual del usuario: haga
Black dragon indicator
Ramil Minniakhmetov
4.85 (110)
El indicador de detección de tendencias complementará cualquier estrategia y también se puede utilizar como una herramienta independiente. Recomendaciones para trabajar con el indicador, las puedes descargar en el comentario #8 Ventajas Fácil de usar, no sobrecarga el gráfico con información innecesaria; Puede usarse como filtro para cualquier estrategia; Tiene niveles integrados de soporte y resistencia dinámicos, que se pueden usar tanto para obtener ganancias como para establecer límit
Automated Trendlines
Georgios Kalomoiropoulos
5 (16)
Las líneas de tendencia son la herramienta más esencial del análisis técnico en el comercio de divisas. Desafortunadamente, la mayoría de los comerciantes no los dibujan correctamente. El indicador de líneas de tendencia automatizadas es una herramienta profesional para comerciantes serios que lo ayuda a visualizar el movimiento de tendencia de los mercados. Hay dos tipos de Trendlines Bullish Trendlines y Bearish Trendlines. En la tendencia alcista, la línea de tendencia de Forex se dib
Best Currency Strength Indicator
Tumelo Patrick Rakotsoane
4.59 (46)
Advanced Currency Strength Indicator The Advanced Divergence Currency Strength Indicator. Not only it breaks down all 28 forex currency pairs and calculates the strength of individual currencies across all timeframes , but, You'll be analyzing the WHOLE forex market in 1 window (In just 1 minute) . This indicator is very powerful because it reveals the true movements of the market.  It is highly recommended to  analyze charts knowing the performance of individual currencies or the countries ec
Allows multiple indicators to be combined into a single indicator, both visually and in terms of an alert. Indicators can include standard indicators, e.g. RSI, CCI, etc., and also Custom Indicators, even those purchased through Market, or where just have the ex4 file. An early alert is provided, say when 4 out 5 indicators have lined up, and a confirmed alert when all are in agreement. A‌lso features a statistics panel reporting the success of the combined indicator by examining the current cha
TrendfollowerSR
Paul Reymkhe
4.88 (90)
Take Your Trading Experience To the Next Level ! and get the exclusive TFSR-Analyzer for free !    So you have all these outstanding features  on up to 20 symbols and all timeframes in a smart and clear Design. Correct identification of the trends  in stock investments are pivotal and TrendFollowerSR ensures this perspective while displaying the correct trend on multiply timeframes to help you go long way as much as possible. The latest technology of the Indicator enables to track whether if
Otros productos de este autor
Indicador de patrones de velas para MetaTrader 4 (MT4) Este indicador personalizable identifica patrones clave de velas alcistas y bajistas, ayudando a los traders en el análisis técnico y la toma de decisiones. Características principales: Detección de patrones : Alcistas : Martillo, Envuelven alcista, Estrella de la mañana, Tres soldados blancos, Harami alcista, Martillo invertido. Bajistas : Estrella fugaz, Envuelven bajista, Estrella de la tarde, Tres cuervos negros, Harami bajista, Hombre c
Fiter
Davit Beridze
5 (2)
Los compradores del indicador recibirán gratis un EA basado en el indicador Fiter como bono. (Mira el video para ver el EA en acción). Comenta para obtener el EA. Fiter es un indicador híbrido que combina una Media Móvil Exponencial (EMA) con una línea RSI modulada por ATR (amarilla), junto con una Media Móvil tradicional (roja). El cruce de estas dos líneas genera señales de trading significativamente más suaves y confiables en comparación con el enfoque clásico de usar dos medias móviles si
MFI Modern PRO
Davit Beridze
4.92 (36)
Def ault settings   are just for visu alis ation, it c an not be profit able with it.  Get a Free EA as a Bonus when you Purchase the Indicator! Plus, Receive 4 Interesting Additional Indicators. Recommended set files for backtesting the indicator on recommended pairs are available in the comments section (last page). Please note that this product is exclusively sold on the MQL5 market. Any other sources offering it are scams, and the author bears no responsibility. To receive the bonus gifts,
La versión demo no tiene utilidad. No entenderás nada viendo los números parpadear. Esto es un panel de control. Intenta comprender la idea, y yo te ayudaré con todo lo demás. Los símbolos deben estar separados por comas (,) y deben ingresarse en los parámetros exactamente como los muestra tu bróker, para asegurarte de que se reconozcan en el panel. Estos símbolos serán usados por el indicador para el análisis. Con un solo clic, puedes abrir cualquier par y cualquier marco de tiempo directa
El indicador "Candle Info" para MetaTrader 4 (MT4) ayuda a los traders a analizar y visualizar formaciones clave de velas directamente en el gráfico. Al detectar formaciones como Máximos más altos (HH), Mínimos más bajos (LL), Mínimos más altos (HL) y Máximos más bajos (LH), proporciona información sobre tendencias de mercado y posibles movimientos de precios. Funciones clave: Formaciones de velas: Identifica y etiqueta HH, LL, HL, LH, y combinaciones como HH & HL (tendencia alcista) y LL & LH (
MRA Index
Davit Beridze
5 (5)
You get Ea based on MRA Index for free as a Bonus in case of indicator purchase.  For sc alping I optimize sets on period of l ast 12 months  and use it next 1 month, this w ay it works very well ! Def ault settings   are just for vizu alis ation, it c an not be profit able with it, recommendations about Correct optimization process I sh are with buyers. The "MRA Index" forex indicator is a versatile tool that combines various technical elements to provide traders with valuable insights into pot
Period Cross RSI
Davit Beridze
5 (6)
Check my p a id tools they   work  perfect! "Period Cross RSI" Is a New indicator idea that shows crosses of two RSI lines with different periods which creates ascending and descending zones for confirmation of long and short trading. This indicator is brend new and will be upgraded further, for now I recommend to use it as a confirmation, filter indicator for determination of long/short trading zones, not as a signaler indicator for now. Further upgrades can make it as a signaler indicator as w
FREE
Check my p a id tools they   work  perfect please r ate Here is an Upgraded version with Bonus Ea in case of purchase it costs 30$ only and you get Ea as Bonus:  https://www.mql5.com/en/market/product/96835 This indicator is experimetal, it shows TMA channel arrows with Volatility filter built in to avoid lagging. Try to experiment with it, search for better conditions of use. It is possible to adjust different timeframes for TMA and for Volatility filter Same time on the current chart, so it ma
FREE
MA Speedometer
Davit Beridze
4.6 (10)
Dashboard for Ma Speedometer:  https://www.mql5.com/en/market/product/116784 Non standard attitude to the standard moving average indicator. The essence of the indicator is to determine the strength and speed of the price direction by determining the tilt angle of the moving average. A point is taken on the fifteenth MA candle and a point on the last closed MA candle, a straight line is drawn between them, it is movable and on a hemisphere shows an angle of inclination from 90 degrees to -90.
Adjustable Pin Bar
Davit Beridze
5 (2)
Check my p a id tools they   work  perfect please r ate Adjustable PIN BAR indicator is usefull tool alowing to search for pin bars you wish to find on the price chart, it has 2 parameters to filter out what type of pin bars you wish to search for: 1) MinTailProc 75% (default) which means to show pin bars that has minimum size of the Nose (Tail) as 75% of full candle size. If Upper Nose (Tail) size of the candle is minimum 75% of the candle size fully than candle is painted in RED. If Lower Nose
FREE
Laguerre Scrat
Davit Beridze
5 (1)
In case you get Laguerre S crat indicator, you will get Laguerre Scrat Ea as a Gift. To get Ea  and det a iled m anu al PDF contact me PM. Default settings are for usd/cad H4 For St able Long term Profits Laguerre Scrat is a trading system based on 4 indicator combinations in the shape of one indicator. Laguerre indicator (upgraded), CCI, Bollinger bands and market volatility factor. It generates arrows in the indicator window and nuts on the price chart, doubling arrows for a better view where
after getting indic ator cont act me for Bonus E a. Non Repaint TMA channel with special conditioned arrows on price cross of channel lines plus market Volatility factor, which makes product much more accurate than any usual tma channel indicators.  It is proven to be profitable with Ea built based on it which you will get as a BONUS in case of indicator purchase. Good luck.
Check my paid tools they work great and I share Ea's based on them for free please r ate The Dual Timeframe RSI (Relative Strength Index) indicator is a novel trading tool that allows traders to monitor RSI readings from two different timeframes on a single chart. This dual perspective enables traders to identify potential trend confirmations and divergences more effectively. For instance, a trader might use a 1-hour RSI alongside a daily RSI to ensure that short-term trades align with the bro
FREE
Indicator shows buy/sell arrows depending on volatility factor. Indicator does not repaint! It works on any pair and any timeframe. It is well tested through strategy builders and shows quite interesting results as a good filter indicator and as independent signaler as well (check the screenshots). It is possible to search for a lot of interesting parameters for profitable trading, some of which are shown on the screenshots. There are next inputs in indicator settings: N-volatility period; Level
B acktest with set files from comments section (L a st comment) with method open price only. Watch video and Turn ON Subtitles when watching! This EA contains Few stop out levels built in what makes it much safer than any other method! Never pay attention to the Stereotips. Any method can be risky if you use them without a Sense. Steady Ranger EA is an advanced automated channel trading system with potential to find out hundreds of profitable set files according to the back tests. This EA is n
RSI Entry Points
Davit Beridze
5 (5)
RSI Entry Points is the upgrade of the standard RSI indicator to avoid lagging. Indicator draws the clouds and the arrows to have clear picture where price is and what to wait for. Why standard RSI is lagging? because mostly we do not use it correctly and it is with very weak visual flexibility, less informative. With my current upgrade I tried to Fix both problems same time and I got much better results and more exact entries than standard RSI has. I Made RSI line Dynamic, it gets more flexible
This EA is Created just for RSI Entry points Indicator ( https://www.mql5.com/en/market/product/67581 Test, to show indicators profitable parameters and to give potential buyers possibility to backtest indicator Entries. EA opens Buy orders on Buy Arrows and Sell orders on Sell Arrows of the indicator, orders are closed on opposite signals. EA is not created for Live automated trading, thats not the goal to sell EA, but any ways if you like it and need it, you can rent. Default settings are f
Re ad First Before Testing. This Ea goes as a Bonus to  MFI Modern PRO indicator users only. Set files generated  after upgrade you can check in comments section. This Expert advisor is based on MFI Modern PRO indicator   https://www.mql5.com/en/market/product/80765 just to  give possibility to indicator users for fastly test the indicator Before buying. In comments section recommended set files are uploaded by which you can prove yourself that backtest data from indicator overview are real. Thi
MA Revolution
Davit Beridze
5 (1)
MA Revolution is upgraded version of standard Moving   A verage. With the current upgrade moving average line got more sensitive with different market conditions. It gets more flexible by decreasing default period step by step while market is sharp and incrasing period back to default period step by step while market is normal again. testing of the ide a shows th at this upgr aded version gives much more acur acy for detecting m arket direction, ch anges in direction are shown much e arly th an
MA Speedometer MT5
Davit Beridze
5 (3)
Non standard attitude to the standard moving average indicator. The essence of the indicator is to determine the strength and speed of the price direction by determining the tilt angle of the moving average. A point is taken on the fifteenth MA candle and a point on the last closed MA candle, a straight line is drawn between them, it is movable and on a hemisphere shows an angle of inclination from 90 degrees to -90. above 30 degrees is the buying area, below -30 degrees is the selling area. abo
Indicator shows buy/sell arrows depending on volatility factor. Indicator does not repaint! It works on any pair and any timeframe. It is well tested through strategy builders and shows quite interesting results as a good filter indicator and as independent signaler as well (check the screenshots). It is possible to search for a lot of interesting parameters for profitable trading, some of which are shown on the screenshots. There are next inputs in indicator settings: N-volatility period; Level
RSI Entry Points is the upgrade of the standard RSI indicator to avoid lagging. Indicator draws the clouds and the arrows to have clear picture where price is and what to wait for. Why standard RSI is lagging? because mostly we do not use it correctly and it is with very weak visual flexibility, less informativity. With my current upgrade I tried to Fix both problems same time and I got much better results and more exact entries than standard RSI has. To make yourself sure check out the screens
Filtro:
leo-leo13
19
leo-leo13 2024.09.20 08:45 
 

El usuario no ha dejado ningún comentario para su valoración

babaxa
19
babaxa 2024.09.20 08:02 
 

El usuario no ha dejado ningún comentario para su valoración

JoaoSilva7
19
JoaoSilva7 2024.09.19 12:44 
 

Mostly i liked the triangles and pennant patterns, i have enabled them into my charts and they are a good tool for market analysis.

Mikeladze Roland
21
Mikeladze Roland 2024.09.17 10:55 
 

I’ve been testing before purchase and using the Chart Patterns All in One indicator for a while now, and I have to say it’s an excellent tool—especially if you understand how to properly use all the features it offers. One thing to be aware of: the triangles are based on the ZigZag indicator, which means they can sometimes disappear or appear later as the price action evolves. This is a natural behavior of any ZigZag-based tool, and it’s clearly mentioned in the product description. However, there’s a smart way to make the most of these triangles: by using a confirmation timeframe. This means before you take a trade based on a triangle signal, you first confirm it on a higher timeframe. By doing this, you can significantly improve the reliability of the signals, even when dealing with patterns that may repaint. That said, it’s important to note that the ZigZag-based triangles are just one of the many patterns available in this indicator. The other patterns—such as the 1-2-3, Double Top/Bottom, and others—do not repaint and work flawlessly. To sum it up, this is a great indicator from Mr. Beridze for those who know how to appreciate good, professional, and effective work. It’s an essential tool to understand what’s happening on your chart and the direction of price. 5 stars for this!

NN
776
NN 2024.09.16 00:46 
 

The 'Chart Patterns All in One' indicator repaints! SCAM!!!!! In the comments section, I can prove to you that it repaints by comparing screenshots of the same chart. When I added the indicator on a different day, it repainted. It even went back in time (from 23:40 back to 22:55). First, there was the BLUE triangle for BUY, and then the PINK triangle for SELL. Maybe $50 isn't much to you, but for some people living in less developed countries, it’s tough to lose such an amount on a product that doesn't work. What he is doing isn't right. I even tried contacting him, but instead some other person contacted me telling me that the Developer cannot communicate on MQL, and I need to contact him in Telegram. Ever heard such nonsense? If you study the comments section of this indicator, you’ll notice that only the developer (Davit Beridze) uploaded posts and praised the performance of his own indicator. You won’t find a single user praising it. I really doubt this developer is honest or that his other products work well. So be aware!

George Heck
362
George Heck 2024.09.12 07:01 
 

Davit is a fantastic guy to talk with. We chatted for a few days about different strategies and indicators he would recommend. This indicator is quite confusing and rather hard to use. BE AWARE THIS INDICATOR WILL REPAINT. A signal may be there on the chart for a buy triangle one moment, but switch over to a sell triangle if the buy is broken. Not saying it's bad, just saying you should know of the repainting.

fangfang
51
fangfang 2024.09.07 19:21 
 

I personally think that triangles are very useful as a tool for determining direction. As long as you are not greedy, weekly profits are more lucrative than working. The author is very meticulous, and the user manual covers languages from various countries. The overall experience is great.

Davit Beridze
7805
Respuesta del desarrollador Davit Beridze 2024.09.08 10:17
Thanks
Junichi Isono
753
Junichi Isono 2024.08.27 01:40 
 

It is a very accurate indicator. I'm waiting for a sign on the 4-hour timeframe and looking for an entry point on the 15-minute timeframe, and both signs are valid.

Davit Beridze
7805
Respuesta del desarrollador Davit Beridze 2024.09.08 10:17
thanks
สุกิจฏิพันธ์
209
 

El usuario no ha dejado ningún comentario para su valoración

Davit Beridze
7805
Respuesta del desarrollador Davit Beridze 2024.07.27 14:40
welcome. thanks
danmar
1490
danmar 2024.07.25 15:06 
 

I ask before buying and for quite the first time i have a seller who is also a trader who share experience and that was nice and interesting. The tool is easy to use and accurate. if possible in an future update , if the size and the text of each of the 4 buttons could be in parameter it will be better to save space , but it is already well done. very Good tool and very simple to use with this kind of accuracy. well done.

Davit Beridze
7805
Respuesta del desarrollador Davit Beridze 2024.07.27 14:40
thank you very much
lauro1956
4857
lauro1956 2024.07.25 09:56 
 

Excellent indicator from Mr. Beridze An encyclopedia at your disposal

A great effort to make it available to us

5 stars

Davit Beridze
7805
Respuesta del desarrollador Davit Beridze 2024.07.27 14:39
thanks Lauro
Respuesta al comentario
Versión 2.2 2024.08.16
With this update when you chose some patterns to show from Panel, Changing Timeframes will not turn ON all patterns on panel, for example if you need to check triangles pattern only on different timeframes you will not need to turn OFF other patterns from panel every time you change timeframe. Chosen pattern will stay ON
Versión 2.1 2024.08.09
Double Top-Bottom and Triple Top-Bottom arrows fixed, it was showing arrows from current bar which is working process and appearing and disappearing on current bar is normal, but some traders understand that as "Repaint" which is not true. Now Arrow appears on closed bar so no working process show up any more.
Versión 1.20 2024.07.27
Now "Control Panel" is movable, you can drag it to any place you wish on the chart. Alerts are given now on closed bar, after signal is formed. not on current bar!
Versión 1.1 2024.07.24
Few bugs fixed and Added Max Bar option to make indicator appear that parts which possible to do that way. this way it gets softer, in case you wish to check more history back on chart just increase that number in options, default it is set to 1000.