• Genel bakış
  • İncelemeler (11)
  • Yorumlar (59)
  • Yenilikler

Chart Patterns All in One

4.25

Satın aldıktan sonra yorum bırakın, bonus olarak 4 yüksek kaliteli gösterge alın.

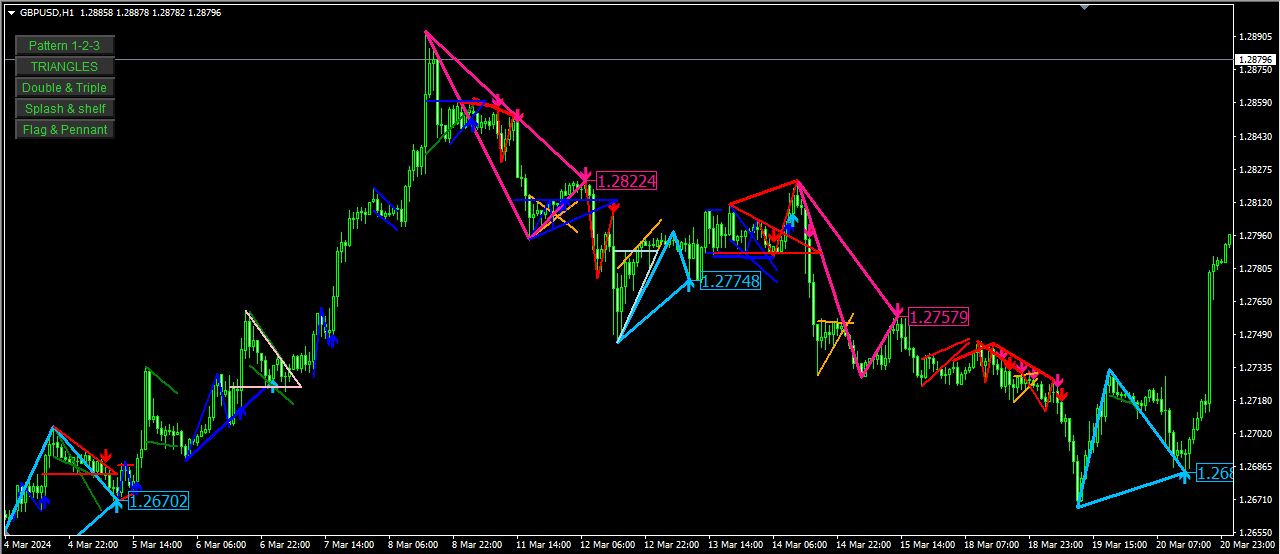
Chart Patterns All-in-One göstergesi, traderların teknik analizde yaygın olarak kullanılan çeşitli grafik desenlerini görselleştirmelerine yardımcı olur. Bu gösterge, potansiyel piyasa hareketlerini belirlemeye yardımcı olur ancak kârlılığı garanti etmez. Satın almadan önce göstergeyi demo modunda test etmeniz önerilir.

Mevcut Teklif: "Chart Patterns All in One" göstergesinde %50 indirim.

Dahil Edilen Desenler:

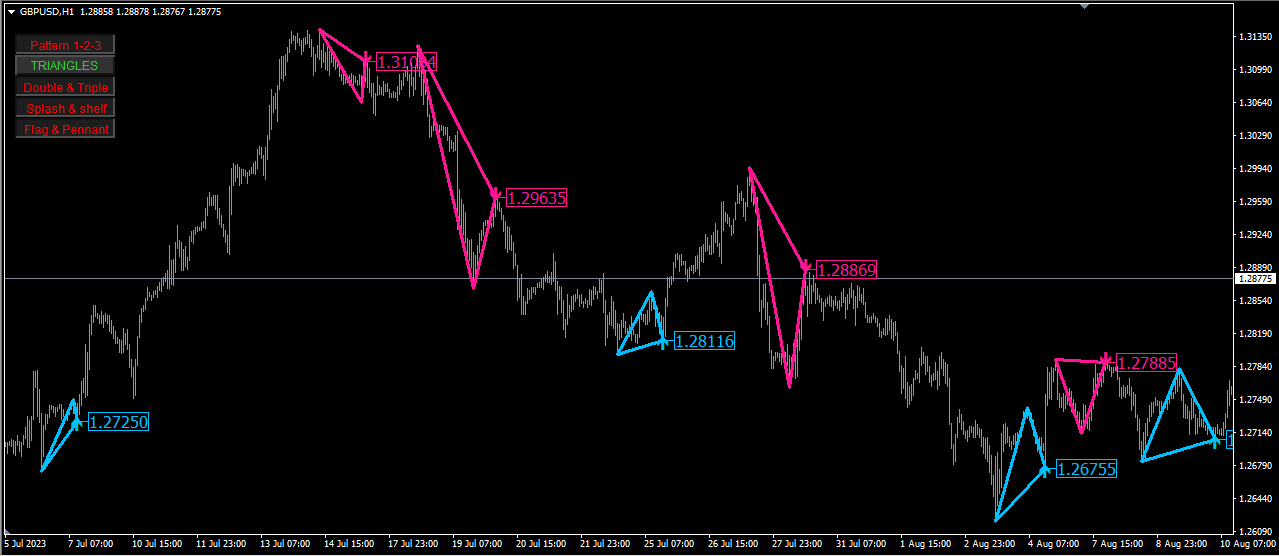
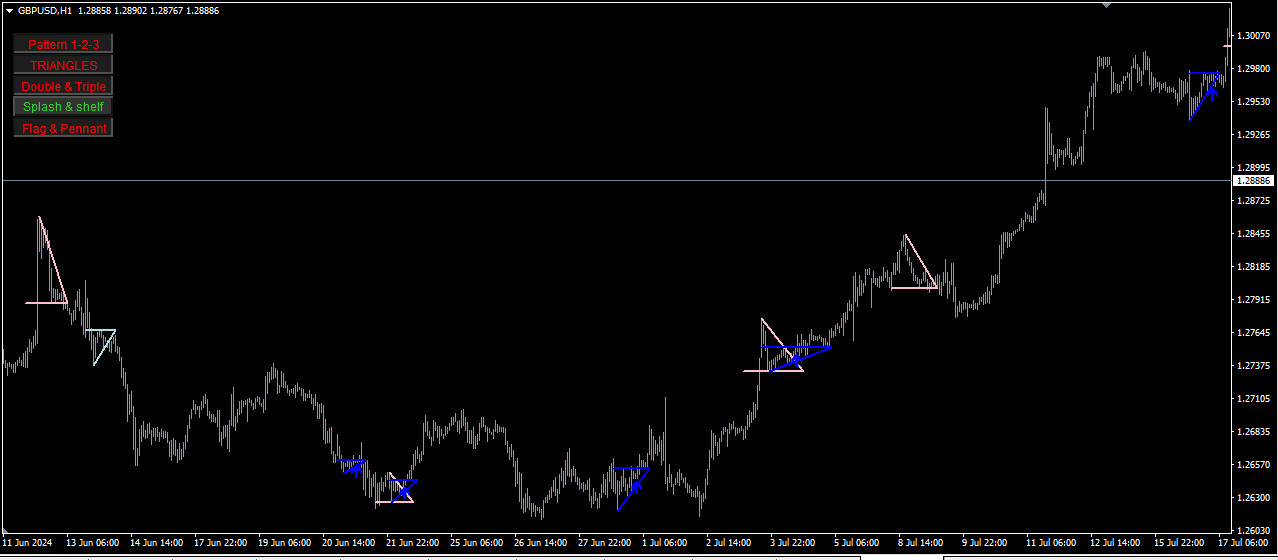
  • 1-2-3 Deseni: Üç önemli nokta (yüksekler veya düşükler) kullanarak piyasa tersine dönüşlerini algılar.

    • Alış: Ardışık iki düşükten sonra daha düşük bir yüksek ortaya çıkar.
    • Satış: Ardışık iki yükseğin ardından daha yüksek bir düşük gelir.
    • Görselleştirme: Belirlenen noktalar, çizgiler ve oklarla birleştirilir.
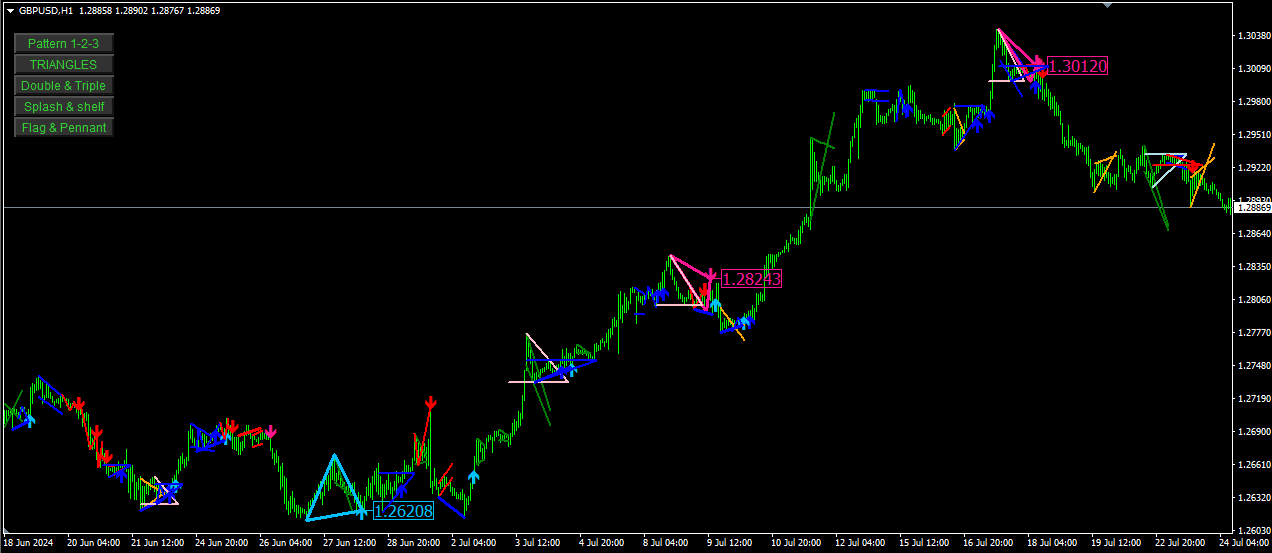
  • Çift Tepe ve Çift Dip: Fiyat, yaklaşık olarak eşit iki ardışık tepe (Çift Tepe) veya dip (Çift Dip) oluşturduğunda, olası tersine dönüşleri gösterir.

    • Çift Tepe: Ayı piyasası tersine dönüşü.
    • Çift Dip: Boğa piyasası tersine dönüşü.
    • Görselleştirme: Tepe veya dip noktalarını birleştiren çizgiler ve tersine dönüş noktalarını gösteren oklar.
  • Üçlü Tepe ve Üçlü Dip: Çift tepe/dip'e benzer, ancak üç ardışık tepe veya dip ile daha güçlü tersine dönüş sinyali verir.

    • Üçlü Tepe: Ayı piyasası tersine dönüşü.
    • Üçlü Dip: Boğa piyasası tersine dönüşü.
    • Görselleştirme: Deseni işaretleyen çizgiler ve oklar.
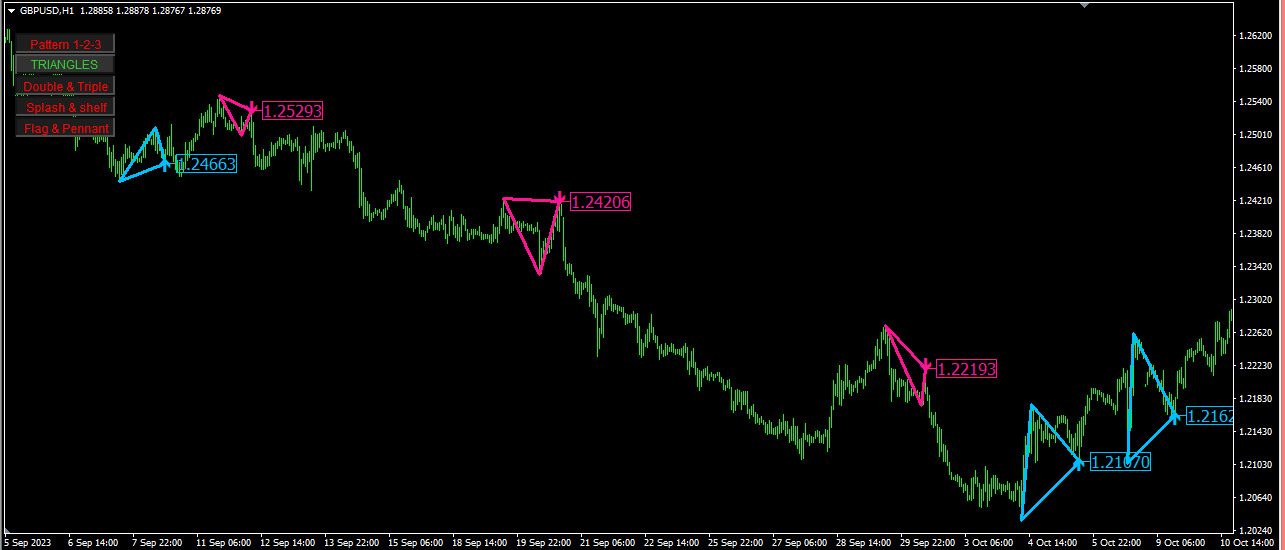
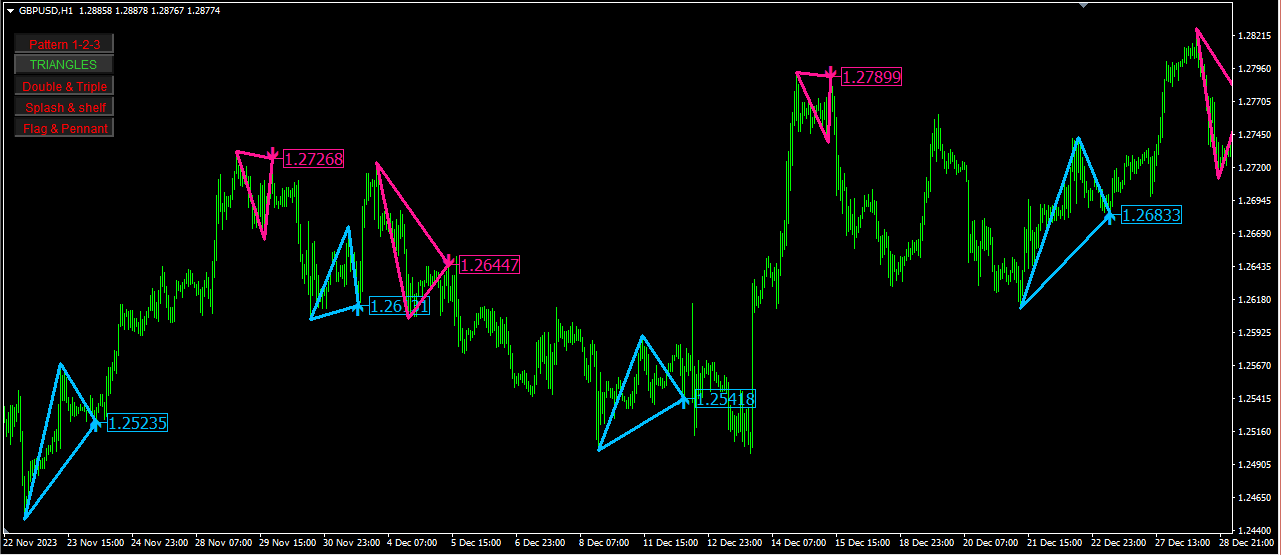
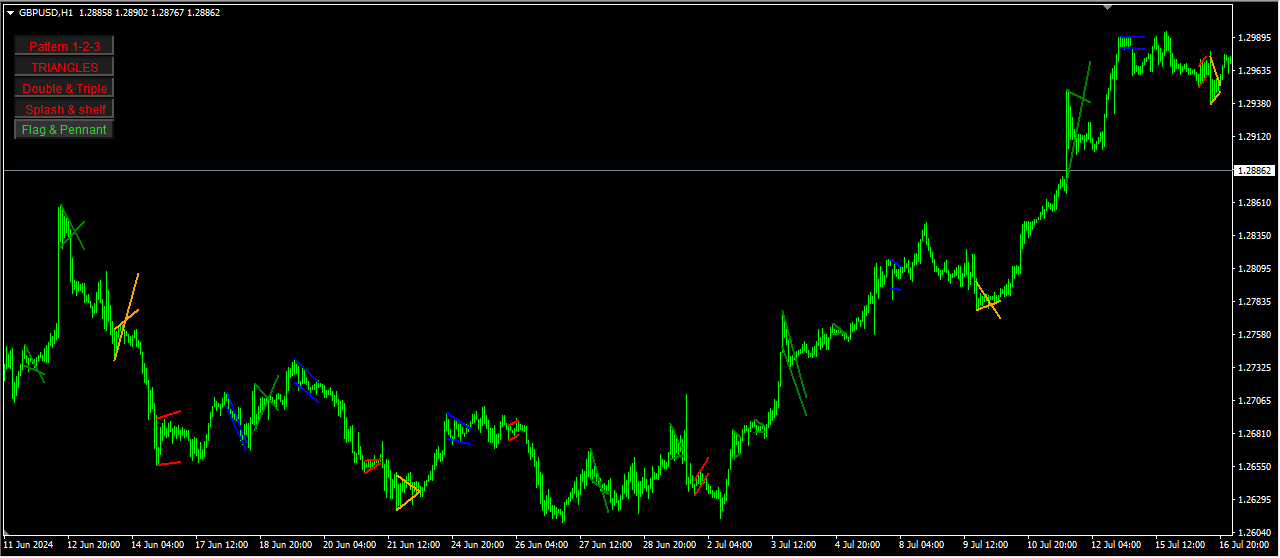
  • Üçgenler: Bir trendin devamından önce konsolidasyon dönemlerini belirler (Zig-Zag tabanlıdır, bazen geç görünebilir veya kaybolabilir).

    • Yükselen Üçgen: Boğa piyasası devamı.
    • Alçalan Üçgen: Ayı piyasası devamı.
    • Görselleştirme: Grafik üzerinde üçgenler çizilir ve çıkış noktalarını belirleyen oklarla işaretlenir.
    • Zig-Zag nedeniyle olası gecikmelere veya kaybolmalara rağmen bu desen etkili olmaya devam eder. Daha fazla bilgi için videoyu izleyin.
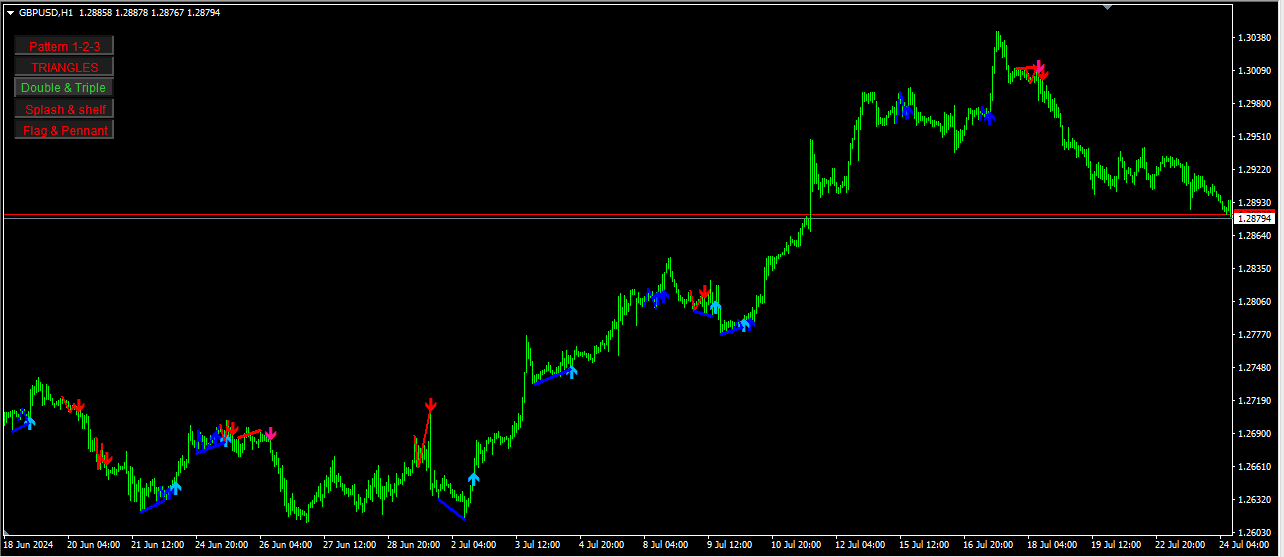
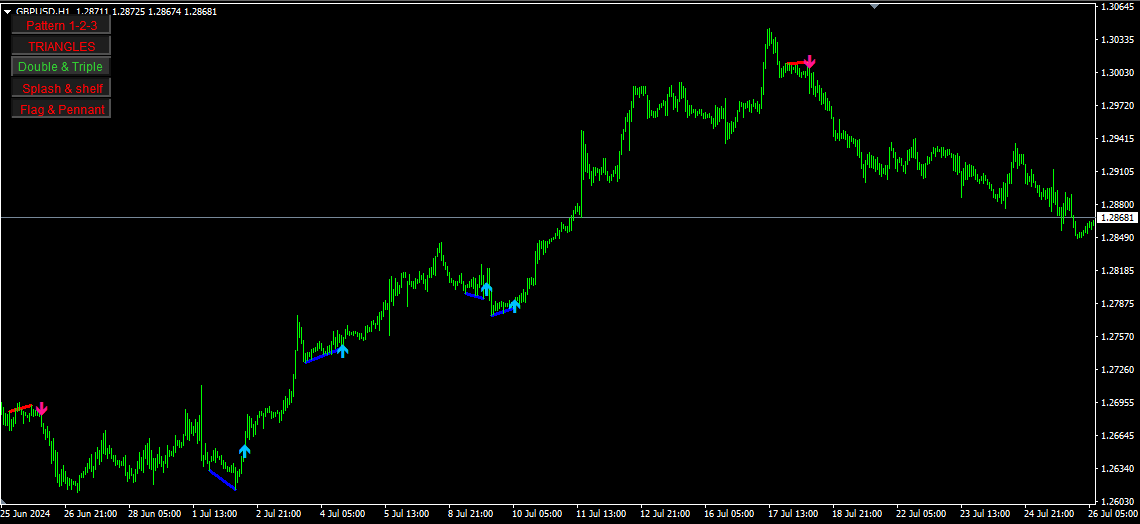
  • Splash ve Shelf: Keskin fiyat hareketlerini (Splash) takip eden konsolidasyon aşamalarını (Shelf) belirler, bu da potansiyel çıkışları gösterir.

    • Splash: Keskin hareket.
    • Shelf: Splash sonrası konsolidasyon.
    • Görselleştirme: Splash ve Shelf desenleri için trend çizgileri.
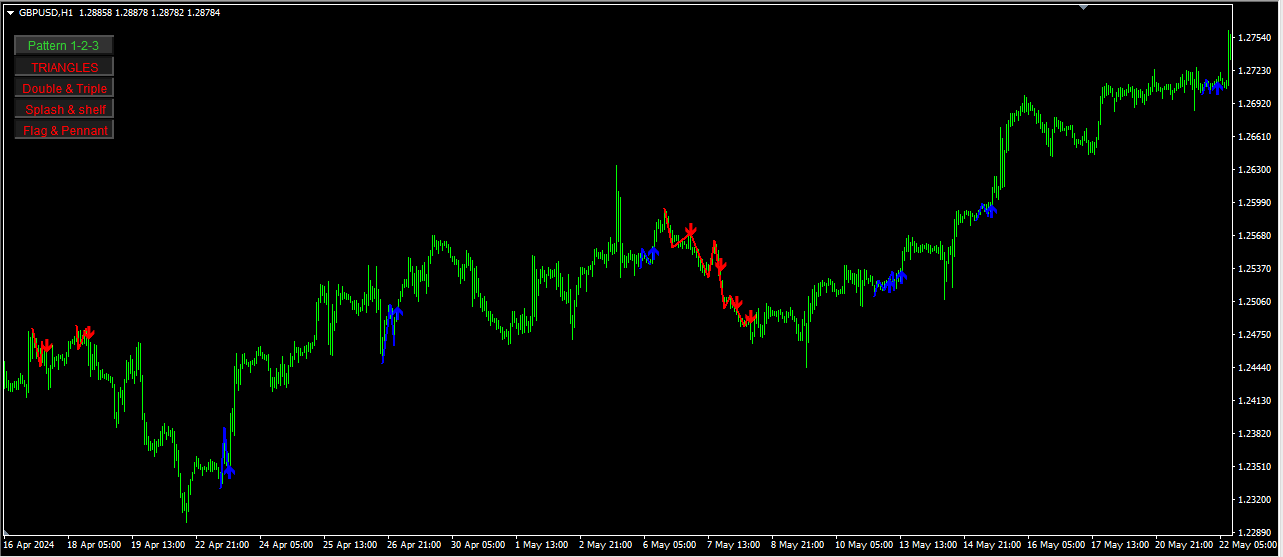
  • Bayrak ve Flama: Kısa vadeli devam desenleri, trendin devam etmeden önce kısa bir duraklama yaşandığını gösterir.

    • Boğa Bayrağı: Yükseliş trendinin devamı.
    • Ayı Bayrağı: Düşüş trendinin devamı.
    • Flama: Küçük bir simetrik üçgen oluşturan devam deseni.
    • Görselleştirme: Deseni ve çıkış noktalarını gösteren şekiller ve oklar.

Özellikler:

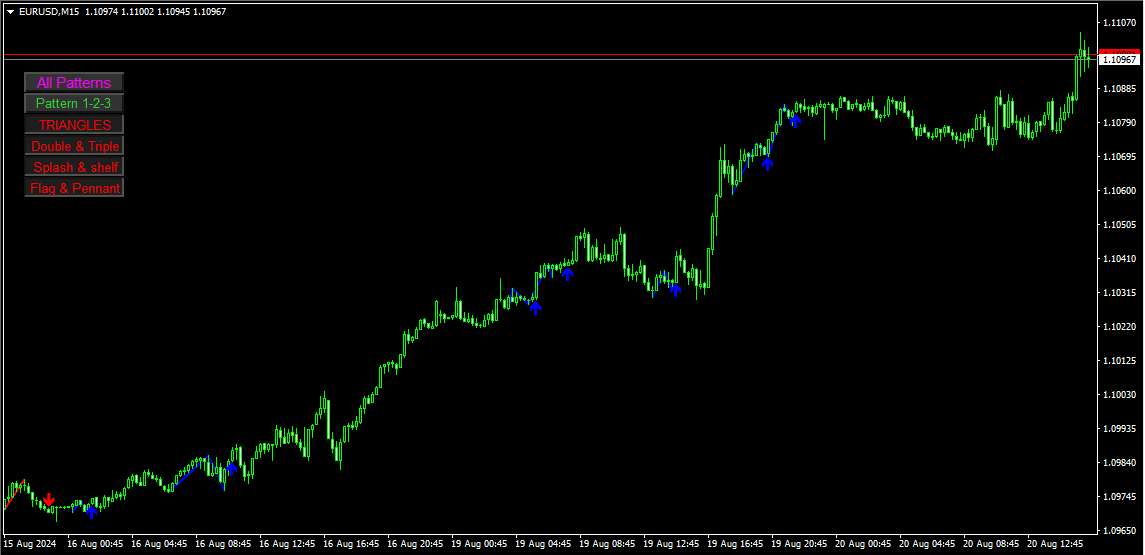
  • Desenleri Aç/Kapat: Grafik üzerindeki düğmelerle belirli desenleri kolayca etkinleştirin veya devre dışı bırakın.
  • Özelleştirilebilir Ayarlar: Renkleri, çizgi kalınlıklarını ve desenlere özgü ayarları değiştirin.
  • Uyarılar ve Bildirimler: Desenler tespit edildiğinde uyarılar ayarlayın.

Görselleştirme:

  • Çizgiler ve Oklar: Desenlerin net görsel gösterimi.
  • Etkileşimli Düğmeler: Desenlerin görünürlüğünü doğrudan grafik üzerinden değiştirin.

Bu hepsi bir arada gösterge, birden fazla grafik deseninin analizini basitleştirir ve MT4 kullanıcıları için esnek ve özelleştirilebilir bir araç sunar.


İncelemeler 11
Mikeladze Roland
21
Mikeladze Roland 2024.09.17 10:55 
 

I’ve been testing before purchase and using the Chart Patterns All in One indicator for a while now, and I have to say it’s an excellent tool—especially if you understand how to properly use all the features it offers. One thing to be aware of: the triangles are based on the ZigZag indicator, which means they can sometimes disappear or appear later as the price action evolves. This is a natural behavior of any ZigZag-based tool, and it’s clearly mentioned in the product description. However, there’s a smart way to make the most of these triangles: by using a confirmation timeframe. This means before you take a trade based on a triangle signal, you first confirm it on a higher timeframe. By doing this, you can significantly improve the reliability of the signals, even when dealing with patterns that may repaint. That said, it’s important to note that the ZigZag-based triangles are just one of the many patterns available in this indicator. The other patterns—such as the 1-2-3, Double Top/Bottom, and others—do not repaint and work flawlessly. To sum it up, this is a great indicator from Mr. Beridze for those who know how to appreciate good, professional, and effective work. It’s an essential tool to understand what’s happening on your chart and the direction of price. 5 stars for this!

fangfang
51
fangfang 2024.09.07 19:21 
 

I personally think that triangles are very useful as a tool for determining direction. As long as you are not greedy, weekly profits are more lucrative than working. The author is very meticulous, and the user manual covers languages from various countries. The overall experience is great.

Junichi Isono
753
Junichi Isono 2024.08.27 01:40 
 

It is a very accurate indicator. I'm waiting for a sign on the 4-hour timeframe and looking for an entry point on the 15-minute timeframe, and both signs are valid.

Önerilen ürünler
Reversal Pattern Pro
Boonyapagorn Rodvattanajinda
Reversal Patterns Pro Reversal Patterns Pro is a Price Action (PA) analytical tool that scans the reversal patterns.  - Finds and marks the most dependable Japanese candlestick patterns in real-time. - Supports all time frames (Best for Scalping) - Doesn't repaint making it an exceptional indicator for Expert Advisors. Input parameters : - Support & Resistance Mode ( true or false ) for enabling advanced filtering - Donchian Period - RSI Period - RSI Oversold Level - RSI Overbought Level - 
The Penta-O is a 6-point retracement harmonacci pattern which usually precedes big market movements. Penta-O patterns can expand and repaint quite a bit. To make things easier this indicator implements a twist: it waits for a donchian breakout in the right direction before signaling the trade. The end result is an otherwise repainting indicator with a very reliable trading signal. The donchian breakout period is entered as an input. [ Installation Guide | Update Guide | Troubleshooting | FAQ | A
Trade with Gann on your side!! MASTER CIRCLE 360 CIRCLE CHART, originally created by Gann admitted that this is “The Mother of all charts”. It is one of the last studies that this great trader left for us. The numeric tab le is apparently quite simple like all the tables and is based on square numbers, the SQUARE OF 12 and is by evolution, one of the most important square numbers. Here we can find CYCLE, PRICE AND TIME thanks to angles and grades, to show past and future support and resistance.
Monster Harmonic Indicator
Paul Geirnaerdt
4.59 (29)
Monster Harmonics Indicator is a harmonic pattern indicator. It recognizes Gartley, Bat, Crab, Butterfly, Cypher, White Swan, Black Swan, Shark and several other patterns. Projected patterns that are not yet completed are recognized, too. Monster even shows the PRZ (Potential Reversal Zone). Users can add their own user defined patterns to Monster. Besides the current pattern, Monster also shows all patterns in the symbols history. Monster will provide alerts for developing patterns. Introduced
Introduction to X3 Chart Pattern Scanner X3 Cherart Pattern Scanner is the non-repainting and non-lagging indicator detecting X3 chart patterns including Harmonic pattern, Elliott Wave pattern, X3 patterns, and Japanese Candlestick patterns. Historical patterns match with signal patterns. Hence, you can readily develop the solid trading strategy in your chart. More importantly, this superb pattern scanner can detect the optimal pattern of its kind. In addition, you can switch on and off individu
The indicator provides a superior alternative to price action analysis. It enables the identification of normalized patterns, which are then transformed into a graphical representation to forecast future steps within a time series. In the top-left corner, you'll find information regarding the expected prediction accuracy, determined through a complex MSQE calculation. You have the flexibility to adjust the time window, making it easy to validate the indicator's performance. Additionally, you can
Day Pattern
Oleksandr Martsynyshen
Description: - D ay Pattern - an indicator that helps to identify patterns of price changes for the development of trading algorithms and strategies. For whom this tool? - For developers of trading strategies and algorithms. - Medium- and long-term traders. Time frames H1-W1. Features of the indicator: - There is a function of exporting indicator values to a file of the csv format. - Using the information panel, you can conduct an express analysis of trading tool. - The indicat
All Symbols   AND  All Time frames Scan                                                                                                                 Document Introduction   The ABCD is a basic harmonic pattern. The ABCD pattern is a visual, geometric chart pattern comprised of three consecutive price swings. It looks like a diagonal lightning bolt and can indicate an upcoming trading opp
RTrends
Nikolay Likhovid
The RTrends indicator does two things: first, it automatically draws the layout of the price chart by plotting trend lines and, secondly, it produces bearish and bullish signals. The layout reflects the fractal nature of the market. Trends from different time horizons are applied simultaneously on the chart. Thus, from a single chart a trader can see trend lines of higher timeframes. The lines, depending on the horizon, differ in color and width: the older the horizon, the thicker the line is. T
Forex Indicator  " Hook pattern" for MT4 Indicator  " Hook pattern "  is very powerful indicator   for Price Action trading :    No repaint, No delays; Indicator   detects bullish and bearish Hook patterns  on chart: Bullish   Hook    - Blue arrow signal on chart (see pictures) Bearish Hook    - Red arrow signal on chart (see pictures) P C, Mobile & Email alerts   are included Indicator    " Hook pattern"  is good to   combine with Support/Resistance  Levels // More great Expert Advisors and Ind
Master Scalping M1 , trendi hızlı ve doğru bir şekilde belirlemek için bir algoritma kullanan yenilikçi bir göstergedir. Gösterge, pozisyonların açılış ve kapanış zamanını hesaplar, gösterge algoritmaları, bir ticarete girmek (bir varlık satın almak veya satmak) için ideal anları bulmanızı sağlar, bu da çoğu tüccar için işlemlerin başarısını artırır. Göstergenin faydaları: Kullanımı kolaydır, çizelgeyi gereksiz bilgilerle aşırı yüklemez. Herhangi bir strateji için bir filtre olarak kullanılabili
Gösterge, olası minimum gecikme ile   yeniden boyama yapmadan   grafikte harmonik desenleri gösterir. Gösterge üstleri arayışı, fiyat analizinin dalga ilkesine dayanmaktadır. Gelişmiş ayarlar, ticaret tarzınız için parametreler seçmenize olanak tanır. Bir mumun (çubuk) açılışında, yeni bir model oluşturulduğunda, fiyat hareketinin olası yönünün değişmeyen bir oku sabitlenir. Gösterge aşağıdaki kalıpları ve çeşitlerini tanır: ABCD, Gartley (Butterfly, Crab, Bat), 3Drives, 5-0, Batman, SHS, One2On
PZ 123 Pattern
PZ TRADING SLU
1 (1)
Unlock powerful breakout opportunities The 123 Pattern is one of the most popular, powerful and flexible chart patterns. The pattern is made up of three price points: a bottom, a peak or valley, and a Fibonacci retracement between 38.2% and 71.8%. A pattern is considered valid when the price breaks beyond the last peak or valley, moment at which the indicator plots an arrow, rises an alert, and the trade can be placed. [ Installation Guide | Update Guide | Troubleshooting | FAQ | All Products ]
Introduction to Chart Pattern MT Chart Pattern MT is a chart pattern scanner to detect the triangle pattern, falling wedge pattern, rising wedge pattern, channel pattern and so on. Chart Pattern MT uses highly sophisticated chart pattern detection algorithm. However, we have designed it in the easy to use with intuitive user interface. Chart Pattern MT will show all the patterns in your chart in the most efficient format for your trading. You do not have to do tedious manual pattern detection an
Gold Phoenix
Yaroslav Varankin
The perfect tool for Scalng in the Forex markets You can trade both from signal to signal and using take profit  The algorithm does not use Zigzag!  No redrawing!  This is a channel instrument that uses a moving average as a filter. Moving Average  There are 2 parameters for the settings Ma Period = 5 period Moving Average  Channel 1.0 distance of channel lines from the chart Price Signal Filter - calculation of signal opening and filter There is a complete set of Alert There is a multi-timefram
We present you the indicator "Candle closing counter", which will become your indispensable assistant in the world of trading. That’s why knowing when the candle will close can help: If you like to trade using candle patterns, you will know when the candle will be closed. This indicator will allow you to check if a known pattern has formed and if there is a possibility of trading. The indicator will help you to prepare for market opening and market closure. You can set a timer to create a p
The CCI Divergence is a reasonably useful indicator in itself, but it is even more effective when used with divergence pattern trading. The CCI Divergence indicator signal is one of the most potent signals among the indicators that exist in the market. Here is new version for Divergence Indicator using CCI method, with more improvements. Divergences indicate a potential investment point because the directional moment does not confirm the price. A bullish divergence occurs when the underlying
Gartley Projection D
Oleksandr Medviediev
3.71 (7)
Gösterge, H.M.Gartley'in ("Borsadaki Kârlar", 1935г) gelişmelerine göre harmonik kalıpları (XABCD) tanımlar. Perspektif projeksiyonunda D noktasını bir nokta olarak yansıtır (ayarlarda ProjectionD_Mode = true değerini belirtin). Yeniden çizilmez. Çalışma zaman dilimine ait bir çubuk kapandığında, eğer belirlenen formasyon noktası Patterns_Fractal_Bars çubukları sırasında hareket etmediyse grafikte (beklenen fiyat hareketi yönünde) bir ok belirir. Bu andan itibaren ok kalıcı olarak grafikte
Point61 Indicator
Evgeniy Machok
5 (1)
The Point61 indicator is the result of many years of monitoring of price behavior of currency pairs and metals. It is not a secret, that in times of uncertainty, traders are looking for possible levels of support and resistance - the point, where price should stop its movement. There are 2 possible scenarios at these points: 1. Reverse (correction) to the opposite direction; 2. Breakthrough to continue movement. Very often these points are used to set stop orders - TakeProfit or
VR Cub
Vladimir Pastushak
VR Cub , yüksek kaliteli giriş noktaları elde etmenin bir göstergesidir. Gösterge, matematiksel hesaplamaları kolaylaştırmak ve bir pozisyona giriş noktalarının aranmasını basitleştirmek için geliştirildi. Göstergenin yazıldığı ticaret stratejisi uzun yıllardan beri etkinliğini kanıtlamaktadır. Ticaret stratejisinin basitliği, acemi yatırımcıların bile başarılı bir şekilde ticaret yapmasına olanak tanıyan büyük avantajıdır. VR Cub, pozisyon açılış noktalarını ve Kâr Al ve Zararı Durdur hedef sev
Price Breakout pattern Scanner is the automatic scanner for traders and investors. It can detect following patterns automatically from your chart. Head and Shoulder - Common tradable pattern. Reverse Head and Shoulder - This pattern is the reverse formation of the Head and Shoulder. Double Top - When the price hits resistance level twice and decline toward the support level, the trader can anticipate sudden bearish breakout through the support level. Double Bottom - The double bottom pattern is
Trend lines master
The Trading Team Ltd
5 (1)
Launch promotion For a limited time only:  30$ instead of 157$ Summary Create precise trend lines in a second Description This indicator will draw your trend lines automatically with great precision, saving you some precious time. It uses Bill Williams Fractals to identify the key points and draws both inner and outer trend lines. Features Automatically draws precise trend lines
Noize Absorption Index MT4
Ekaterina Saltykova
5 (1)
Noize Absorption Index - is the manual trading system that measures the difference of pressure between bears forces and bulls forces. Green line - is a noize free index that showing curent situation. Zero value of index shows totally choppy/flat market.Values above zero level shows how powerfull bullish wave is and values below zero measures bearish forces.Up arrow appears on bearish market when it's ready to reverse, dn arrow appears on weak bullish market, as a result of reverse expectation. S
The main idea of this indicator is rates analysis and prediction by Fourier transform. Indicator decomposes exchange rates into main harmonics and calculates their product in future. You may use the indicator as a standalone product, but for better prediction accuracy there is another related indicator - FreqoMaster - which uses FreqoMeterForecast as a backend engine and combines several instances of FreqoMeterForecast for different frequency bands. Parameters: iPeriod - number of bars in the ma
This is an arrow indicator without a future function,developed based on the most advanced profit trading algorithms.It has the most innovative and advanced dual trend analysis module, as well as the latest and highly effective market trend prediction algorithm.Trends are your friends, and following larger trends can earn the maximum profit in foreign exchange. This indicator helps traders identify current trends and track them. Someone once made a profit of 10 times in a week by relying on it.No
Elliott Wave Trend was designed for the scientific wave counting. This tool focuses to get rid of the vagueness of the classic Elliott Wave Counting using the guideline from the template and pattern approach. In doing so, firstly Elliott Wave Trend offers the template for your wave counting. Secondly, it offers Wave Structural Score to assist to identify accurate wave formation. It offers both impulse wave Structural Score and corrective wave Structure Score. Structural Score is the rating to sh
Owl smart levels
Sergey Ermolov
4.34 (35)
MT5 versiyonu  |  FAQ Owl Smart Levels Indicator ,   Bill Williams'ın gelişmiş fraktalları , piyasanın doğru dalga yapısını oluşturan Valable ZigZag ve kesin giriş seviyelerini gösteren   Fibonacci seviyeleri   gibi popüler piyasa analiz araçlarını içeren tek gösterge içinde eksiksiz bir ticaret sistemidir. pazara ve kar elde edilecek yerlere. Stratejinin ayrıntılı açıklaması Gösterge ile çalışma talimatı Baykuş Yardımcısı ticaretinde Danışman Yardımcısı Kullanıcıların özel sohbeti -> Satın ald
Forex Gump
Andrey Kozak
2.4 (5)
Forex Gump is a fully finished semi-automatic trading system. In the form of arrows, signals are displayed on the screen for opening and closing deals. All you need is to follow the instructions of the indicator. When the indicator shows a blue arrow, you need to open a buy order. When the indicator shows a red arrow, you need to open a sell order. Close orders when the indicator draws a yellow cross. In order to get the most effective result, we recommend using the timeframes H1, H4, D1. There
Infinity Trend Pro
Yaroslav Varankin
1 (1)
This is a trend indicator without redrawing Developed instead of the binary options strategy (by the color of the Martingale candlestick) Also works well in forex trading When to open trades (binary options) A signal will appear in the place with a candle signaling the current candle It is recommended to open a deal for one candle of the current timeframe M1 and M5 When a blue dot appears, open a deal up When a red dot appears, open a trade down. How to open trades on Forex. When a signal is rec
Chart Patterns Detect 15 patterns (Ascending Triangle, Descending Triangle, Rising Wedge, Falling Wedge, Bullish Flag, Bearish Flag, Bullish Rectangle, Bearish Rectangle Symmetrical triangle, Head and Shoulders, Inverted Head and Shoulders, Triple top, Triple Bottom, Double Top, Double Bottom) Use historical data to calculate the probability of each pattern to succeed (possibility to filter notification according to the chance of success) gives graphic indication about the invalidation level and
Bu ürünün alıcıları ayrıca şunları da satın alıyor
Gann Made Easy
Oleg Rodin
4.85 (82)
Gann Made Easy , bay teorisini kullanarak ticaretin en iyi ilkelerine dayanan, profesyonel ve kullanımı kolay bir Forex ticaret sistemidir. WD Gann. Gösterge, Zararı Durdur ve Kâr Al Seviyeleri dahil olmak üzere doğru SATIN AL ve SAT sinyalleri sağlar. PUSH bildirimlerini kullanarak hareket halindeyken bile işlem yapabilirsiniz. Lütfen satın aldıktan sonra benimle iletişime geçin! Alım satım ipuçlarımı ve harika bonus göstergelerini ücretsiz olarak sizinle paylaşacağım! Muhtemelen Gann ticaret y
Atomic Analyst
Issam Kassas
5 (2)
Öncelikle belirtmek gerekir ki bu Ticaret Göstergesi Yeniden Çizim Yapmaz, Gecikmez ve Gecikme Göstermez, bu da hem manuel hem de robot ticareti için ideal hale getirir. Kullanıcı kılavuzu: ayarlar, girişler ve strateji. Atom Analisti, Piyasada Daha İyi Bir Avantaj Bulmak İçin Fiyatın Gücünü ve Momentumunu Kullanan PA Fiyat Hareketi Göstergesidir. Gürültüleri ve Yanlış Sinyalleri Kaldırmaya ve Ticaret Potansiyelini Artırmaya Yardımcı Olan Gelişmiş Filtrelerle Donatılmıştır. Birden fazla katma
Scalper Inside PRO
Alexey Minkov
4.73 (56)
An exclusive indicator that utilizes an innovative algorithm to swiftly and accurately determine the market trend. The indicator automatically calculates opening, closing, and profit levels, providing detailed trading statistics. With these features, you can choose the most appropriate trading instrument for the current market conditions. Additionally, you can easily integrate your own arrow indicators into Scalper Inside Pro to quickly evaluate their statistics and profitability. Scalper Inside
Şu anda %20 İNDİRİMLİ! Herhangi bir Acemi veya Uzman Tüccar için En İyi Çözüm! Bu gösterge paneli yazılımı 28 döviz çifti üzerinde çalışıyor. Ana göstergelerimizden 2'sine (Gelişmiş Para Birimi Gücü 28 ve Gelişmiş Para Birimi Dürtüsü) dayanmaktadır. Tüm Forex piyasasına harika bir genel bakış sağlar. Gelişmiş Para Birimi Gücü değerlerini, para birimi hareket hızını ve tüm (9) zaman dilimlerinde 28 Forex çifti için sinyalleri gösterir. Trendleri ve / veya scalping fırsatlarını belirlemek içi
Enigmera
Ivan Stefanov
5 (3)
ENIGMERA: Pazarın çekirdeği https://www.enigmera.com Giriş Bu gösterge ve ticaret sistemi, finansal piyasalar için dikkate değer bir yaklaşımdır. ENIGMERA, destek ve direnç seviyelerini doğru bir şekilde hesaplamak için fraktal döngüleri kullanır. Gerçek birikim aşamasını gösterir ve yön ve hedefler verir.  İster bir trendde ister bir düzeltmede olalım çalışan bir sistem.  Nasıl çalışır? ENIGMERA üç çizgiden oluşur: destek/direnç çizgisi, hedef çizgisi ve sapma çizgisi. Sistem, geçmiş veril
TPSproTREND PrO
Roman Podpora
4.79 (19)
TPSpro TREND PRO,   piyasayı otomatik olarak analiz eden, trend ve değişimlerinin her biri hakkında bilgi sağlayan, ayrıca yeniden çizmeden işlemlere girme sinyalleri veren bir trend göstergesidir! Gösterge her mumu ayrı ayrı analiz ederek kullanır. farklı dürtülere atıfta bulunur - yukarı veya aşağı dürtü. Para birimleri, kripto paralar, metaller, hisse senetleri ve endeksler için işlemlere tam giriş noktaları! Sürüm MT5                   GÖSTERGENİN TAM AÇIKLAMASI       Bunu -   RFI SEVİYELER
Dynamic Forex28 Navigator - Yeni Nesil Forex Ticaret Aracı. ŞU ANDA %49 İNDİRİM. Dynamic Forex28 Navigator, uzun zamandır popüler olan göstergelerimizin evrimidir ve üçünün gücünü tek bir göstergede birleştirir: Gelişmiş Döviz Gücü28 Göstergesi (695 inceleme) + Gelişmiş Döviz İMPULS ve UYARI (520 inceleme) + CS28 Kombo Sinyalleri (Bonus). Gösterge hakkında ayrıntılar https://www.mql5.com/en/blogs/post/758844 Yeni Nesil Güç Göstergesi Ne Sunuyor?  Orijinallerde sevdiğiniz her şey, şimdi ye
Trend Punch
Mohamed Hassan
4.95 (19)
This indicator is unstoppable when combined with our other indicator called  Support & Resistance . After purchase, send us a message and you will get it   for  FREE as a BONUS! Introducing Trend Punch , the revolutionary forex trend indicator that will transform the way you trade! Trend Punch is uniquely designed to provide precise buy and sell arrows during strong market trends, making your trading decisions clearer and more confident. Whether you're trading major currency pairs or exotic sym
FX Volume
Daniel Stein
4.58 (33)
Sabah Brifingimiz aracılığıyla ayrıntılar ve ekran görüntüleri ile günlük piyasa güncellemenizi alın burada mql5 ve on Telegram ! FX Volume, bir brokerin bakış açısından piyasa duyarlılığı hakkında GERÇEK bir fikir veren İLK ve TEK hacim göstergesidir. COT raporlarından çok daha hızlı bir şekilde, brokerlar gibi kurumsal piyasa katılımcılarının Forex piyasasında nasıl konumlandıklarına dair harika bilgiler sağlar. Bu bilgileri doğrudan grafiğinizde görmek, ticaretiniz için gerçek oyun değiştir
TPSpro RFI Levels
Roman Podpora
4.82 (22)
TALİMATLAR         RUS   -        ENG       Bir gösterge ile kullanılması   önerilir       -       TPSpro   TREND PRO -   Sürüm MT4         Ticarette önemli bir unsur, bir ticaret aracını satın alma veya satma kararlarının alındığı bölgeler veya seviyelerdir. Büyük oyuncuların piyasadaki varlıklarını gizleme girişimlerine rağmen, kaçınılmaz olarak izler bırakırlar. Bizim görevimiz bu izleri nasıl tanımlayacağımızı ve doğru şekilde nasıl yorumlayacağımızı öğrenmekti. Ana işlevler:: Satıcılar ve
FX Power MT4 NG
Daniel Stein
5 (13)
Sabah Brifingimiz burada mql5 ve on Telegram! FX Power MT4 NG , uzun zamandır çok popüler olan döviz gücü ölçerimiz FX Power'ın yeni neslidir. Peki bu yeni nesil güç ölçer ne sunuyor? Orijinal FX Power hakkında sevdiğiniz her şey PLUS GOLD/XAU güç analizi Daha da hassas hesaplama sonuçları Ayrı ayrı yapılandırılabilir analiz dönemleri Daha da iyi performans için özelleştirilebilir hesaplama limiti Özel çokluDaha fazlasını görmek isteyenler için örnek ayarlar Her grafikte en sevdiğiniz renkler i
Öncelikle, bu Ticaret Aracının Non-Repainting, Non-Redrawing ve Non-Lagging Gösterge olduğunu vurgulamakta fayda var, bu da onu profesyonel ticaret için ideal hale getiriyor. Çevrimiçi kurs, kullanıcı kılavuzu ve demo. Akıllı Fiyat Hareketi Kavramları Göstergesi, hem yeni hem de deneyimli tüccarlar için çok güçlü bir araçtır. İleri ticaret fikirlerini, Inner Circle Trader Analizi ve Smart Money Concepts Ticaret Stratejileri gibi 20'den fazla kullanışlı göstergeyi bir araya getirerek bir araya g
MetaTrader 4 için Ultimate Gold Advisor Ultimate Gold Advisor, MetaTrader 4 üzerindeki ticaret deneyimini optimize etmek için tasarlanmış ileri teknolojik bir araçtır. Deneyimli yatırımcıların ihtiyaçlarını karşılamak amacıyla geliştirilen bu gösterge, doğruluk, sofistike analiz ve çok yönlü işlevselliği bir araya getirerek bilgiye dayalı ticaret kararlarını destekler. Altın ticareti için ideal olmakla birlikte, geniş bir varlık yelpazesinde de uygulanabilir olan Ultimate Gold Advisor, piyasa st
Legacy of Gann
Pavel Zamoshnikov
4.83 (12)
The indicator very accurately determines the levels of the possible end of the trend and profit fixing. The method of determining levels is based on the ideas of W.D.Gann, using an algorithm developed by his follower Kirill Borovsky. Extremely high reliability of reaching levels (according to K. Borovsky  - 80-90%) Indispensable for any trading strategy – every trader needs to determine the exit point from the market! Precisely determines targets on any timeframes and any instruments (forex, met
Gold Channel is a volatility-based indicator, developed with a specific timing algorithm for the XAUUSD pair, which consists of finding possible corrections in the market. This indicator shows two outer lines, an inner line (retracement line) and an arrow sign, where the theory of the channel is to help identify overbought and oversold conditions in the market. The market price will generally fall between the boundaries of the channel. If prices touch or move outside the channel it is a tra
Currency Strength Wizard , başarılı ticaret için size hepsi bir arada çözüm sağlayan çok güçlü bir göstergedir. Gösterge, birden çok zaman dilimindeki tüm para birimlerinin verilerini kullanarak şu veya bu forex çiftinin gücünü hesaplar. Bu veriler, şu veya bu para biriminin gücünü görmek için kullanabileceğiniz, kullanımı kolay para birimi endeksi ve para birimi güç hatları biçiminde temsil edilir. İhtiyacınız olan tek şey, işlem yapmak istediğiniz tabloya göstergeyi eklemektir ve gösterge size
GOLD Impulse with Alert
Bernhard Schweigert
4.56 (9)
Bu gösterge, 2 ürünümüz Advanced Currency IMPULSE with ALERT  +   Currency Strength Exotics  'in süper bir kombinasyonudur. Tüm zaman dilimleri için çalışır ve 8 ana para birimi artı bir Sembol için grafiksel olarak güç veya zayıflık dürtüsünü gösterir! Bu Gösterge, Altın, Egzotik Çiftler, Emtialar, Endeksler veya Vadeli İşlemler gibi herhangi bir sembol için para birimi gücü ivmesini göstermek için uzmanlaşmıştır. Türünün ilk örneğidir, Altın, Gümüş, Petrol, DAX, US30, MXN, TRY, CNH vb.
Scalper Vault
Oleg Rodin
5 (27)
Scalper Vault , başarılı bir scalping için ihtiyacınız olan her şeyi size sağlayan profesyonel bir scalping sistemidir. Bu gösterge, forex ve ikili opsiyon tüccarları tarafından kullanılabilecek eksiksiz bir ticaret sistemidir. Önerilen zaman çerçevesi M5'tir. Sistem size trend yönünde doğru ok sinyalleri sağlar. Ayrıca size üst ve alt sinyaller ve Gann piyasa seviyeleri sağlar. Göstergeler, PUSH bildirimleri dahil her türlü uyarıyı sağlar. Göstergeyi satın aldıktan sonra lütfen benimle iletişim
Matrix Arrow Indicator MT4
Juvenille Emperor Limited
5 (3)
Matrix Arrow Indicator MT4 , forex, emtialar, kripto para birimleri, endeksler, hisse senetlerigibi tüm sembollerde/araçlarda kullanılabilen %100 yeniden boyamayan çoklu zaman çerçevesi göstergesini izleyen benzersiz bir 10'u 1 arada trenddir.  Matrix Arrow Indicator MT4 , mevcut eğilimi erken aşamalarında belirleyecek ve aşağıdakiler gibi 10'a kadar standart göstergeden bilgi ve veri toplayacaktır: Ortalama Yönlü Hareket Endeksi (ADX) Emtia Kanal Endeksi (CCI) Klasik Heiken Ashi mumları Hareke
ŞU ANDA %31 INDIRIMLI !!! Yeni Başlayanlar veya Uzman Tüccarlar için En İyi Çözüm! Bu gösterge benzersiz, yüksek kaliteli ve uygun fiyatlı bir ticaret aracıdır çünkü bir dizi tescilli özellik ve gizli bir formül ekledik. Yalnızca BİR grafikle 28 döviz çiftinin tümü için Uyarılar verir. Yeni bir trendin veya scalping fırsatının tam tetik noktasını belirleyebildiğiniz için ticaretinizin nasıl gelişeceğini hayal edin! Yeni temel algoritmalar üzerine inşa edilen bu sistem, potansiyel işlemler
Blahtech Supply Demand
Blahtech Limited
4.61 (33)
Was: $299  Now: $99   Supply Demand uses previous price action to identify potential imbalances between buyers and sellers. The key is to identify the better odds zones, not just the untouched ones. Blahtech Supply Demand indicator delivers functionality previously unavailable on any trading platform. This 4-in-1 indicator not only highlights the higher probability zones using a multi-criteria strength engine, but also combines it with multi-timeframe trend analysis, previously confirmed swings
AW Prime Oscillator
AW Trading Software Limited
5 (1)
İki osilatörün birleşimi. Birincisi giriş noktalarını, ikincisi ise mevcut trendi gösterir. Gösterge, osilatör sinyallerini iki modda oklarla görüntüleyebilir; tüm hızlı osilatör sinyalleri veya yalnızca mevcut trend yönündeki sinyaller. Çok zaman dilimli bir panele ve üç tür sinyal bildirimine sahiptir. Faydalar: Günlük ve scalping ticaretine uygundur Trend filtreleme Basit ve hassas kurulum Çoklu zaman dilimi paneli Bir danışmana entegrasyona uygundur. Herhangi bir sembol ve herhangi bir zama
Özel MT4 göstergemizle başarılı forex ticaretinin sırrını keşfedin! Forex piyasasında nasıl başarıya ulaşacağınızı hiç merak ettiniz, riski en aza indirirken sürekli olarak kar kazandınız mı? İşte aradığınız cevap! Ticaret yaklaşımınızda devrim yaratacak tescilli MT4 göstergimizi tanıtmamıza izin verin. Benzersiz çok yönlülük Göstergemiz, Renko ve RangeBar Mum oluşumlarını tercih eden kullanıcılar için özel olarak tasarlanmıştır. Bu grafik türlerinin birçok deneyimli tüccar tarafından ter
ŞU ANDA %26 INDIRIMLI Yeni Başlayanlar veya Uzman Tüccarlar için En İyi Çözüm! Bu Gösterge benzersiz, yüksek kaliteli ve uygun fiyatlı bir ticaret aracıdır çünkü bir dizi tescilli özellik ve yeni bir formül ekledik. Sadece BİR grafik ile 28 Forex çifti için Döviz Gücünü okuyabilirsiniz! Yeni bir trendin veya scalping fırsatının tam tetik noktasını belirleyebildiğiniz için ticaretinizin nasıl gelişeceğini hayal edin? Kullanım kılavuzu: buraya tıklayın Bu ilk olan, orijinal! Değersiz bir
Black dragon indicator
Ramil Minniakhmetov
4.85 (110)
Trend algılama göstergesi, herhangi bir stratejiyi tamamlayacak ve bağımsız bir araç olarak da kullanılabilir. ÖNEMLİ! Talimatları ve bonusu almak için satın aldıktan hemen sonra benimle iletişime geçin! Göstergeyle çalışmak için öneriler, yorum #5'ten indirebilirsiniz. Avantajlar Kullanımı kolay, tabloyu gereksiz bilgilerle doldurmaz; Herhangi bir strateji için filtre olarak kullanabilme; Hem kar elde etmek hem de zararları durdurmak için kullanılabilen yerleşik dinamik destek ve diren
Automated Trendlines
Georgios Kalomoiropoulos
5 (16)
Trend çizgileri, forex ticaretinde en önemli teknik analiz aracıdır. Ne yazık ki, çoğu tüccar onları doğru şekilde çizmez. Otomatik Trend Çizgileri göstergesi, piyasaların trend hareketini görselleştirmenize yardımcı olan ciddi tüccarlar için profesyonel bir araçtır. İki tür Trend Çizgisi, Boğa Trend Çizgisi ve Ayı Trend Çizgisi vardır. Yükseliş trendinde, Forex trend çizgisi, fiyat hareketinin en düşük salınım noktalarından geçer. En az iki "en düşük düşük"ü birleştirmek, bir trend çiz
Best Currency Strength Indicator
Tumelo Patrick Rakotsoane
4.59 (46)
Advanced Currency Strength Indicator The Advanced Divergence Currency Strength Indicator. Not only it breaks down all 28 forex currency pairs and calculates the strength of individual currencies across all timeframes , but, You'll be analyzing the WHOLE forex market in 1 window (In just 1 minute) . This indicator is very powerful because it reveals the true movements of the market.  It is highly recommended to  analyze charts knowing the performance of individual currencies or the countries ec
Allows multiple indicators to be combined into a single indicator, both visually and in terms of an alert. Indicators can include standard indicators, e.g. RSI, CCI, etc., and also Custom Indicators, even those purchased through Market, or where just have the ex4 file. An early alert is provided, say when 4 out 5 indicators have lined up, and a confirmed alert when all are in agreement. A‌lso features a statistics panel reporting the success of the combined indicator by examining the current cha
TrendfollowerSR
Paul Reymkhe
4.88 (90)
Take Your Trading Experience To the Next Level ! and get the exclusive TFSR-Analyzer for free !    So you have all these outstanding features  on up to 20 symbols and all timeframes in a smart and clear Design. Correct identification of the trends  in stock investments are pivotal and TrendFollowerSR ensures this perspective while displaying the correct trend on multiply timeframes to help you go long way as much as possible. The latest technology of the Indicator enables to track whether if
Yazarın diğer ürünleri
MetaTrader 4 (MT4) için Mum Çubuğu Formasyonları Göstergesi Bu özelleştirilebilir gösterge, ana yükseliş ve düşüş mum çubuğu formasyonlarını tespit ederek, yatırımcılara teknik analiz ve karar alma süreçlerinde yardımcı olur. Ana Özellikler: Formasyon Tespiti : Yükseliş : Çekiç, Yutan Boğa, Sabah Yıldızı, Üç Beyaz Asker, Boğa Harami, Ters Çekiç. Düşüş : Yıldız Kayması, Yutan Ayı, Akşam Yıldızı, Üç Siyah Karga, Ayı Harami, Asılı Adam. Özelleştirme : Stratejiye göre belirli formasyonları etkinleşt
Fiter
Davit Beridze
5 (2)
İndikatörün alıcıları, Fiter indikatörüne dayalı bir EA'yı bonus olarak ücretsiz alacaklar. (EA'nın nasıl çalıştığını görmek için videoyu izleyin.) EA'yı almak için yorum yapın. Fiter , ATR ile modüle edilmiş bir RSI çizgisini (sarı) içeren bir Üssel Hareketli Ortalama (EMA) ile geleneksel bir Hareketli Ortalama (kırmızı) kombinasyonunu içeren hibrit bir indikatördür. Bu iki çizginin kesişimi, iki basit hareketli ortalamayı kullanmanın klasik yaklaşımına kıyasla çok daha pürüzsüz ve güvenilir
MFI Modern PRO
Davit Beridze
4.92 (36)
Def ault settings   are just for visu alis ation, it c an not be profit able with it.  Get a Free EA as a Bonus when you Purchase the Indicator! Plus, Receive 4 Interesting Additional Indicators. Recommended set files for backtesting the indicator on recommended pairs are available in the comments section (last page). Please note that this product is exclusively sold on the MQL5 market. Any other sources offering it are scams, and the author bears no responsibility. To receive the bonus gifts,
Demo sürümün hiçbir faydası yoktur. Yanıp sönen sayılara bakarak hiçbir şey anlayamazsınız. Bu bir kontrol panelidir. Kavramı anlamaya çalışın, geri kalan her konuda size yardımcı olacağım. Semboller virgüller (,) ile ayrılmalı ve parametrelere tam olarak brokerınızın gösterdiği şekilde girilmelidir, böylece panelde tanınabilirler. Bu semboller gösterge tarafından analiz için kullanılacaktır. Tek tıklamayla herhangi bir çifti ve herhangi bir zaman dilimini doğrudan panelden açabilirsiniz.
"Candle Info" göstergesi, MetaTrader 4 (MT4) platformunda işlem yapan yatırımcılara, grafikteki önemli mum formasyonlarını analiz etme ve görselleştirme imkânı sunar. Yüksek Tepeler (HH), Düşük Dipler (LL), Yüksek Dipler (HL) ve Düşük Tepeler (LH) gibi formasyonları tespit ederek piyasa trendleri ve potansiyel fiyat hareketleri hakkında bilgi verir.    Ana Özellikler: - Mum Formasyonları: HH, LL, HL, LH formasyonlarını tespit eder ve işaretler. Ayrıca HH & HL (yükseliş trendi) ve LL & LH (d
MRA Index
Davit Beridze
5 (5)
You get Ea based on MRA Index for free as a Bonus in case of indicator purchase.  For sc alping I optimize sets on period of l ast 12 months  and use it next 1 month, this w ay it works very well ! Def ault settings   are just for vizu alis ation, it c an not be profit able with it, recommendations about Correct optimization process I sh are with buyers. The "MRA Index" forex indicator is a versatile tool that combines various technical elements to provide traders with valuable insights into pot
Period Cross RSI
Davit Beridze
5 (6)
Check my p a id tools they   work  perfect! "Period Cross RSI" Is a New indicator idea that shows crosses of two RSI lines with different periods which creates ascending and descending zones for confirmation of long and short trading. This indicator is brend new and will be upgraded further, for now I recommend to use it as a confirmation, filter indicator for determination of long/short trading zones, not as a signaler indicator for now. Further upgrades can make it as a signaler indicator as w
FREE
Check my p a id tools they   work  perfect please r ate Here is an Upgraded version with Bonus Ea in case of purchase it costs 30$ only and you get Ea as Bonus:  https://www.mql5.com/en/market/product/96835 This indicator is experimetal, it shows TMA channel arrows with Volatility filter built in to avoid lagging. Try to experiment with it, search for better conditions of use. It is possible to adjust different timeframes for TMA and for Volatility filter Same time on the current chart, so it ma
FREE
MA Speedometer
Davit Beridze
4.6 (10)
Dashboard for Ma Speedometer:  https://www.mql5.com/en/market/product/116784 Non standard attitude to the standard moving average indicator. The essence of the indicator is to determine the strength and speed of the price direction by determining the tilt angle of the moving average. A point is taken on the fifteenth MA candle and a point on the last closed MA candle, a straight line is drawn between them, it is movable and on a hemisphere shows an angle of inclination from 90 degrees to -90.
Check my p a id tools they   work  perfect please r ate Adjustable PIN BAR indicator is usefull tool alowing to search for pin bars you wish to find on the price chart, it has 2 parameters to filter out what type of pin bars you wish to search for: 1) MinTailProc 75% (default) which means to show pin bars that has minimum size of the Nose (Tail) as 75% of full candle size. If Upper Nose (Tail) size of the candle is minimum 75% of the candle size fully than candle is painted in RED. If Lower Nose
FREE
Laguerre Scrat
Davit Beridze
5 (1)
In case you get Laguerre S crat indicator, you will get Laguerre Scrat Ea as a Gift. To get Ea  and det a iled m anu al PDF contact me PM. Default settings are for usd/cad H4 For St able Long term Profits Laguerre Scrat is a trading system based on 4 indicator combinations in the shape of one indicator. Laguerre indicator (upgraded), CCI, Bollinger bands and market volatility factor. It generates arrows in the indicator window and nuts on the price chart, doubling arrows for a better view where
after getting indic ator cont act me for Bonus E a. Non Repaint TMA channel with special conditioned arrows on price cross of channel lines plus market Volatility factor, which makes product much more accurate than any usual tma channel indicators.  It is proven to be profitable with Ea built based on it which you will get as a BONUS in case of indicator purchase. Good luck.
Check my paid tools they work great and I share Ea's based on them for free please r ate The Dual Timeframe RSI (Relative Strength Index) indicator is a novel trading tool that allows traders to monitor RSI readings from two different timeframes on a single chart. This dual perspective enables traders to identify potential trend confirmations and divergences more effectively. For instance, a trader might use a 1-hour RSI alongside a daily RSI to ensure that short-term trades align with the bro
FREE
Indicator shows buy/sell arrows depending on volatility factor. Indicator does not repaint! It works on any pair and any timeframe. It is well tested through strategy builders and shows quite interesting results as a good filter indicator and as independent signaler as well (check the screenshots). It is possible to search for a lot of interesting parameters for profitable trading, some of which are shown on the screenshots. There are next inputs in indicator settings: N-volatility period; Level
B acktest with set files from comments section (L a st comment) with method open price only. Watch video and Turn ON Subtitles when watching! This EA contains Few stop out levels built in what makes it much safer than any other method! Never pay attention to the Stereotips. Any method can be risky if you use them without a Sense. Steady Ranger EA is an advanced automated channel trading system with potential to find out hundreds of profitable set files according to the back tests. This EA is n
RSI Entry Points
Davit Beridze
5 (5)
RSI Entry Points is the upgrade of the standard RSI indicator to avoid lagging. Indicator draws the clouds and the arrows to have clear picture where price is and what to wait for. Why standard RSI is lagging? because mostly we do not use it correctly and it is with very weak visual flexibility, less informative. With my current upgrade I tried to Fix both problems same time and I got much better results and more exact entries than standard RSI has. I Made RSI line Dynamic, it gets more flexible
This EA is Created just for RSI Entry points Indicator ( https://www.mql5.com/en/market/product/67581 Test, to show indicators profitable parameters and to give potential buyers possibility to backtest indicator Entries. EA opens Buy orders on Buy Arrows and Sell orders on Sell Arrows of the indicator, orders are closed on opposite signals. EA is not created for Live automated trading, thats not the goal to sell EA, but any ways if you like it and need it, you can rent. Default settings are f
Re ad First Before Testing. This Ea goes as a Bonus to  MFI Modern PRO indicator users only. Set files generated  after upgrade you can check in comments section. This Expert advisor is based on MFI Modern PRO indicator   https://www.mql5.com/en/market/product/80765 just to  give possibility to indicator users for fastly test the indicator Before buying. In comments section recommended set files are uploaded by which you can prove yourself that backtest data from indicator overview are real. Thi
MA Revolution
Davit Beridze
5 (1)
MA Revolution is upgraded version of standard Moving   A verage. With the current upgrade moving average line got more sensitive with different market conditions. It gets more flexible by decreasing default period step by step while market is sharp and incrasing period back to default period step by step while market is normal again. testing of the ide a shows th at this upgr aded version gives much more acur acy for detecting m arket direction, ch anges in direction are shown much e arly th an
Non standard attitude to the standard moving average indicator. The essence of the indicator is to determine the strength and speed of the price direction by determining the tilt angle of the moving average. A point is taken on the fifteenth MA candle and a point on the last closed MA candle, a straight line is drawn between them, it is movable and on a hemisphere shows an angle of inclination from 90 degrees to -90. above 30 degrees is the buying area, below -30 degrees is the selling area. abo
Indicator shows buy/sell arrows depending on volatility factor. Indicator does not repaint! It works on any pair and any timeframe. It is well tested through strategy builders and shows quite interesting results as a good filter indicator and as independent signaler as well (check the screenshots). It is possible to search for a lot of interesting parameters for profitable trading, some of which are shown on the screenshots. There are next inputs in indicator settings: N-volatility period; Level
RSI Entry Points is the upgrade of the standard RSI indicator to avoid lagging. Indicator draws the clouds and the arrows to have clear picture where price is and what to wait for. Why standard RSI is lagging? because mostly we do not use it correctly and it is with very weak visual flexibility, less informativity. With my current upgrade I tried to Fix both problems same time and I got much better results and more exact entries than standard RSI has. To make yourself sure check out the screens
Filtrele:
leo-leo13
19
leo-leo13 2024.09.20 08:45 
 

Kullanıcı incelemeye herhangi bir yorum bırakmadı

babaxa
19
babaxa 2024.09.20 08:02 
 

Kullanıcı incelemeye herhangi bir yorum bırakmadı

JoaoSilva7
19
JoaoSilva7 2024.09.19 12:44 
 

Mostly i liked the triangles and pennant patterns, i have enabled them into my charts and they are a good tool for market analysis.

Mikeladze Roland
21
Mikeladze Roland 2024.09.17 10:55 
 

I’ve been testing before purchase and using the Chart Patterns All in One indicator for a while now, and I have to say it’s an excellent tool—especially if you understand how to properly use all the features it offers. One thing to be aware of: the triangles are based on the ZigZag indicator, which means they can sometimes disappear or appear later as the price action evolves. This is a natural behavior of any ZigZag-based tool, and it’s clearly mentioned in the product description. However, there’s a smart way to make the most of these triangles: by using a confirmation timeframe. This means before you take a trade based on a triangle signal, you first confirm it on a higher timeframe. By doing this, you can significantly improve the reliability of the signals, even when dealing with patterns that may repaint. That said, it’s important to note that the ZigZag-based triangles are just one of the many patterns available in this indicator. The other patterns—such as the 1-2-3, Double Top/Bottom, and others—do not repaint and work flawlessly. To sum it up, this is a great indicator from Mr. Beridze for those who know how to appreciate good, professional, and effective work. It’s an essential tool to understand what’s happening on your chart and the direction of price. 5 stars for this!

NN
776
NN 2024.09.16 00:46 
 

The 'Chart Patterns All in One' indicator repaints! SCAM!!!!! In the comments section, I can prove to you that it repaints by comparing screenshots of the same chart. When I added the indicator on a different day, it repainted. It even went back in time (from 23:40 back to 22:55). First, there was the BLUE triangle for BUY, and then the PINK triangle for SELL. Maybe $50 isn't much to you, but for some people living in less developed countries, it’s tough to lose such an amount on a product that doesn't work. What he is doing isn't right. I even tried contacting him, but instead some other person contacted me telling me that the Developer cannot communicate on MQL, and I need to contact him in Telegram. Ever heard such nonsense? If you study the comments section of this indicator, you’ll notice that only the developer (Davit Beridze) uploaded posts and praised the performance of his own indicator. You won’t find a single user praising it. I really doubt this developer is honest or that his other products work well. So be aware!

George Heck
362
George Heck 2024.09.12 07:01 
 

Davit is a fantastic guy to talk with. We chatted for a few days about different strategies and indicators he would recommend. This indicator is quite confusing and rather hard to use. BE AWARE THIS INDICATOR WILL REPAINT. A signal may be there on the chart for a buy triangle one moment, but switch over to a sell triangle if the buy is broken. Not saying it's bad, just saying you should know of the repainting.

fangfang
51
fangfang 2024.09.07 19:21 
 

I personally think that triangles are very useful as a tool for determining direction. As long as you are not greedy, weekly profits are more lucrative than working. The author is very meticulous, and the user manual covers languages from various countries. The overall experience is great.

Davit Beridze
7805
Geliştiriciden yanıt Davit Beridze 2024.09.08 10:17
Thanks
Junichi Isono
753
Junichi Isono 2024.08.27 01:40 
 

It is a very accurate indicator. I'm waiting for a sign on the 4-hour timeframe and looking for an entry point on the 15-minute timeframe, and both signs are valid.

Davit Beridze
7805
Geliştiriciden yanıt Davit Beridze 2024.09.08 10:17
thanks
สุกิจฏิพันธ์
209
 

Kullanıcı incelemeye herhangi bir yorum bırakmadı

Davit Beridze
7805
Geliştiriciden yanıt Davit Beridze 2024.07.27 14:40
welcome. thanks
danmar
1490
danmar 2024.07.25 15:06 
 

I ask before buying and for quite the first time i have a seller who is also a trader who share experience and that was nice and interesting. The tool is easy to use and accurate. if possible in an future update , if the size and the text of each of the 4 buttons could be in parameter it will be better to save space , but it is already well done. very Good tool and very simple to use with this kind of accuracy. well done.

Davit Beridze
7805
Geliştiriciden yanıt Davit Beridze 2024.07.27 14:40
thank you very much
lauro1956
4857
lauro1956 2024.07.25 09:56 
 

Excellent indicator from Mr. Beridze An encyclopedia at your disposal

A great effort to make it available to us

5 stars

Davit Beridze
7805
Geliştiriciden yanıt Davit Beridze 2024.07.27 14:39
thanks Lauro
İncelemeye yanıt
Sürüm 2.2 2024.08.16
With this update when you chose some patterns to show from Panel, Changing Timeframes will not turn ON all patterns on panel, for example if you need to check triangles pattern only on different timeframes you will not need to turn OFF other patterns from panel every time you change timeframe. Chosen pattern will stay ON
Sürüm 2.1 2024.08.09
Double Top-Bottom and Triple Top-Bottom arrows fixed, it was showing arrows from current bar which is working process and appearing and disappearing on current bar is normal, but some traders understand that as "Repaint" which is not true. Now Arrow appears on closed bar so no working process show up any more.
Sürüm 1.20 2024.07.27
Now "Control Panel" is movable, you can drag it to any place you wish on the chart. Alerts are given now on closed bar, after signal is formed. not on current bar!
Sürüm 1.1 2024.07.24
Few bugs fixed and Added Max Bar option to make indicator appear that parts which possible to do that way. this way it gets softer, in case you wish to check more history back on chart just increase that number in options, default it is set to 1000.