ATR Zone
- Indicadores
- Sergey Ermolov
- Versión: 1.1
- Activaciones: 10
ATR es un indicador importante para cualquier mercado financiero. La abreviatura ATR corresponde a Average True Range. Este indicador es un instrumento para determinar la volatilidad del mercado, este es su propósito directo. ATR muestra el movimiento medio del precio para el período de tiempo seleccionado.
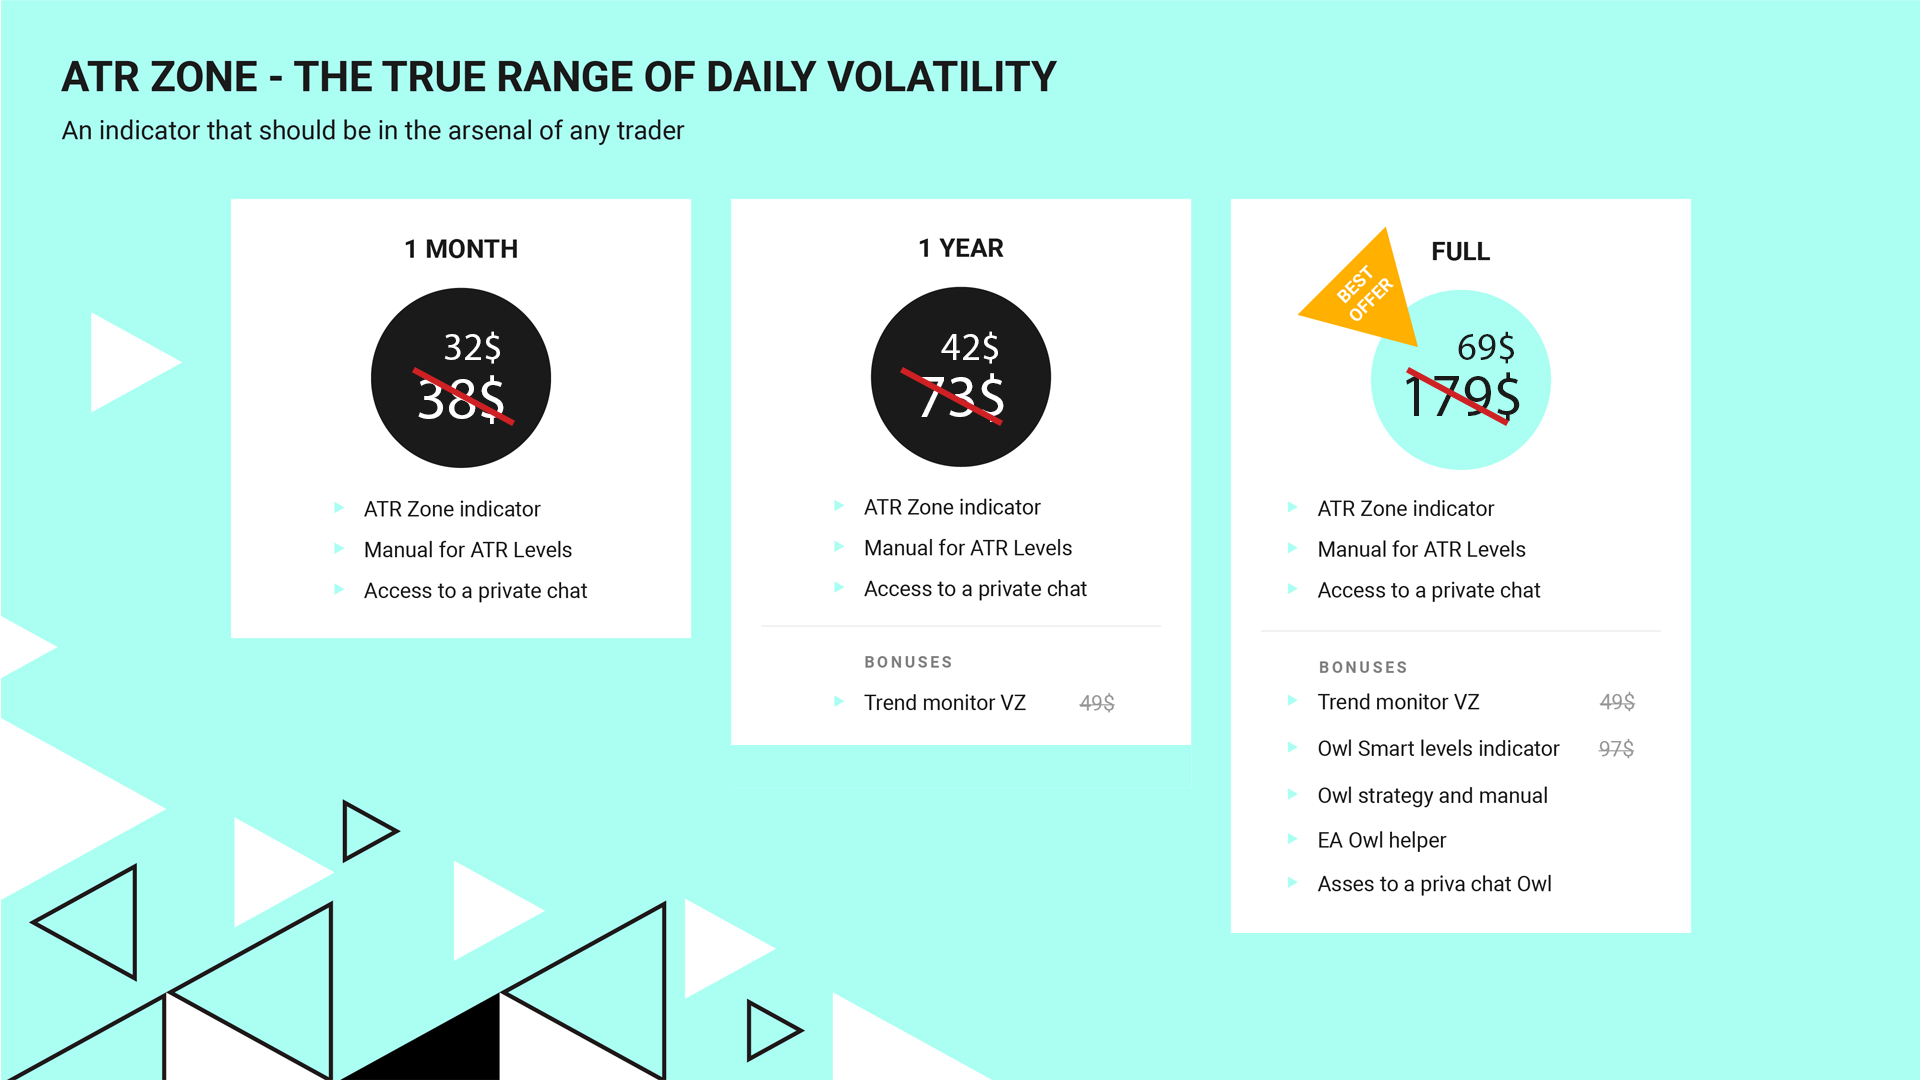
El precio inicial del indicador es 63$. El precio aumentará cada 10 ventas hasta 179$
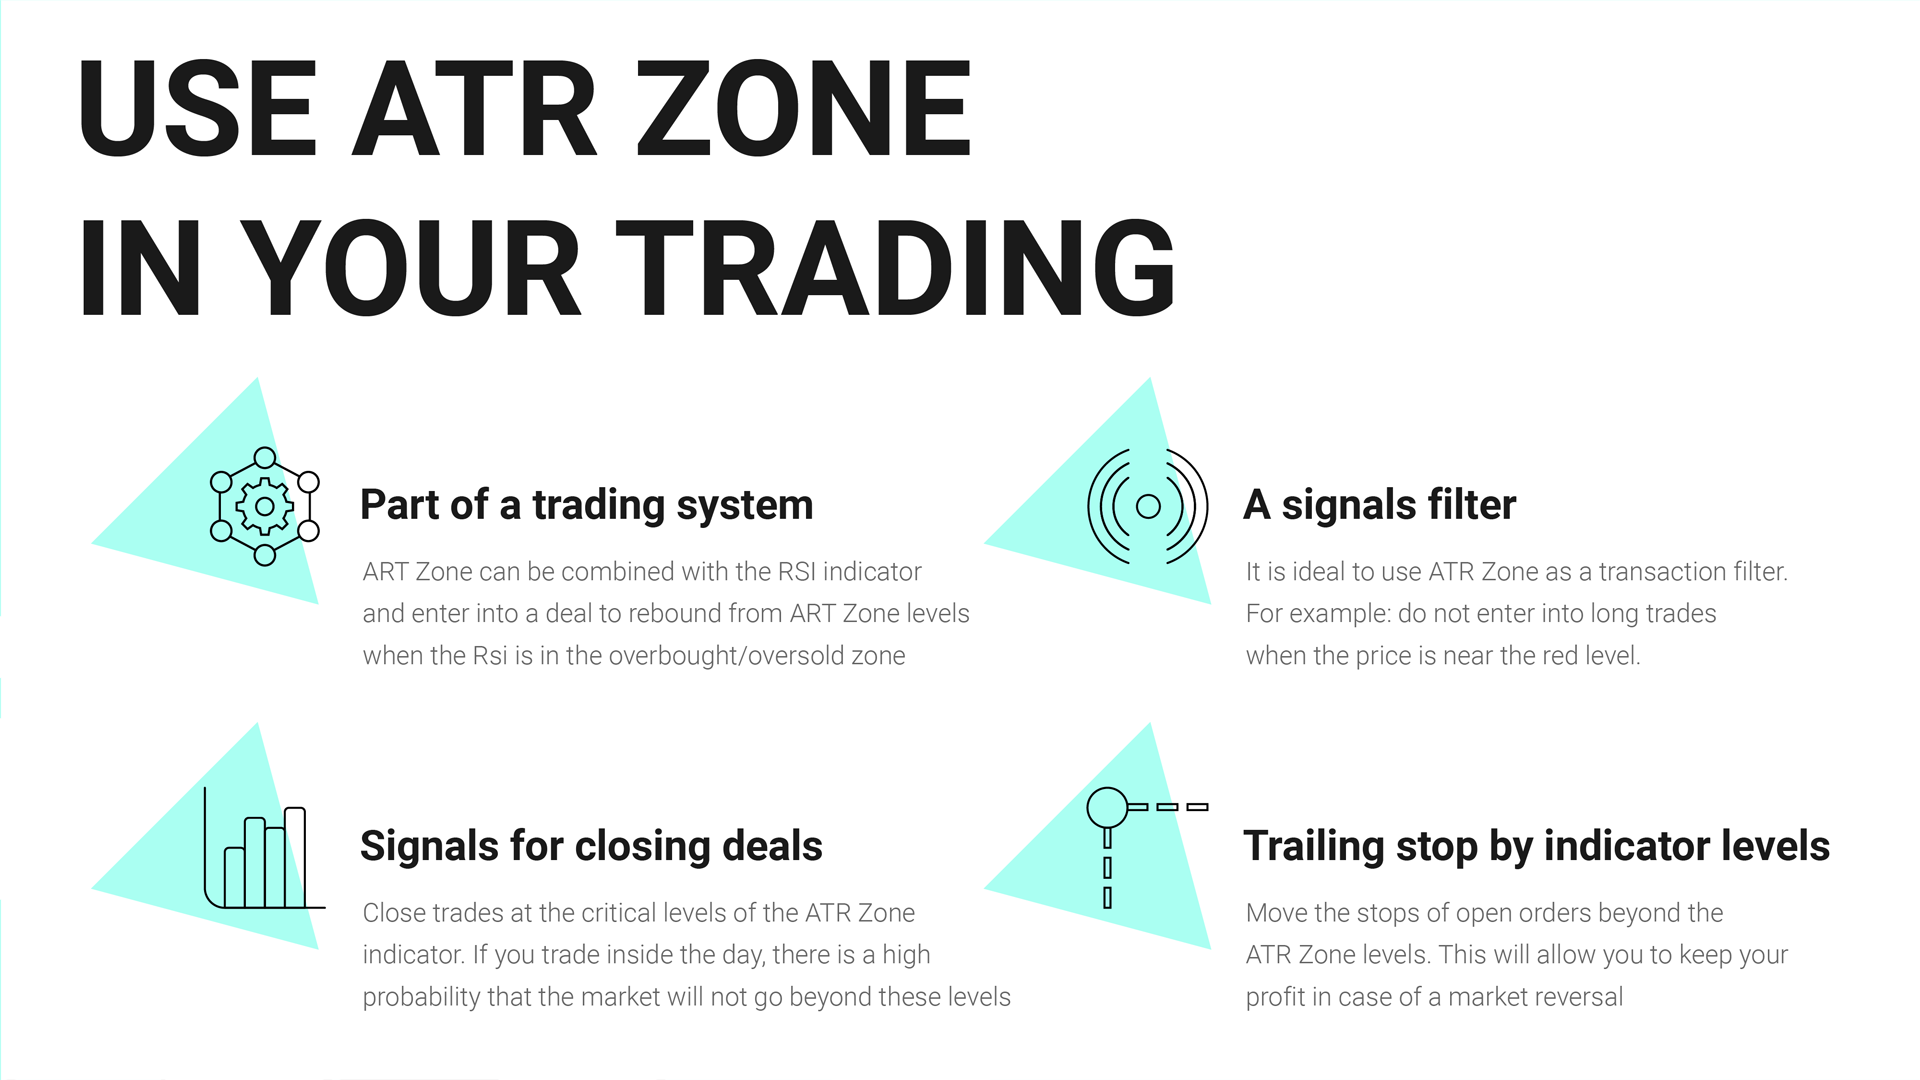
El indicador ATR original está presente en muchos programas de trading. El indicador ATR no es muy informativo, así que modifiqué sus datos y obtuve el Indicador ATR Zone. El indicador ATR Zone muestra niveles en el gráfico, que son más comprensibles y convenientes para tomar decisiones de trading. Además, he añadido algunas recomendaciones importantes sobre el cálculo del indicador del gurú del trading Alexander Gerchik.
Después de la compra escríbame en mensajes privados y recibirá:
- Un manual con instrucciones detalladas para el indicador
- Indicador Trend Monitor
- Indicador Owl Smart Levels
- Expert Advisor Owl Helper
- Acceso al chat privado para usuarios
¿Cómo calcula el indicador?
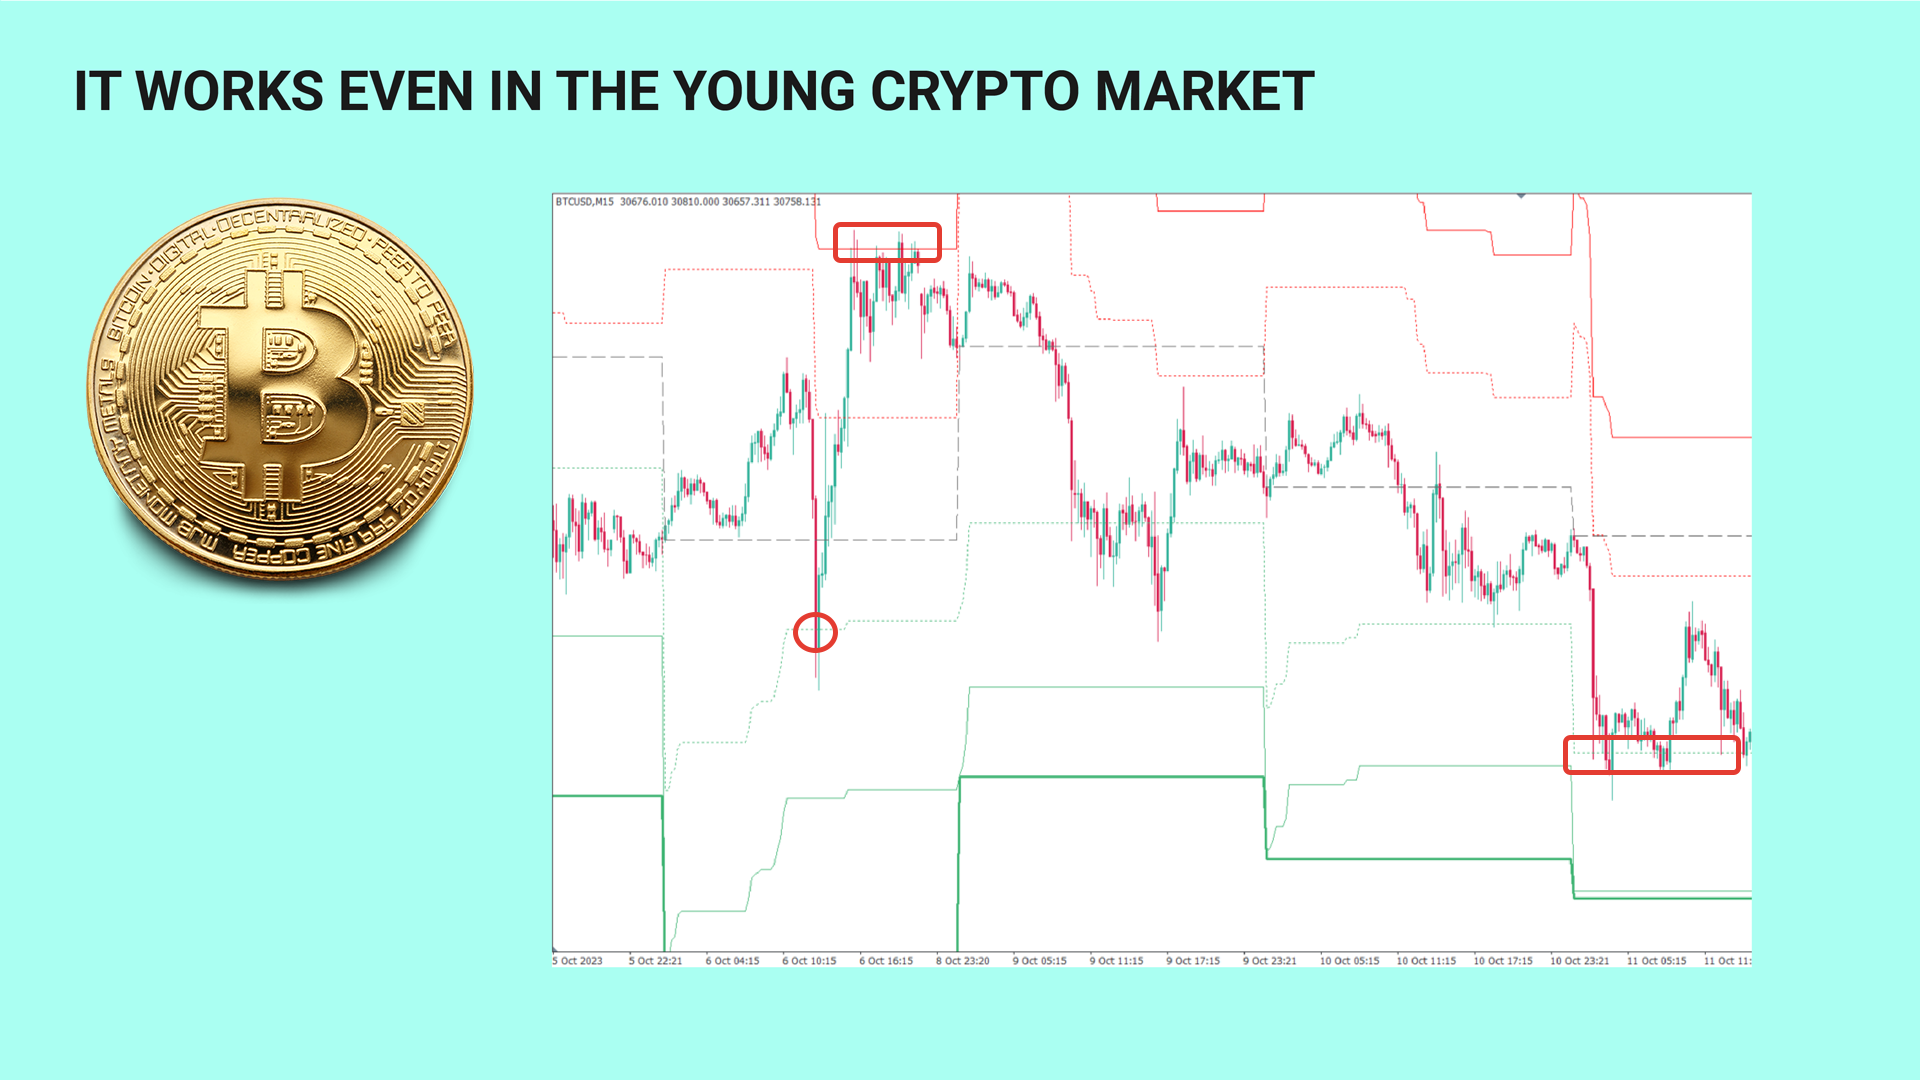
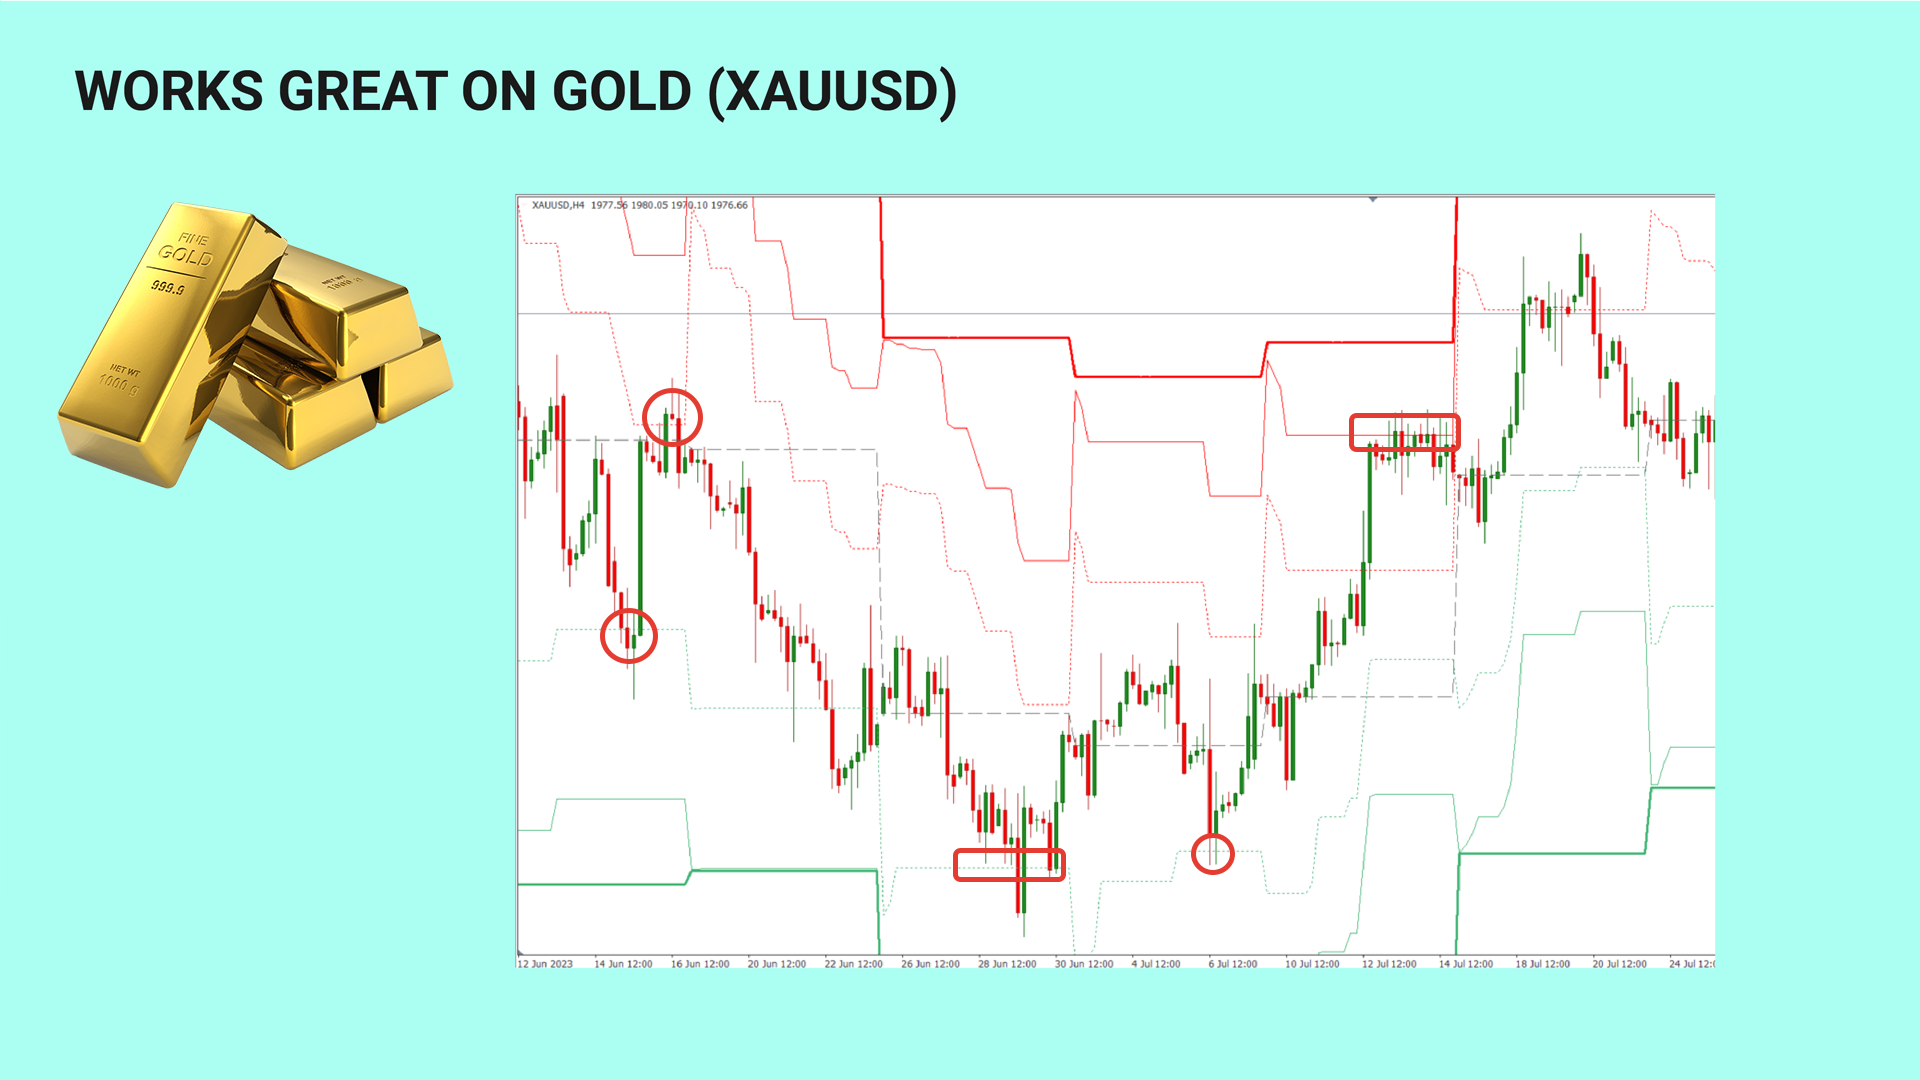
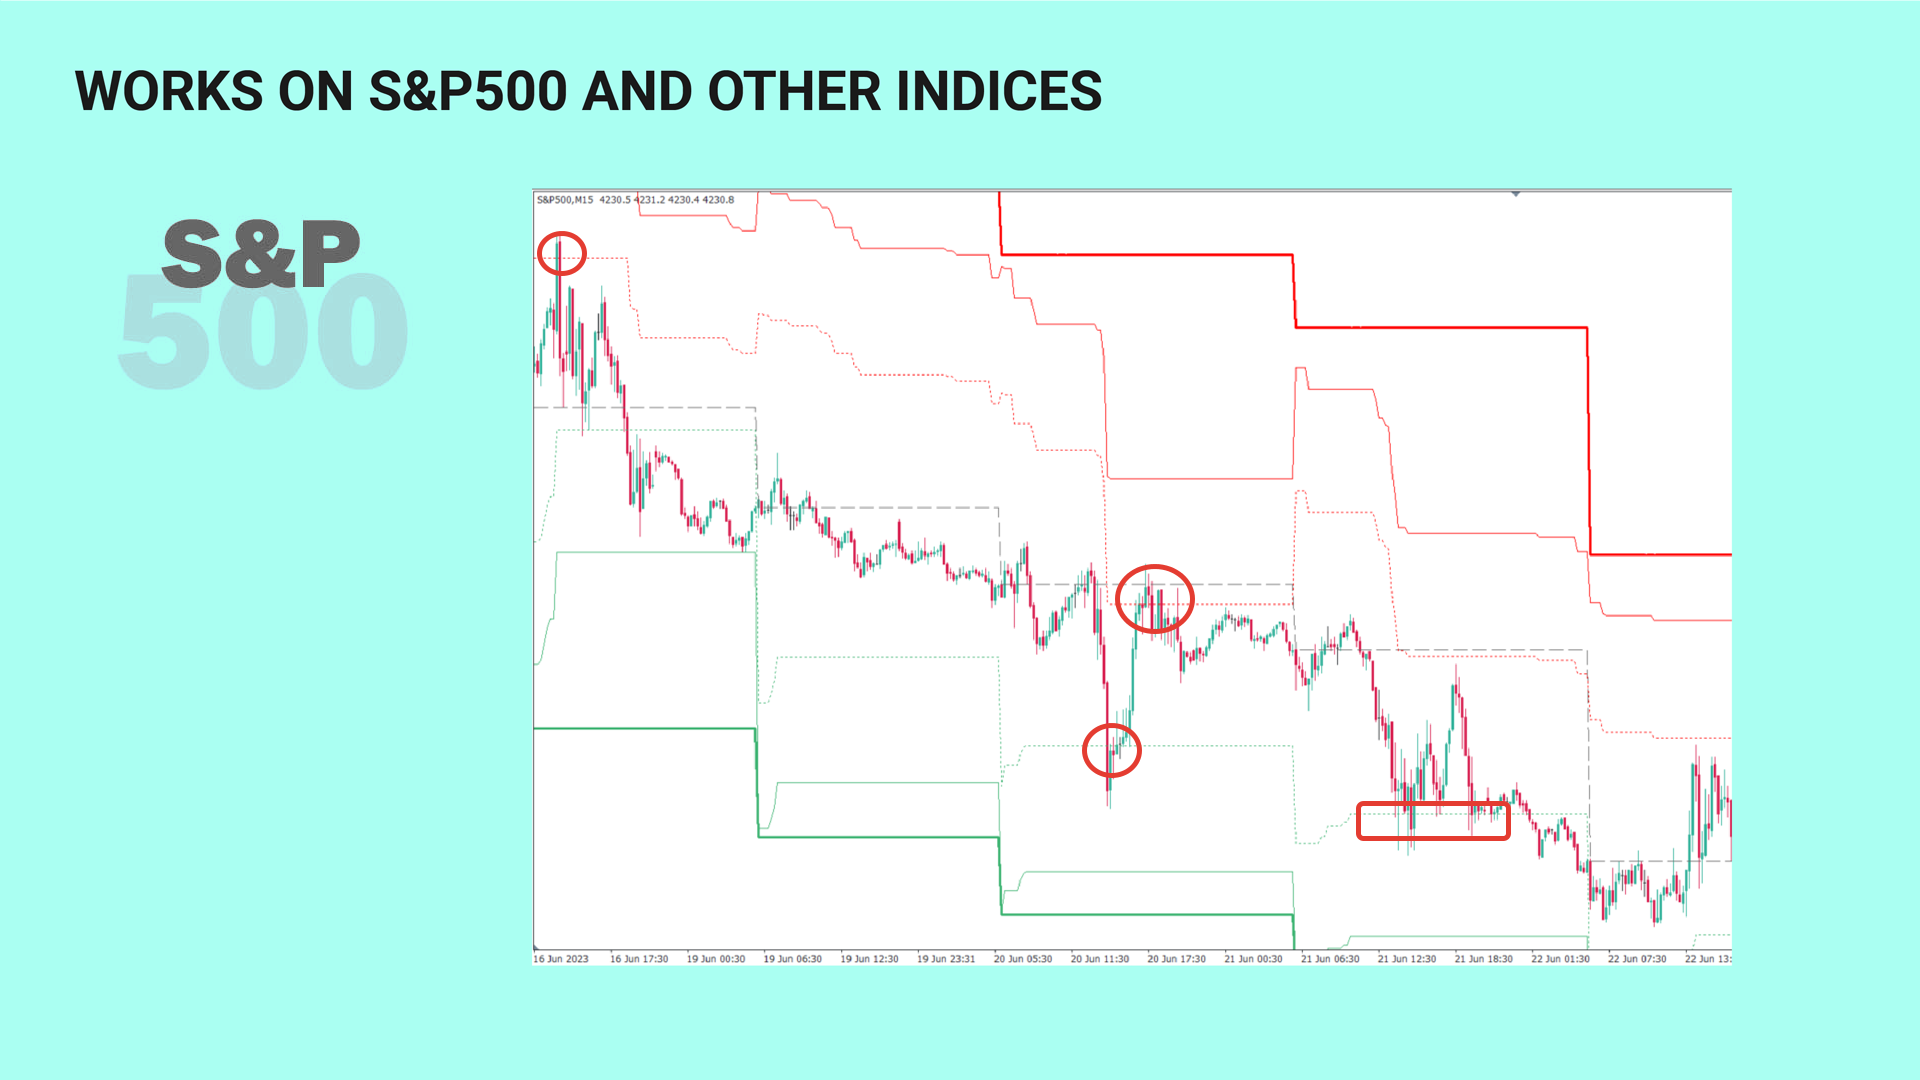
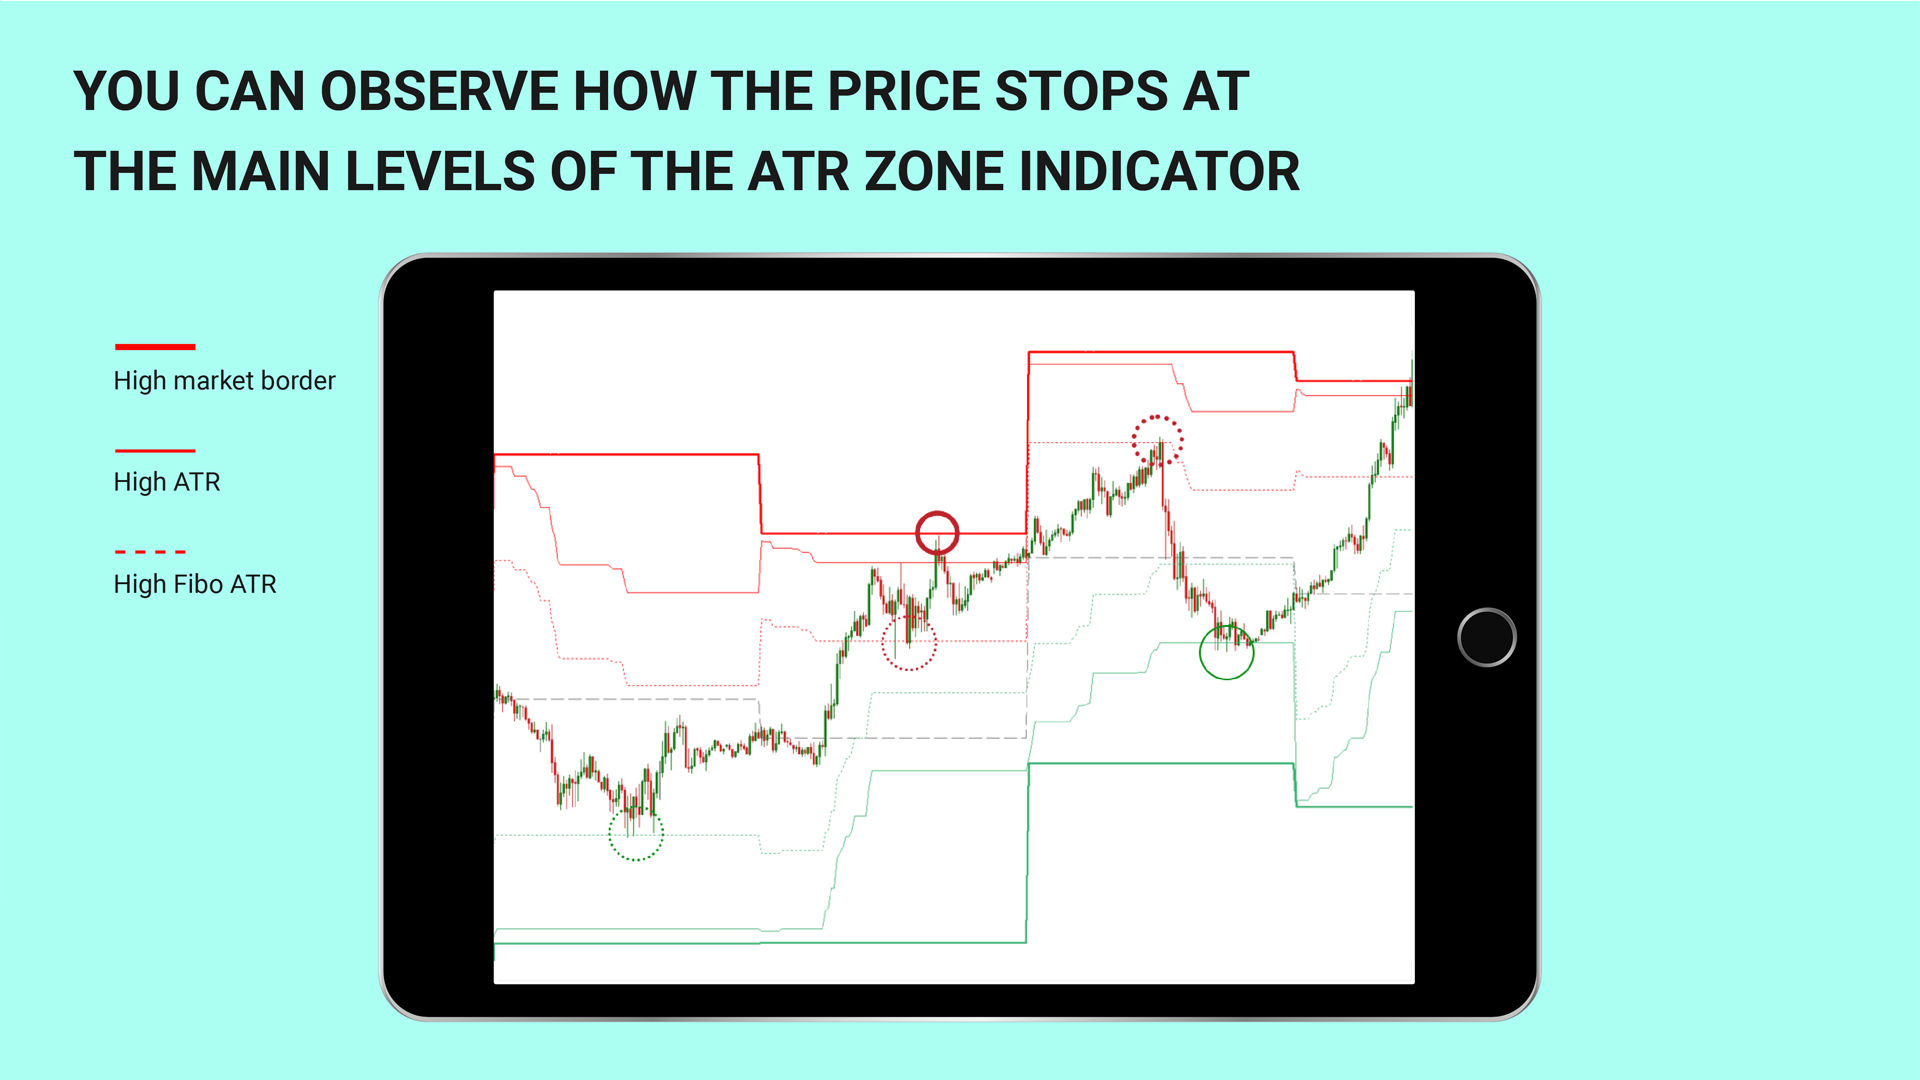
El indicador más importante que realmente necesitamos en el trading intradiario es el movimiento del precio medio diario. Conociendo el movimiento del precio medio diario, podemos establecer los límites (niveles de negociación) en el gráfico, a partir de los cuales el mercado perderá energía. Estos niveles están marcados por el Indicador ATR Zone con líneas rojas y verdes en negrita.
¡¡¡IMPORTANTE!!! El Indicador ATR Zone calcula el rango medio diario del movimiento del precio (cuenta velas D1), y construye niveles en un timeframe más pequeño.
Así que incluso en el timeframe M1, M5, M15, H1 se obtienen los niveles de la gama media diaria, que es más informativo durante el trading intradía.
Anteriormente he hablado de importantes adiciones al indicador. El popular trader Alexander Gerchik recomienda utilizar el valor medio del movimiento del precio durante los últimos 5 días, pero no debe tener en cuenta las barras diarias extremadamente grandes y extremadamente pequeñas. Hice caso a su recomendación y apliqué esta regla en el Indicador ATR Zone.
Parámetros del Indicador ATR Zone.
- The beginning of the day - el comienzo de la cuenta atrás del indicador.
Creo que es incorrecto tomar el comienzo de la cuenta atrás 00:00 horas del día en curso. Es más correcto tomar como punto de partida la hora de inicio de la sesión de trading en una de las zonas de trading. En mi trading tomo la hora de inicio de la sesión europea como punto de partida.
- ATR averaging period - número de días para calcular el valor medio del movimiento diario del precio.
- Exclude the bar more - el coeficiente de barras grandes, que excluye las barras que son demasiado grandes del cálculo del valor medio del ATR (el valor 2 significa que las barras, que son más de 2 veces el ATR medio, no participan en los cálculos).
- Exclude smaller bars - el coeficiente de barras pequeñas, que excluye las barras que son demasiado pequeñas del cálculo del valor medio del ATR (el valor de 0,5 significa que las barras que son menos del 50% del ATR medio no participan en el cálculo).
- Fibo level - nivel Fibonacci para construir niveles adicionales (niveles punteados)
- The number of bars to calculate - número de barras a la izquierda para mostrar en el gráfico
Soy Sergey Ermolov, ¡sígueme para recibir actualizaciones!