• Panoramica
  • Recensioni
  • Commenti

ATR Zone

ATR è un indicatore importante per qualsiasi mercato finanziario. L'abbreviazione ATR corrisponde all'acronimo di Average True Range. Questo indicatore è uno strumento per determinare la volatilità del mercato, questo è il suo ruolo diretto. ATR mostra il movimento medio del prezzo per il periodo di tempo selezionato.

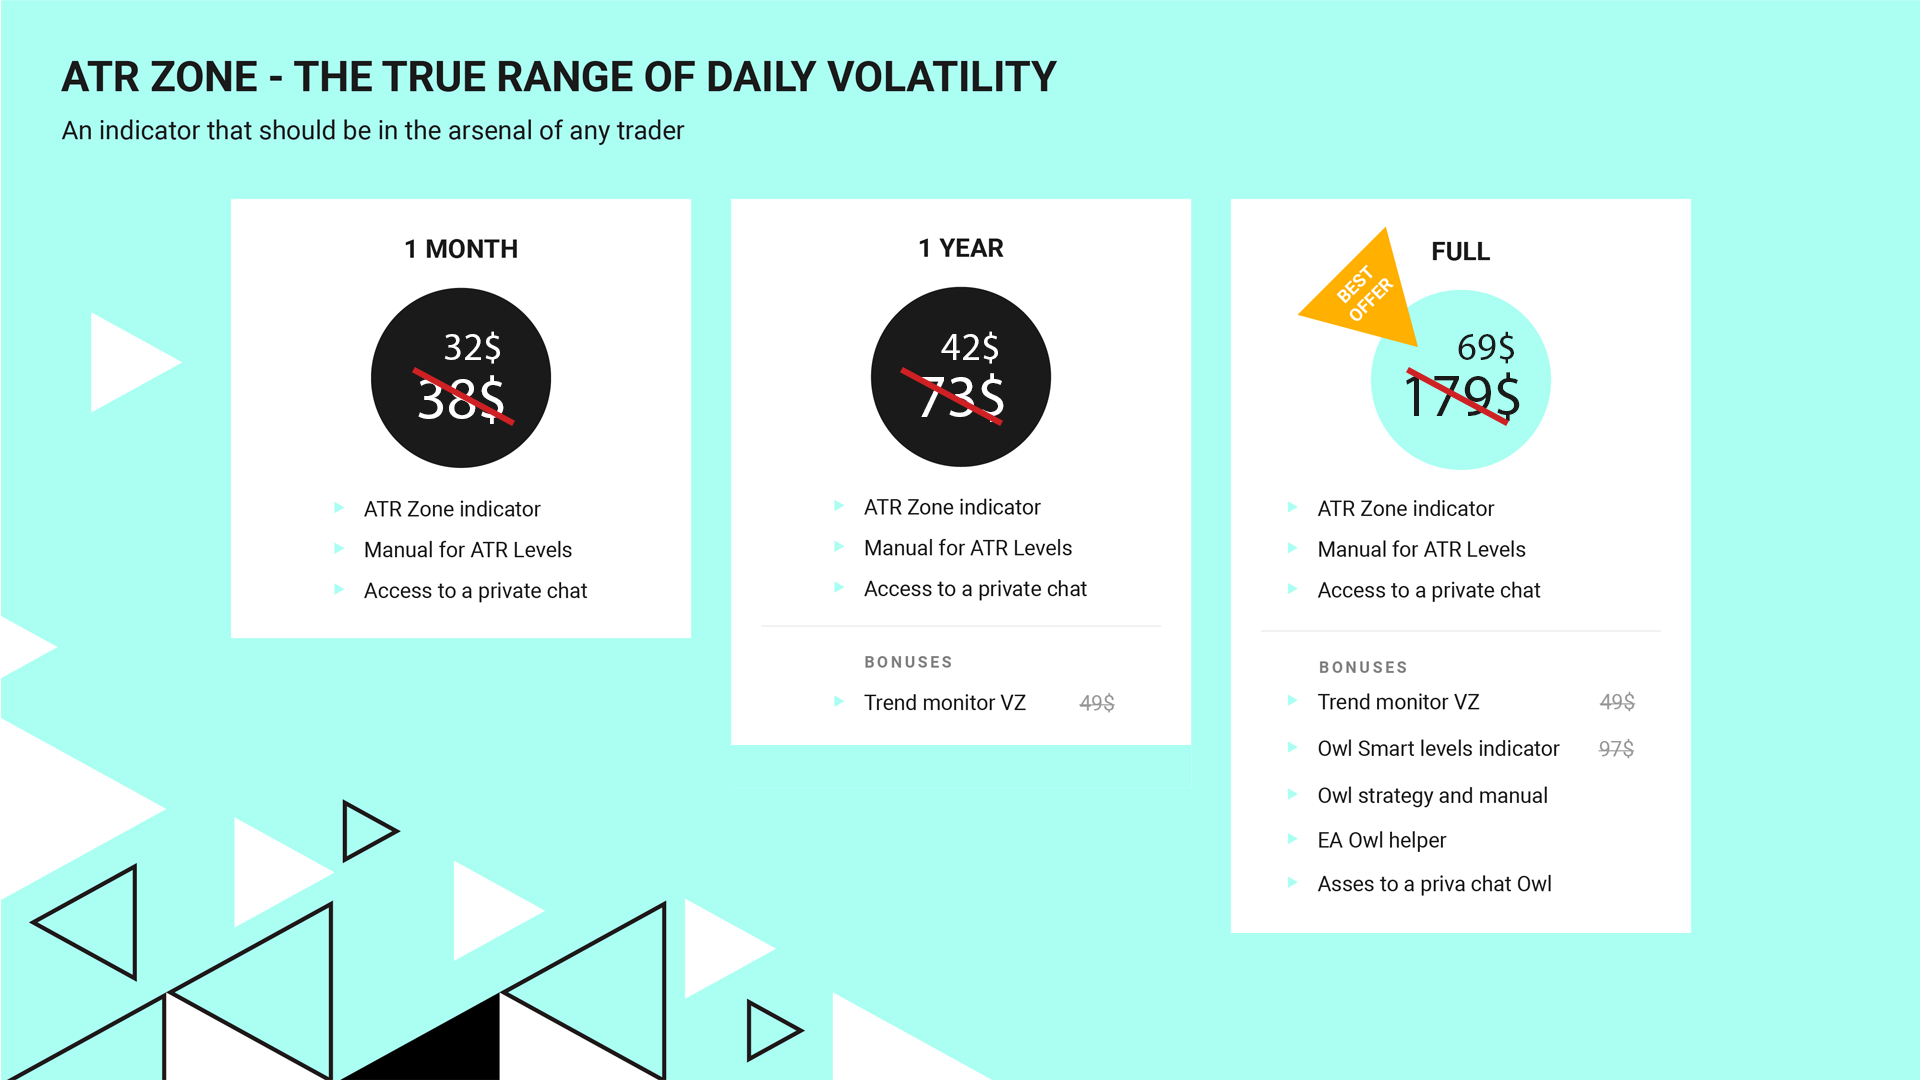
Il prezzo iniziale dell'indicatore è 63$. Il prezzo aumenterà ogni 10 vendite fino a 179$.

L'indicatore ATR originale è presente in molti programmi di trading. L'indicatore ATR non è molto informativo, perciò ho modificato i suoi dati e ho ottenuto l'indicatore ATR Zone. L'indicatore ATR Zone visualizza i livelli sul grafico, che sono più comprensibili e comodi per prendere decisioni di trading. Inoltre, ho aggiunto alcune importanti raccomandazioni sul calcolo dell'indicatore fornite dal guru del trading Alexander Gerchik.

Dopo l'acquisto scrivetemi nei messaggi privati e riceverete:

  • Un manuale con istruzioni dettagliate per l'indicatore
  • Indicatore Trend Monitor
  • Indicatore Owl Smart Levels
  • Expert Advisor Owl Helper
  • Accesso alla chat privata degli utenti

Come l'indicatore fa i calcoli?

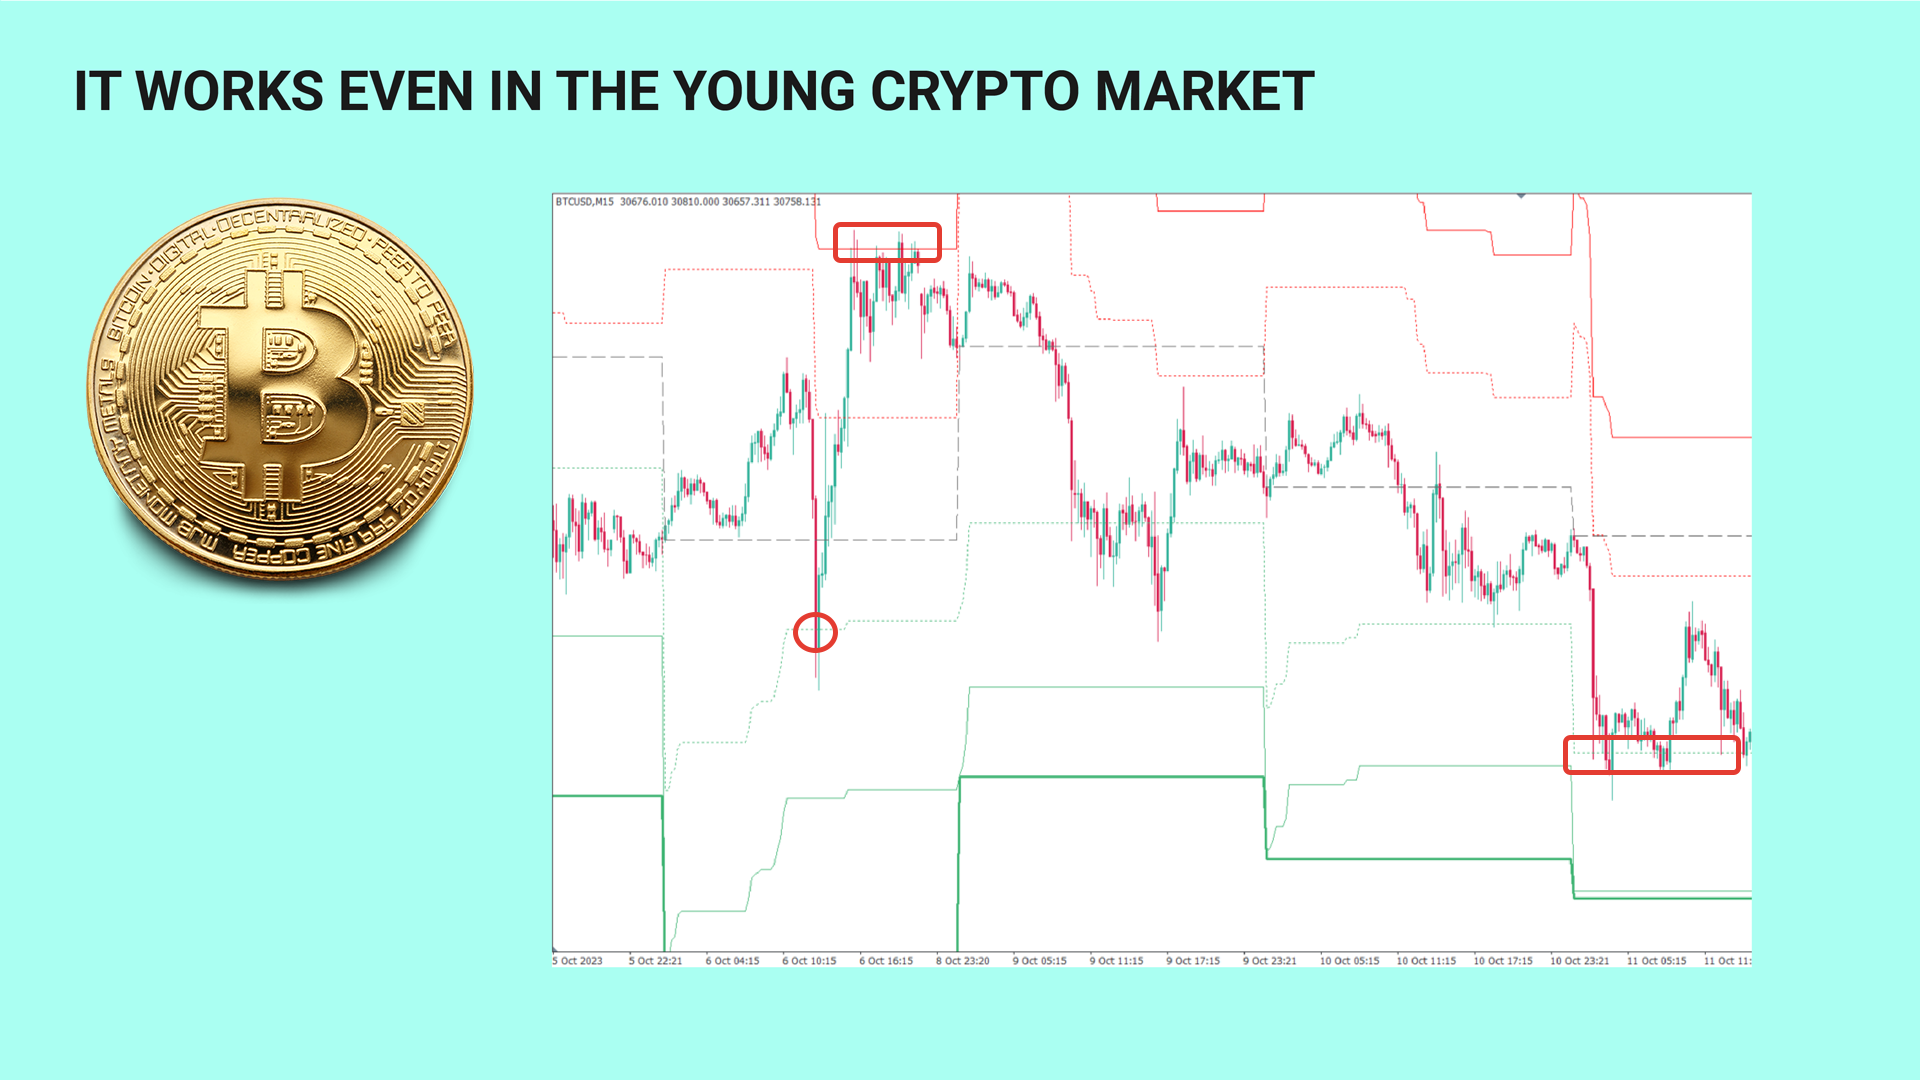
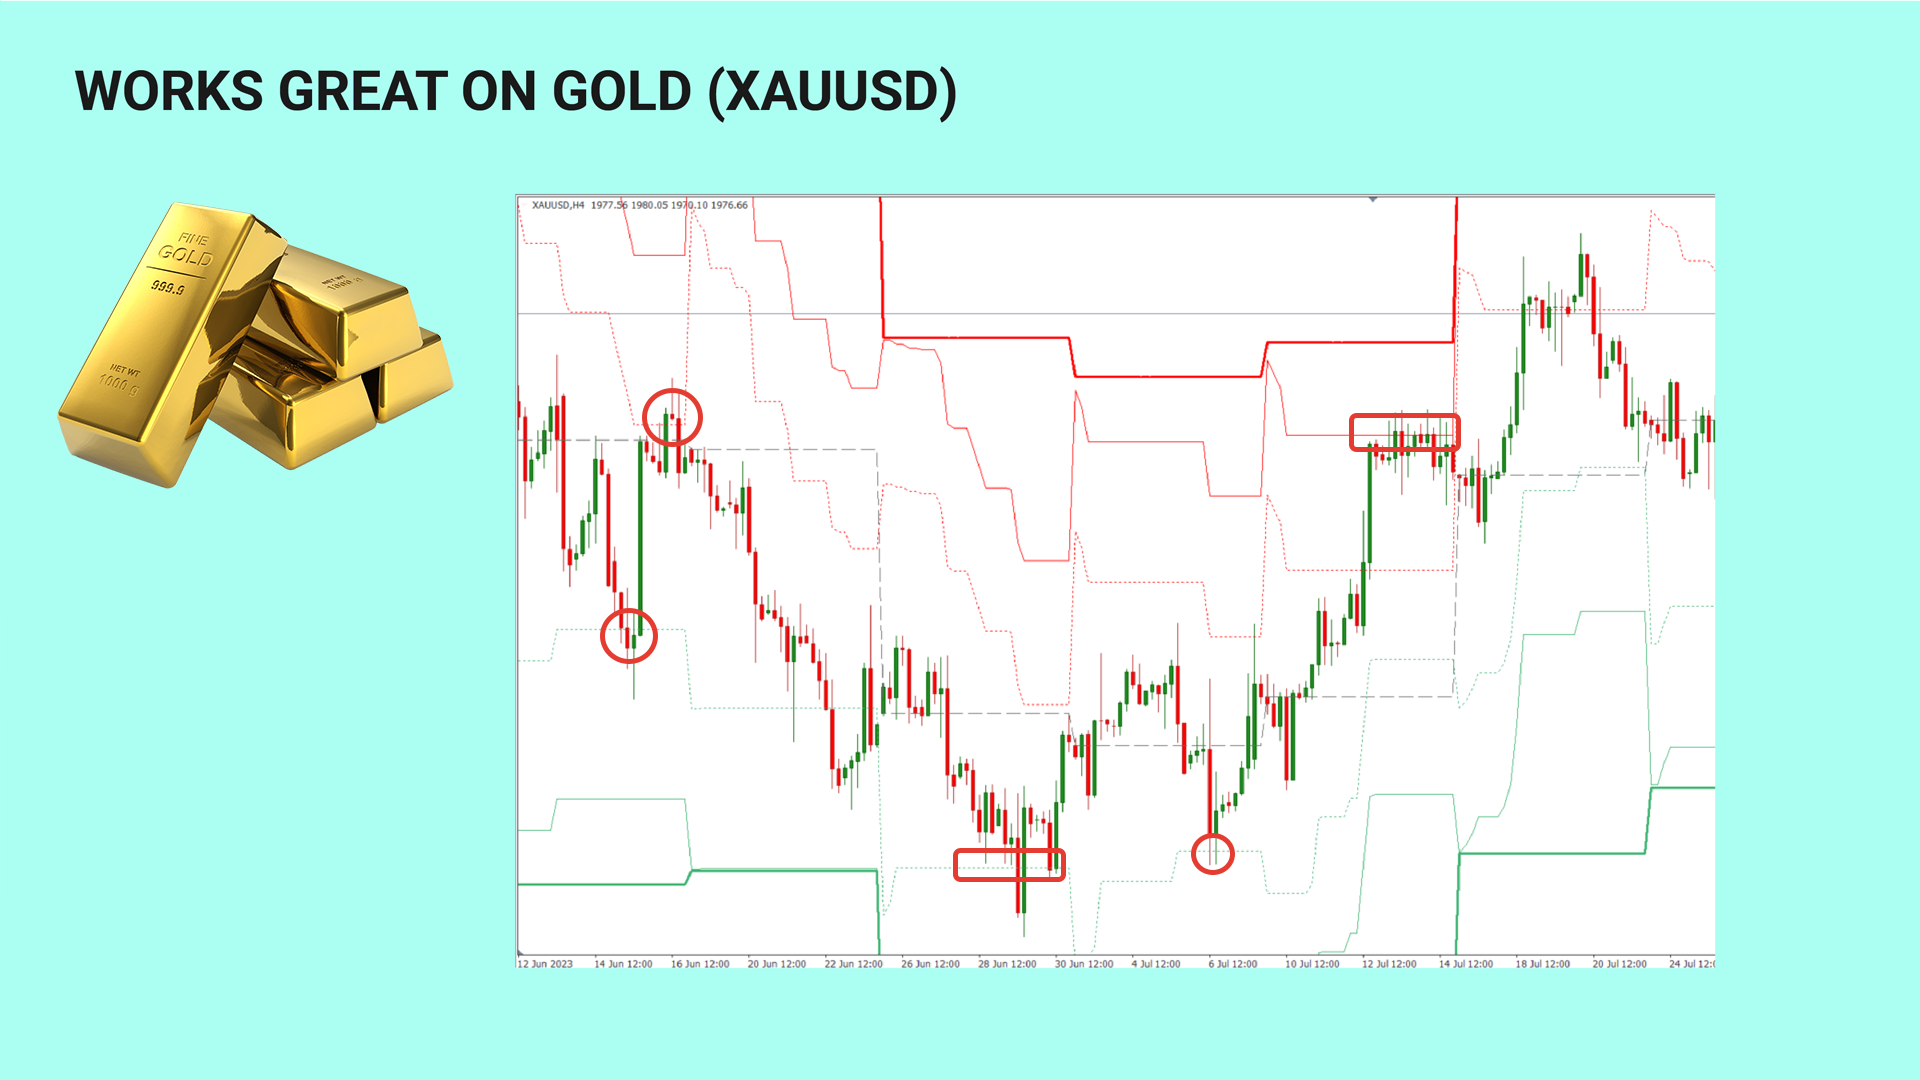
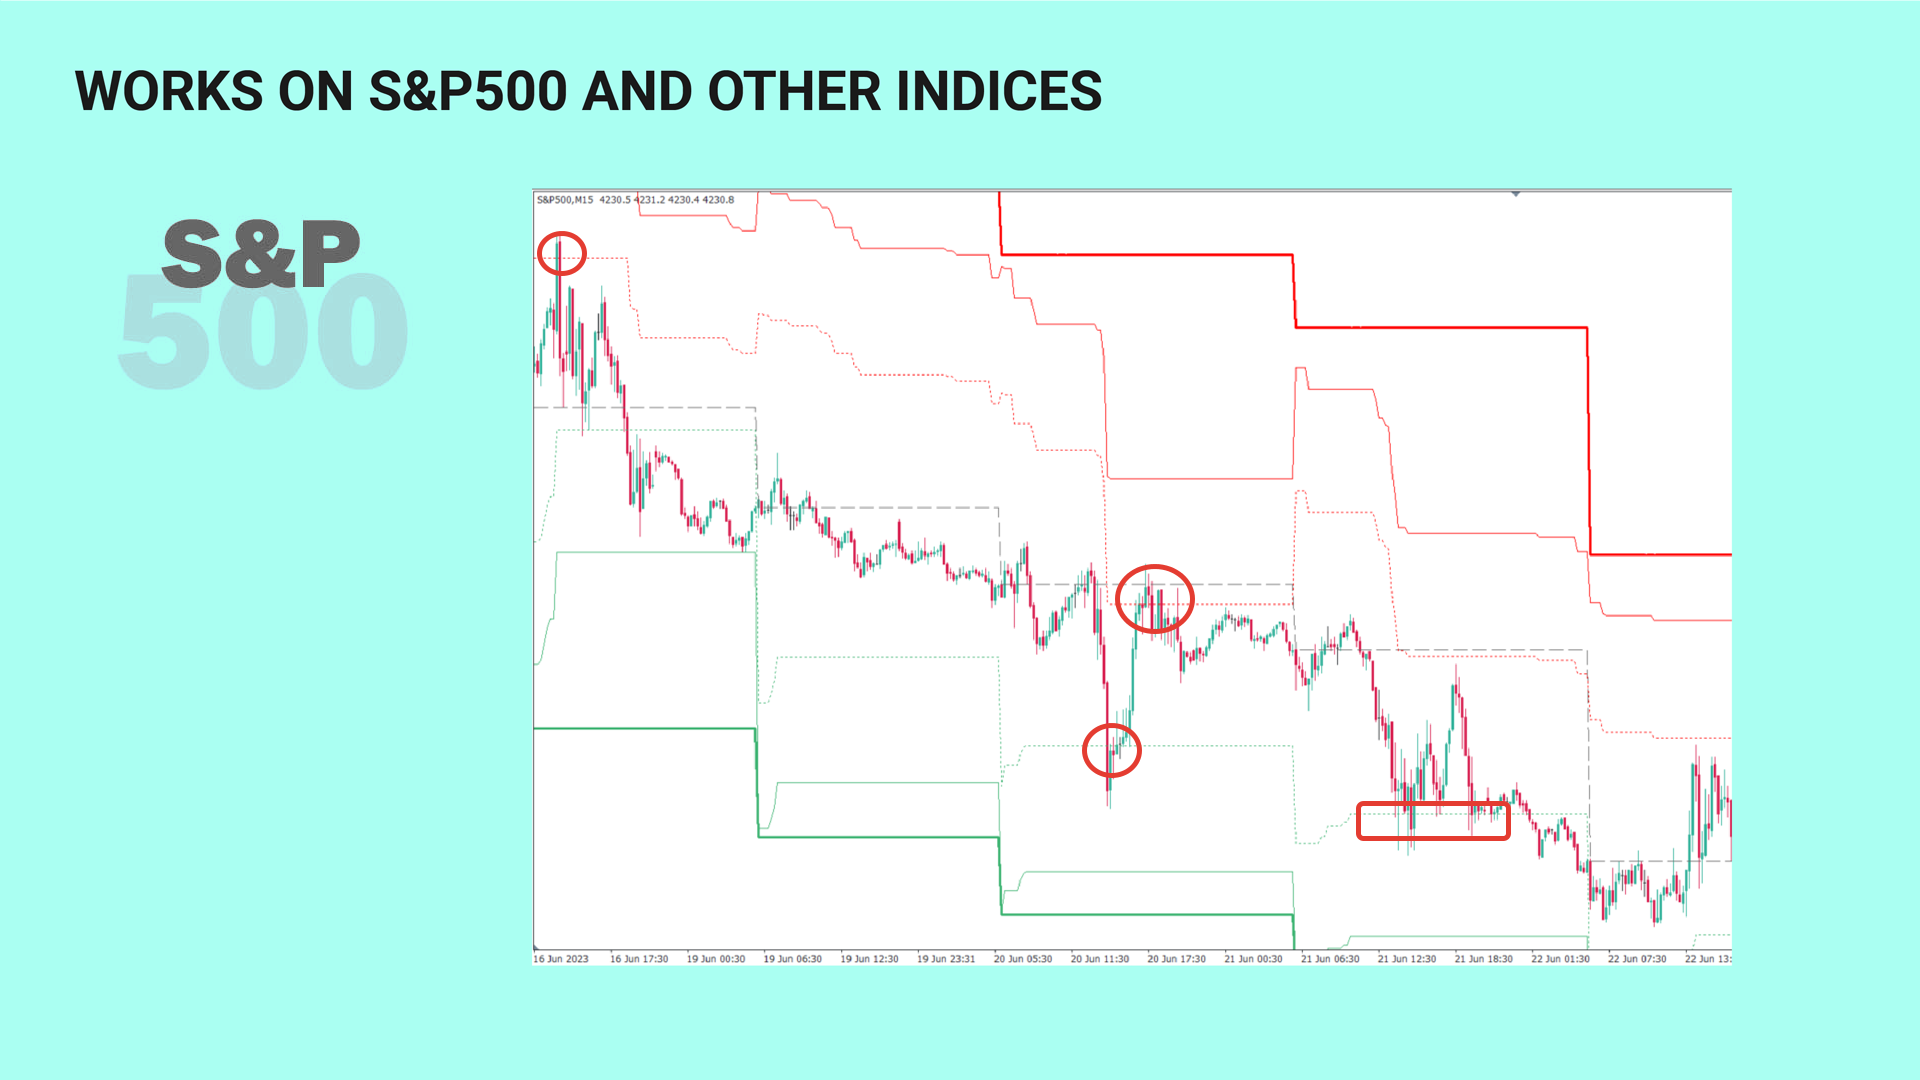
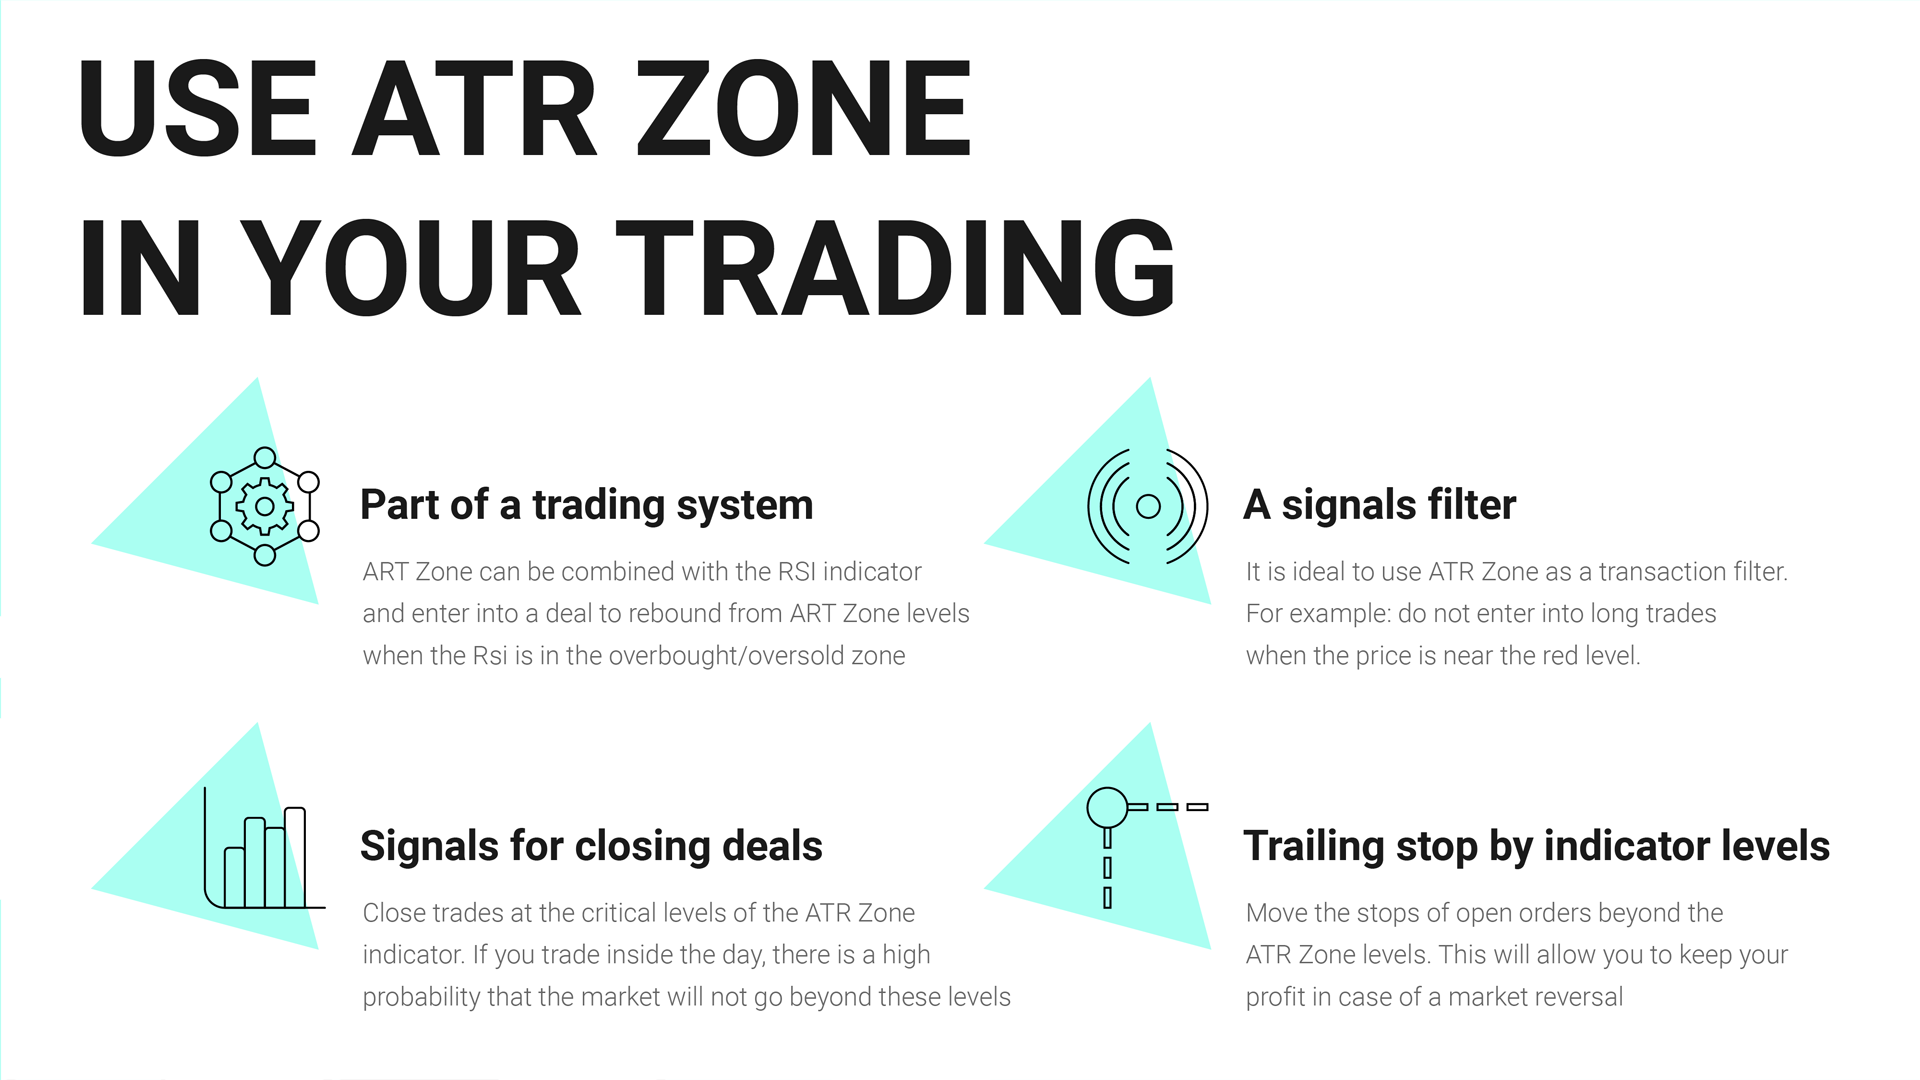
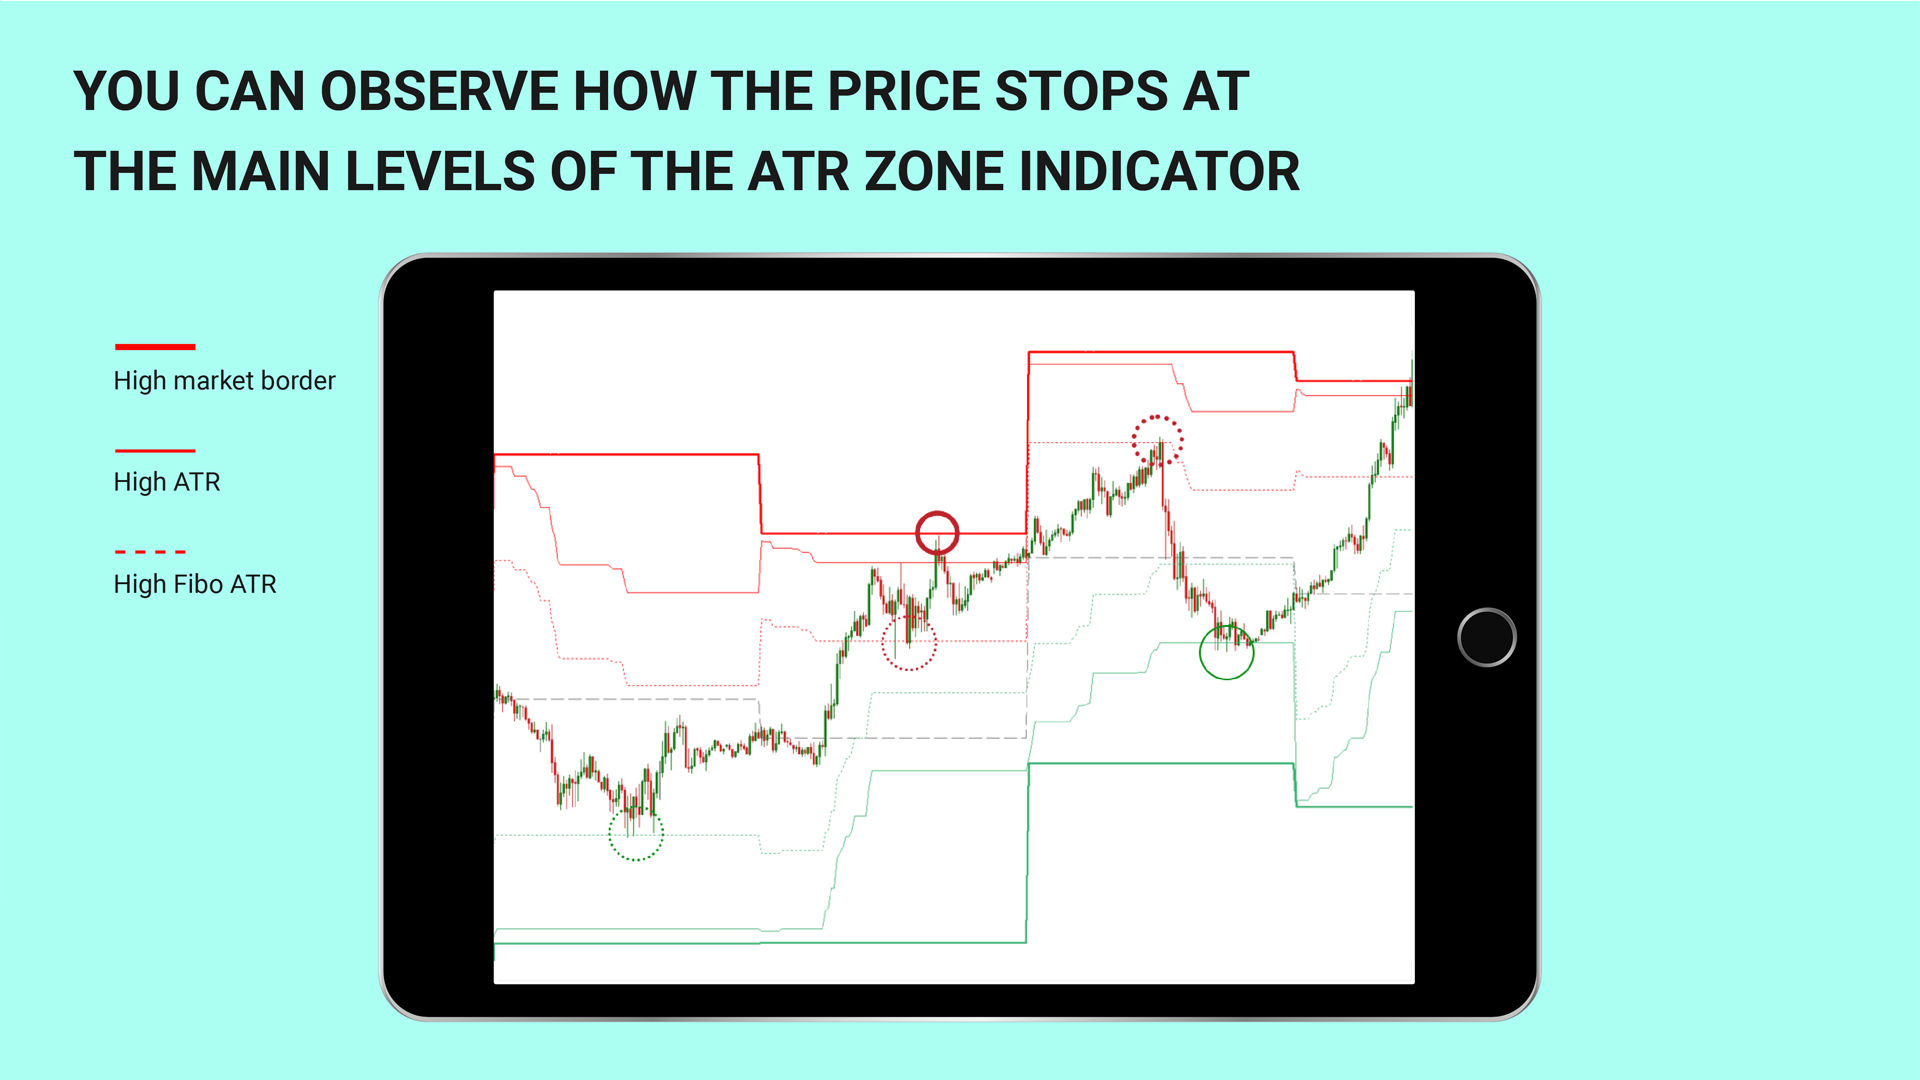
L'indicatore più importante di cui abbiamo bisogno nel trading intraday è il movimento medio del prezzo giornaliero. Conoscendo il movimento medio giornaliero del prezzo, possiamo impostare i limiti (livelli di trading) sul grafico, su cui il mercato perderà energia. Questi livelli sono contrassegnati dall'indicatore ATR Zone con linee rosse e verdi in grassetto.

IMPORTANTE!!! L'indicatore ATR Zone calcola l'intervallo medio giornaliero del movimento del prezzo (conta le candele D1) e costruisce i livelli su un timeframe più piccolo.

Quindi anche sui timeframe M1, M5, M15, H1 si ottengono i livelli dell'intervallo medio giornaliero, che è più informativo durante il trading intraday.

In precedenza ho indicato alcune importanti aggiunte all'indicatore. Il famoso trader Alexander Gerchik raccomanda di utilizzare il valore medio del movimento del prezzo degli ultimi 5 giorni, ma di non prendere in considerazione barre giornaliere estremamente grandi o estremamente piccole. Ho seguito il suo consiglio e ho applicato questa regola all'indicatore ATR Zone.

Parametri dell'indicatore ATR Zone. 

  • The beginning of the day - l'inizio del conto alla rovescia dell'indicatore.

Ritengo che sia sbagliato considerare l'inizio del conto alla rovescia alle ore 00:00 del giorno corrente. È più corretto prendere come punto di partenza l'ora di inizio della sessione di trading in una delle zone di trading. Nel mio trading prendo come punto di partenza l'ora di inizio della sessione di trading europea.

  • ATR averaging period - numero di giorni per calcolare il valore medio del movimento di prezzo giornaliero.
  • Exclude the bar more - il coefficiente delle barre grandi, che esclude le barre troppo grandi dal calcolo del valore medio dell'ATR (il valore 2 significa che le barre che sono più di 2 volte l'ATR medio non prendono in considerazione nei calcoli).
  • Exclude smaller bars - il coefficiente delle barre piccole, che esclude le barre troppo piccole dal calcolo del valore medio dell'ATR (il valore 0,5 significa che le barre inferiori al 50% dell'ATR medio non prendono in considerazione nei calcoli).
  • Fibo level - livello di Fibonacci per la costruzione di livelli aggiuntivi (livelli tratteggiati)
  • The number of bars to calculate - numero di barre a sinistra da visualizzare sul grafico


Sono Sergey Ermolov, iscriviti ai miei aggiornamenti!


Prodotti consigliati
Marker Bands
Ramon Sobrevals Arce
4.5 (2)
This indicator consists in two different algorithms, in order to profit all fast movements created during noises of the market. First of all, it plots normalized trend bands to can filter the possible trades. The normalized trend bands are calcualted using an exclusive mathematical algorithm to has both the correct trend and the fast adaptability to the change of trends. With those bands you can know when you are inside the trend, or when you are outside. The second alhorithm uses a private
Warning: Our product works with 28 symbols. The average accuracy level of the signals is 99%. We see signals below 15 pips as unsuccessful. Technique Signal   indicator is designed for signal trading. This indicator generates trend signals. It uses many algorithms and indicators to generate this signal. It tries to generate a signal from the points with the highest trend potential. This indicator is a complete trading product. This indicator does not need any additional indicators. The
The  Laguerre VIX Trend Extrema   (LVTE)  indicator detects market tops and bottoms. As its name suggests, LVTE is a percentage price oscillator that identifies extreme ranges in market price. How to use:   Buy   when the indicator was in the lower "blue" range for more than 2 candles, and then moves up into grey.   Sell   when the indicator was in the upper "red" range, and then moves down into orange. Please see screenshots for examples! To make it simple, the indicator can show this by paint
Others
Tatiana Savkevych
The Others indicator is a trend-type indicator. In those moments when you need to make a decision to enter a position and give the trader a direction. The indicator gives the trader the opportunity to visually determine which trend will be present at a particular time interval. These are auxiliary tools for technical analysis of the market. Recommended for use in conjunction with any of the oscillators. The main application of the Others indicator is to generate buy and sell signals. Determin
The indicator allows for quick identification of price reversals by promptly reacting to price impulses and indicating the beginning of a price reversal. The histogram demonstrates the direction of movement and identifies favorable moments for opening positions. It is recommended for use in swing trading and can be applied to any currency pairs, metals, and cryptocurrencies. It is also suitable for binary options trading. Key Features Rapidly identifies changes in the local trend Works on all t
The indicator is the advanced form of the MetaTrader 4 standard Fibonacci tool. It is unique and very reasonable for serious Fibonacci traders. Key Features Drawing of Fibonacci retracement and expansion levels in a few seconds by using hotkeys. Auto adjusting of retracement levels once the market makes new highs/lows. Ability to edit/remove any retracement & expansion levels on chart. Auto snap to exact high and low of bars while plotting on chart. Getting very clear charts even though many ret
Indicator for determining adjustments and price reversals It gives signals for inputs and shows the general direction of the price movement. Allows you to conduct trend and counter trend trading It works on all timeframes, on any currency pairs, metals and cryptocurrency Can be used when working with binary options Distinctive features Does not redraw; Thanks to simple settings, you can quickly adapt to any trading instrument; It works on all timeframes and on all symbols; Suitable for trading c
SuperRSI
Andriy Sydoruk
The SuperRSI indicator is an advanced index of internal strength. The indicator shows not the relative strength of the trading instruments being compared, but the internal strength of a single instrument, therefore, it is the “Internal Strength Index”. This is an advanced form of the SuperRSI indicator. It converts the signal so that low-frequency components are delayed much more than high-frequency components. In general, the data of the last bar have more weight than previous data, like an exp
The indicator is the advanced form of the MetaTrader 4 standard Fibonacci tool. It is unique and very reasonable for serious Fibonacci traders. Key Features Drawing of Fibonacci retracement and expansion levels in a few seconds by using hotkeys. Auto adjusting of retracement levels once the market makes new highs/lows. Ability to edit/remove any retracement & expansion levels on chart. Auto snap to exact high and low of bars while plotting on chart. Getting very clear charts even though man
Rsi Regression Channel
Philip Pankaj Suthagar
5 (3)
In statistics, Regression Channel is a approach for modelling the relationship between a scalar response (or dependent variable) and one or more explanatory variables (or independent variables).We Applied relative strength index(rsi) values to develop regression models of various degrees in order to understand relationship between Rsi and price movement.                        Our goal is range prediction and error reduction of Price divergence , thus we use Rsi Regression
Closing Average
Yaroslav Varankin
Closing average This is a completely new indicator in technical analysis. It is based solely on mathematical calculation. about signals It’s worth going into a buy transaction when the price has crossed the indicator line from bottom to top and it is under the price it is worth entering a deal on sell when the price is below the indicator line This author’s development, he doesn’t use any indicators of technical analysis in his analysis.
on free demo press zoom out button to see back.. cnt number is bar numbers.you can change up to 3000 related to chart bars numbers. minimum value is 500. there is g value set to 10000. no need to change it. this indicator almost grail,no repaint and all pairs ,all timeframe indicator. there is red and blue histograms. if gold x sign comes on red histogram that is sell signal. if blue x sign comes on blue histogram that is buy signal. this indicator on thise version works all pairs.al timeframe
LR Candles AM
Andriy Matviyevs'kyy
This indicator displays candle prices on the chart, colored according to the data of a linear regression of various prices (at the user's choice) for a selected period of time. The user has the option to select two different price types and two different time periods. The indicator will display the moments of coincidence of the directions of the linear regression. Usage: After the full formation of a candle colored in the opposite color to the previous candle, place a stop order at the high /
FREE
VWap Bands EForex
Veridiana Adorno Kendrick
VWAP Bands Metatrader 4 Forex Indicator The VWAP Bands Metatrader 4 Forex indicator is a quite similar to the Bollinger bands, but it deploys volume weighted average as the core value of the bands. There is an option of using the tick volume or real volume for calculation when using the VWAP Bands Metatrader 5 custom forex indicator, especially when the forex broker displays symbol alongside real volume. Similarly, you can decide to have deviations calculated with the sample correction or not
XM Channel
Kaijun Wang
4.67 (3)
The market price usually falls between the borders of the channel . If the price is out of range, it is a trading signal or trading opportunity . Basically, Fit Channel can be used to help determine overbought and oversold conditions in the market. When the market price is close to the upper limit, the market is considered overbought (sell zone). Conversely, when the market price is close to the bottom range, the market is considered oversold (buy zone). However, the research can be used
Zig Zag reading structure
Maria Cristina Sabatini
'Zig Zag Percentage strenght'   This indicator is awesome. Why? It's able to show the percentage of the last leg, compared with the previous leg. In this way you have a better understanding of the forces in play in that moment.   In fact, for example, if you see that the up extensions are, in percentage, greater of the down legs, that means that there is more bullish pressure or maybe the market is starting to reverse from downtrend to uptrend.   Hope you will ind it useful !
Scanner and Dashboard for Money Flow Index for MT4 The Money Flow Index (MFI) is a technical oscillator that uses price and volume data for identifying overbought or oversold signals in an asset. It can also be used to spot divergences which warn of a trend change in price. The oscillator moves between 0 and 100. Advantages of the Scanner: - Full Alert Options. - Multi Timefrare  - Works for all instruments including Currencies, Indices, Commodities, Cryptocurrencies and Stocks. - Fully customis
OFFER!   OFFER ! After 3 weeks the unlimited price will be 500$ and in the future you will regret why you didn't make a purchase at this lowest price. Dear Traders, the atomic power Entries Indicator is one of the indicators that if used wisely and correctly can help you to find an edge over the market.  The indicator will work for all forex pairs, all markets and all timeframes. Still it is your duty to find the most effective timeframe for you. When the sell or buy arrow appears you will get a
Colored Volume
Seyed Ali Tabatabaei Lotfi
The Colored Volume is a simple, yet useful indicator that paints the color of the volume based on the price direction.  If the price has increased, the volume will be shown in green. If the price has decreased, the volume will be shown in red. This indicator will make it super easy for traders to track volume bars based on price movements. (The settings of the volume bars including line width and color can be manually changed by the trader.)
Volume Zone is a unique indicator that uses special algorithm to determine the volumes traded for the period. There are two features of the indicator, the volumes price and and volumes zone. The volume price give the level at the buyers and sells entered the market. The zones also serve a good support/resistance and also site for demand/supply areas. The indicator was mainly designed to trade GBPUSD but also be applied on other pairs. The indicator can used by both beginners and advance trades.
Valable ZigZag
Sergey Ermolov
4.67 (9)
Versione MT5 | Indicatore Trend Monitor VZ  |  Indicatore Owl Smart Levels   |  Strategia Owl Smart Levels  |  FAQ La teoria delle onde di Elliott   è un'interpretazione dei processi nei mercati finanziari che si basa su un modello visivo delle onde nei grafici dei Prezzi.   L'indicatore ZigZag Valable   mostra la struttura delle onde del mercato su cui puoi fare affidamento per prendere decisioni di trading. L'indicatore ZigZag Valable è più stabile e spesso non cambia direzione come il classi
FREE
norepaint buy sell indicator is norepaint indicator.and works all pairs and all timeframes. Indicator hold too long way to signals. And show major and minor cycles.and gives signals Minor cycles are indicating with x signs. Major cycles are indicating big arrows. So 5m chart and 15m chart more suitable For major cycles, 1 h and 4h chart suitable for minor cycles. using is wery simple ,it puts arrow on price probably buy sell arrows. thise indicator is suitable for beginner and experienced trader
The Best Choice compra y venta
Sandro Israel Hernandez Zamora
¿Has escuchado decir que la tendencia es tu amiga? pues nada es mas cierto en el mundo del trading. Este indicador analiza las tendencias y su fuerza para que puedas aprovecharlas y utilizamos un conjunto de indicadores como RSI, %W, MACD y EMAS para analizar el mercado y sus movimientos, por lo que podrás mantener tu gráfico limpio sabiendo que todos estos indicadores los tienes en uno solo. Este, como cualquier indicador, no representa una certeza de compra o venta definitiva, por lo siempre r
-   Real price is 70$   - 50% Discount ( It is 35$ now ) Contact me for instruction, any questions! Introduction The Elliott Wave in technical analysis describes price movements in the financial market that are related to changes in trader sentiment and psychology. The 5 W Pattern (Known as 3 Drives) is an Elliott Wave pattern that is formed by 5 consecutive symmetrical moves up or down. In its bullish form, the market is making 5 drives to a bottom before an uptrend forms. In a bearish 5-dri
No idea why demo is not working. you can check the GIF to see how it works. Features With this scanner you can detect Candles which are below/above yesterday high/low lines. A pair's rectangle turns RED in dashboard if it is above the yesterday high, and rectangle turns GREEN in dashboard if it is below the yesterday low. It gives alerts in every 15m candle close. Contains a Dashboard which will help you to see all market pair's. It is possible to disable this sorting through to make it easie
Max Min logic formula
Maria Cristina Sabatini
Innovative Max Min swing   This is a really different indicator for drawing Max and Min on the charts.  This indicator draws Min and Max levels in a innovative way, based on a volatility proprietary calculation. In this way you will be able to draw trendlines in an objective way and also to see the break of Max and Min levels.  You have three paramaters you can play with, in order to suite the volatility to your trading style. The indicator works on every time frame. Added: - Sound Notification
Gunn Crosses   Support and resistance levels indicator. The levels are calculated according to the diagonal and cardinal cross of the Gann square. The calculation is performed relative to the current price or relative to the price specified by the user in the Price setting. Also, in the calculation, you can use a part of the pricing using the Digit and minus_znak settings. For example: the current price looks like - 1.23456, and the   Digit setting is set to _5____, so the calculation will
Indicators 14 in 1
Makarii Gubaydullin
5 (1)
14 Indicators and auxiliary tools for convenient trading This utility contains 14 additional tools that can be useful for certain actions of the trader,   thereby simplifying and speeding up the trading process. My   #1 Utility : includes 65+ functions  |   Contact me  if you have any questions Due to the different monitor resolutions, some users may encounter the fact that the labels will be displayed with an overlay or be too small. If you encounter such a problem, you can adjust the font size
buy sell star indicator has a different algoritms then up down v6 and buy sell histogram indicators. so that i put this a another indicator on market. it is no repaint and all pairs and all time frame indicator. it need minimum 500 bars on charts. when  the white  x sign on the red histogram that is sell signals. when the white x sign on the blue  histogram that is sell signals. this indicator does not guarantie the win.price can make mowement on direction opposite the signals. this is multi tim
The Arrow Scalper
Fawwaz Abdulmantaser Salim Albaker
1 (2)
Dear Friend..  I share with you this simple Expert Adviser .. it is full automatic  this Expert Adviser following the trend of the pair you install on or any stocks or indices , it is works like that: - when the trend on H4 chart show a start of up trend the expert will wait till the 15M & 1H charts show an up trend the EA will open a buy order directly , and do the same for down trend and open a sell order the buy or sell  order lot size and take profit and stop loss will measured manually  by
FREE
Gli utenti di questo prodotto hanno anche acquistato
Trend Pulse
Mohamed Hassan
5 (4)
Please contact me after purchase to immediately get your PDF strategy + documentation for Trend Pulse !  Official release price of $99  ( 3 /50 copies left). Next price is $199 . Introducing Trend Pulse , a unique and robust indicator capable of detecting bullish, bearish, and even ranging trends! Trend Pulse uses a special algorithm to filter out market noise with real precision. If the current symbol is moving sideways, Trend Pulse will send you a ranging signal, letting you know that it
Scalper Inside PRO
Alexey Minkov
4.75 (60)
An exclusive indicator that utilizes an innovative algorithm to swiftly and accurately determine the market trend. The indicator automatically calculates opening, closing, and profit levels, providing detailed trading statistics. With these features, you can choose the most appropriate trading instrument for the current market conditions. Additionally, you can easily integrate your own arrow indicators into Scalper Inside Pro to quickly evaluate their statistics and profitability. Scalper Inside
Atomic Analyst
Issam Kassas
5 (3)
Innanzitutto, vale la pena sottolineare che questo indicatore di trading non è repaint, non è ridisegno e non presenta ritardi, il che lo rende ideale sia per il trading manuale che per quello automatico. Manuale utente: impostazioni, input e strategia. L'Analista Atomico è un indicatore di azione del prezzo PA che utilizza la forza e il momentum del prezzo per trovare un miglior vantaggio sul mercato. Dotato di filtri avanzati che aiutano a rimuovere rumori e segnali falsi, e aumentare il pote
ATTUALMENTE SCONTATO DEL 26% La soluzione migliore per ogni principiante o trader esperto! Questo indicatore è uno strumento di trading unico, di alta qualità e conveniente perché abbiamo incorporato una serie di caratteristiche proprietarie e una nuova formula. Con un solo grafico è possibile leggere la forza delle valute per 28 coppie Forex! Immaginate come migliorerà il vostro trading perché sarete in grado di individuare l'esatto punto di innesco di una nuova tendenza o di un'opportunit
FX Power MT4 NG
Daniel Stein
5 (12)
Ricevi il tuo aggiornamento quotidiano sul mercato con dettagli e schermate tramite il nostro Morning Briefing qui su mql5 e su Telegram ! FX Power MT4 NG è la nuova generazione del nostro popolare misuratore di forza delle valute, FX Power. Cosa offre questo misuratore di forza di nuova generazione? Tutto ciò che avete amato dell'FX Power originale IN PIÙ Analisi della forza di ORO/XAU Risultati di calcolo ancora più precisi Periodi di analisi configurabili individualmente Limite di calcolo pe
Advanced Currency IMPULSE with ALERT
Bernhard Schweigert
4.91 (495)
ATTUALMENTE SCONTATO DEL 31%! La soluzione migliore per ogni principiante o trader esperto! Questo indicatore è uno strumento di trading unico, di alta qualità e conveniente perché abbiamo incorporato una serie di caratteristiche proprietarie e una formula segreta. Con un solo grafico fornisce avvisi per tutte le 28 coppie di valute. Immaginate come migliorerà il vostro trading perché sarete in grado di individuare l'esatto punto di innesco di una nuova tendenza o opportunità di scalping!
Attualmente 20% di sconto! La soluzione migliore per ogni principiante o trader esperto! Questo software per cruscotti funziona su 28 coppie di valute. Si basa su 2 dei nostri indicatori principali (Advanced Currency Strength 28 e Advanced Currency Impulse). Offre un'ottima panoramica dell'intero mercato Forex. Mostra i valori di forza delle valute avanzate, la velocità di movimento delle valute e i segnali per 28 coppie Forex in tutti i (9) timeframe. Immaginate come migliorerà il vostro t
Order Block Hunter
Noha Mohamed Fathy Younes Badr
5 (1)
Order block hunter indicator is the best indicator for  hunt the order blocks that area where there has been a large concentration of limit orders waiting to be executed Order blocks are identified on a chart by observing previous price action and looking for areas where the price experienced significant movement or sudden changes in direction .This indicator does that for you by using very complicated codes and helps you to take the best areas To buy and sell because it make marks at the best a
Enigmera
Ivan Stefanov
5 (4)
ENIGMERA: Il cuore del mercato https://www.enigmera.com Introduzione Questo indicatore e sistema di trading rappresenta un approccio straordinario ai mercati finanziari. ENIGMERA utilizza i cicli frattali per calcolare con precisione i livelli di supporto e resistenza. Mostra l'autentica fase di accumulazione e fornisce direzione e obiettivi.  Un sistema che funziona sia in un trend che in una correzione.  Come funziona? ENIGMERA è composto da tre linee: la linea di supporto/resistenza, la
Gold Channel is a volatility-based indicator, developed with a specific timing algorithm for the XAUUSD pair, which consists of finding possible corrections in the market. This indicator shows two outer lines, an inner line (retracement line) and an arrow sign, where the theory of the channel is to help identify overbought and oversold conditions in the market. The market price will generally fall between the boundaries of the channel. If prices touch or move outside the channel it is a tra
Automated Trendlines
Georgios Kalomoiropoulos
5 (17)
Le linee di tendenza sono lo strumento più essenziale di analisi tecnica nel forex trading. Sfortunatamente, la maggior parte dei trader non li disegna correttamente. L'indicatore automatizzato delle linee di tendenza è uno strumento professionale per i trader seri che ti aiuta a visualizzare il movimento di tendenza dei mercati. Esistono due tipi di linee di tendenza, linee di tendenza rialziste e linee di tendenza ribassiste. Nella tendenza rialzista, la linea di tendenza Forex viene t
Advanced Supply Demand
Bernhard Schweigert
4.9 (314)
CURRENTLY 26% OFF !! Best Solution for any Newbie or Expert Trader! This indicator is a unique, high quality and affordable trading tool because we have incorporated a number of proprietary features and a new formula. With this update, you will be able to show double timeframe zones. You will not only be able to show a higher TF but to show both, the chart TF, PLUS the higher TF: SHOWING NESTED ZONES. All Supply Demand traders will love it. :) Important Information Revealed Maximize the potenti
SI PREGA DI LEGGERE LE INFORMAZIONI QUI SOTTO PRIMA DI ACQUISTARE IL PRODOTTO! Apollo Pips PLUS SP è un prodotto unico! È PER CHI VUOLE OTTENERE IL MIO NUOVO INDICATORE "APOLLO PIPS" PIÙ IL BONUS "SUPER PACK" CON ACCESSO A TUTTI I MIEI INDICATORI DI TRADING! Acquistando il prodotto Apollo Pips PLUS SP stai effettivamente acquistando una versione assolutamente nuova del mio indicatore Apollo Pips. Questa versione dell'indicatore ha un algoritmo migliorato e un parametro facile da usare che ti dà
PZ Day Trading
PZ TRADING SLU
3.67 (3)
Effortless trading: non-repainting indicator for accurate price reversals Special Offer: Purchase now to receive free bonuses worth $189! (Read more for details) This indicator detects price reversals in a zig-zag fashion, using only price action analysis and a donchian channel. It has been specifically designed for short-term trading, without repainting or backpainting at all. It is a fantastic tool for shrewd traders aiming to increase the timing of their operations. [ Installation Guide | Up
TPSpro RFI Levels
Roman Podpora
4.83 (24)
Reversal First Impulse levels (RFI)    INSTRUCTIONS        RUS       -       ENG              R ecommended to use with an indicator   -   TPSpro  TREND PRO -  Version MT5 A key element in trading is zones or levels from which decisions to buy or sell a trading instrument are made. Despite attempts by major players to conceal their presence in the market, they inevitably leave traces. Our task was to learn how to identify these traces and interpret them correctly. Main functions: Displaying activ
PZ Mean Reversion MT4
PZ TRADING SLU
2.33 (3)
Indicatore unico che implementa un approccio professionale e quantitativo al trading di reversione. Sfrutta il fatto che il prezzo devia e ritorna alla media in modo prevedibile e misurabile, il che consente regole di entrata e uscita chiare che superano di gran lunga le strategie di trading non quantitative. [ Installation Guide | Update Guide | Troubleshooting | FAQ | All Products ] Segnali di trading chiari Incredibilmente facile da scambiare Colori e dimensioni personalizzabili Implementa
GOLD Impulse with Alert
Bernhard Schweigert
4.56 (9)
Questo indicatore è una super combinazione dei nostri 2 prodotti Advanced Currency IMPULSE with ALERT  +   Currency Strength Exotics . Funziona per tutti i time frame e mostra graficamente l'impulso di forza o debolezza per le 8 valute principali più un simbolo! Questo indicatore è specializzato nel mostrare l'accelerazione della forza delle valute per qualsiasi simbolo come oro, coppie esotiche, materie prime, indici o futures. Primo nel suo genere, qualsiasi simbolo può essere aggiunto
PRO Renko System
Oleg Rodin
5 (25)
PRO Renko System è un sistema di trading altamente accurato appositamente progettato per il trading di grafici RENKO. Questo è un sistema universale che può essere applicato a vari strumenti di trading. Il sistema neutralizza efficacemente il cosiddetto rumore di mercato che consente di accedere a segnali di inversione accurati. L'indicatore è molto facile da usare e ha un solo parametro responsabile della generazione del segnale. Puoi facilmente adattare lo strumento a qualsiasi strumento
TakePropips Donchian Trend Pro
Eric John Pajarillaga Aldana
4.61 (18)
TakePropips Donchian Trend Pro   (MT4) è uno strumento potente ed efficace che rileva automaticamente la direzione del trend utilizzando il canale Donchian e ti fornisce segnali di trading di entrata e uscita! Questo indicatore multifunzione include uno scanner di tendenza, segnali di trading, pannello statistico, screener, sessioni di trading e dashboard della cronologia degli avvisi. È progettato per fornirti segnali di trading e farti risparmiare ore analizzando i grafici! È possibile scarica
AVVISO DI ACQUISTO E VENDITA MULTIVALUTA e MULTITIMEFRAME. AUTO TAILING STOP E RISCHIO PREMIO TAKEPROFIT! L'INDICATORE SCANSIONA E ANALIZZA IL MERCATO COSÌ NON HAI NULLA DA FARE! SCAMBIA TUTTE LE TUE VALUTE SU 1 TABELLA!   Dopo l'acquisto lascia un commento contattami e ti invierò l'assistente commerciale EA. L'indicatore utilizza diversi oscillatori e filtri allegati per trovare i migliori punti di ingresso CONFERMATI, quindi non devi preoccuparti di questo! Ti avviserà e disegnerà un pu
This product is based on the methodologies of Gann, his follower Don E. Hall. The Indicator builds a working view grid, which is used to analyze graphics. The Pyrapoint tool, developed by Don Hall, is a grid based on the Pythagorean cube. In his calculations he uses the Gann Square 9 methodology and the relationship between Price and Time. This tool is used to predict changes in trend and overall market actions. More information about the method   HERE
Best Currency Strength Indicator
Tumelo Patrick Rakotsoane
4.6 (48)
Advanced Currency Strength Indicator The Advanced Divergence Currency Strength Indicator. Not only it breaks down all 28 forex currency pairs and calculates the strength of individual currencies across all timeframes , but, You'll be analyzing the WHOLE forex market in 1 window (In just 1 minute) . This indicator is very powerful because it reveals the true movements of the market.  It is highly recommended to  analyze charts knowing the performance of individual currencies or the countries ec
TPSproTREND PrO
Roman Podpora
4.78 (18)
TPSpro TRENDPRO  - is a trend indicator that automatically analyzes the market and provides information about the trend and each of its changes, as well as giving signals for entering trades without redrawing! The indicator uses each candle, analyzing them separately. referring to different impulses - up or down impulse. Exact entry points into transactions for currencies, crypto, metals, stocks, indices!  Version MT5             DETAILED DESCRIPTION              R ecommended to use with an indi
XQ Indicator MetaTrader 4
Marzena Maria Szmit
3.67 (3)
Step into the realm of Forex trading with confidence and precision using XQ, a cutting-edge Forex indicator designed to elevate your trading game to unprecedented heights. Whether you're a seasoned trader or just stepping into the world of currency exchange,   XQ Forex Indicator   empowers you with the insights and signals needed to make informed trading decisions. The signal conditions are a combination of three indicators, and XQ Forex Indicator only display  medium and long-term trends . The
Entry Points Pro
Yury Orlov
4.7 (226)
Indicatore top per MT5 che fornisce segnali accurati per entrare in un trade senza riverniciare! Può essere applicato a qualsiasi attività finanziaria: forex, criptovalute, metalli, azioni, indici.  La versione MT5 è qui Fornirà segnali di trading piuttosto precisi e ti dirà quando è meglio aprire un trade e chiuderlo. Guarda il video (6:22) con un esempio di elaborazione di un solo segnale che ha ripagato l'indicatore! La maggior parte dei trader migliora i propri risultati di trading
Max Paynex
Abdulkarim Karazon
Max Payne è un indicatore di segnale di inversione/tendenza che fornisce segnali sotto forma di freccia, questo indicatore fornisce il suo segnale sulla stessa barra di chiusura, questo indicatore può cadere più volte sul grafico con periodi diversi per ottenere una doppia/tripla conferma dei segnali l'indicatore è altamente regolabile per adattarsi a qualsiasi stile di trading mentre non viene mai ridipinto o ridipinto, otterrai il sistema completo mostrato negli screenshot dopo l'acquisto ins
Backtest and Read Overview before purchase. Chart patterns have been a topic of debate among traders; some believe they are reliable signalers, while others do not. Our Chart Patterns All-in-One indicator displays various chart patterns to help you test these theories for yourself. The profitability of these patterns is not a reflection of the indicator's effectiveness but rather an evaluation of the patterns themselves. The Chart Patterns All-in-One indicator is an excellent tool for visualizin
RelicusRoad Pro
Relicus LLC
4.73 (141)
Ora $ 147 (aumentando a $ 499 dopo alcuni aggiornamenti) - account illimitati (PC o MAC) Manuale utente di RelicusRoad + Video di formazione + Accesso al gruppo Discord privato + Stato VIP UN NUOVO MODO DI GUARDARE IL MERCATO RelicusRoad è l'indicatore di trading più potente al mondo per forex, futures, criptovalute, azioni e indici, fornendo ai trader tutte le informazioni e gli strumenti di cui hanno bisogno per rimanere redditizi. Forniamo analisi tecniche e piani di trading per aiuta
Quantum Currency Array Indicator
QUANTUM TRADING SOFTWARE LIMITED
This indicator has been developed to identify and display these trends quickly and easily, allowing you to see instantly, those currency pairs which are trending, and those which are not – and in all timeframes, with just one click. The 28 currency pairs are displayed as a fan as they sweep from strong to weak and back again, and this is why we call it the ‘currency array’. All 28 pairs are arrayed before you, giving an instant visual description of those pairs that are trending strongly, those
JULY OFFER 80% OFF next price for unlimited version will be 17000$. This is the only time you can get this institutional and professional indicator at this price for unlimited version. Don't dare to miss this. The tool I am about to introduce to you you can't compare it with other tools due to its strategy and accuracy level in predicting the next price directional movement . This tool is designed for serious traders who have decided to make a difference through trading. Be the next person to wi
Altri dall’autore
Universal Breakout MT5
Sergey Ermolov
4.28 (43)
Impostazioni  |  Versione MT4  |  Indicatore di sessione di trading Universal Box   |   FAQ Universal Breakout  questo è un consulente commerciale sulla classica strategia di ripartizione della fascia di prezzo. Può essere configurato per qualsiasi strategia che implichi l'uscita del prezzo dal corridoio dei prezzi, che è specificato da un intervallo di tempo. Ad esempio: una ripartizione degli estremi delle sessioni di trading asiatiche, europee o Americane, una ripartizione degli estremi gior
FREE
Prop Master MT4
Sergey Ermolov
5 (1)
Prop Master   Expert Advisor funziona secondo la strategia classica e segue tutte le regole fissate da   Prop   firms per i loro clienti. L'Expert Advisor può essere negoziato sia sui conti finanziati di Prop firms sia sui vostri conti personali. Non ci sono restrizioni sul tipo di conto di trading. Guardate il segnale live di Prop Master:  https://www.mql5.com/it/signals/2216370 Come testare l'Expert Advisor? È importante che l'Expert Advisor funzioni nel fuso orario corretto, pertanto prima di
Prop Master MT5
Sergey Ermolov
5 (1)
Prop Master   Expert Advisor funziona secondo la strategia classica e segue tutte le regole fissate da   Prop   firms per i loro clienti. L'Expert Advisor può essere negoziato sia sui conti finanziati di Prop firms sia sui vostri conti personali. Non ci sono restrizioni sul tipo di conto di trading. Guardate il segnale live di Prop Master:  https://www.mql5.com/it/signals/2216370 Come testare l'Expert Advisor? È importante che l'Expert Advisor funzioni nel fuso orario corretto, pertanto prima di
MiloBot PRO MT5
Sergey Ermolov
5 (4)
Backtest dal 2015 | Versione MT4  |  FAQ MiloBot PRO   è un Forex Expert Advisor basato sulla   strategia dell'autore , sviluppata, testata e ottimizzata per oltre 2 anni. I conti reali dello sviluppatore possono essere considerati un indicatore dell'affidabilità della strategia. I loro   depositi   superano i 100.000 dollari . La strategia algoritmica   avanzata di MiloBot PRO consente di   ottenere un profitto stabile   ogni mese. Inoltre,   gli indicatori personalizzati consentono agli EA di
Valable ZigZag MT5
Sergey Ermolov
4.79 (19)
Versione MT4  | Indicatore Trend Monitor VZ  |   Indicatore Owl Smart Levels   |  Strategia Owl Smart Levels  |  FAQ La teoria delle onde di Elliott è un'interpretazione dei processi nei mercati finanziari che si basa su un modello visivo delle onde nei grafici dei Prezzi. L'indicatore ZigZag Valable mostra la struttura delle onde del mercato su cui puoi fare affidamento per prendere decisioni di trading. L'indicatore ZigZag Valable è più stabile e spesso non cambia direzione come il classico i
FREE
Full Fractals MT5
Sergey Ermolov
4.75 (16)
MT4 version  |   Indicatore Owl Smart Levels   |  Strategia Owl Smart Levels  |  FAQ L'indicatore Fractals   è uno degli elementi della strategia di trading dell'autore di   Bill Williams . Viene utilizzato per cercare i punti di inversione del prezzo sul grafico dei prezzi e, di conseguenza, i livelli di supporto e resistenza. L'indicatore Full Fractals   è un Fractals migliorato che è disponibile nel toolkit di quasi tutti i terminali di trading. La sua unica differenza è che per costruire
FREE
Grid Hlevel MT5
Sergey Ermolov
4.63 (32)
Versione MT4  |   Indicatore Valable ZigZag   |   FAQ L'Expert Advisor   Grid HLevel   è perfetto per i trader che vogliono ottenere un profitto stabile sul mercato Forex ogni mese. L'Expert Advisor funziona secondo la strategia di mediazione e vi consiglio di usarla correttamente. Usarla "correttamente" significa aprire operazioni di mediazione nei punti di inversione del mercato e operare solo nella direzione di un trend globale. Per quanto riguarda la direzione del trend principale, suggeris
FREE
Full Fractals
Sergey Ermolov
4.88 (17)
MT5 version  |   Indicatore Owl Smart Levels  |  Strategia Owl Smart Levels  |  FAQ L'indicatore Fractals è uno degli elementi della strategia di trading dell'autore di Bill Williams . Viene utilizzato per cercare i punti di inversione del prezzo sul grafico dei prezzi e, di conseguenza, i livelli di supporto e resistenza. L'indicatore Full Fractals è un Fractals migliorato che è disponibile nel toolkit di quasi tutti i terminali di trading. La sua unica differenza è che per costruire un fratta
FREE
Universal Breakout
Sergey Ermolov
4.61 (38)
Impostazioni  |  Versione MT5  |  Indicatore di sessione di trading Universal Box |  FAQ Universal Breakout  questo è un consulente commerciale sulla classica strategia di ripartizione della fascia di prezzo. Può essere configurato per qualsiasi strategia che implichi l'uscita del prezzo dal corridoio dei prezzi, che è specificato da un intervallo di tempo.   Ad esempio: una ripartizione degli estremi delle sessioni di trading asiatiche, europee o Americane, una ripartizione degli estremi giorn
FREE
Universal Box MT5
Sergey Ermolov
4.8 (10)
Versione MT4   |  FAQ   |   EA Universal Breakout   Universal Box   traccia sul grafico   gli intervalli di prezzo   che possono essere utilizzati in seguito per fare trading sul breakout di un intervallo di prezzo. Sono molte le strategie che si possono applicare a questo indicatore. L'indicatore è impostato di default per segnare sul grafico gli intervalli delle   sessioni di trading Asiatica, Europea e Americana . Gli intervalli sono tracciati come rettangoli, i cui confini sono l'ora di ini
FREE
Shuttle Runner
Sergey Ermolov
4.19 (21)
La strategia swing è la base del consulente Shuttle Runner . La strategia è stata descritta nel lontano 2009 ed è stata attivamente utilizzata dai trader nel mercato Forex. Shuttle runner è una versione migliorata e migliorata di questa strategia . Chat su Telegram: @it_trader_chat Il nuovo Expert Advisor Prop Master   - provatelo nel vostro terminale di trading https://www.mql5.com/it/market/product/115375 L'essenza principale della strategia è la seguente: Il trading di questo consulente è 
FREE
Valable ZigZag
Sergey Ermolov
4.67 (9)
Versione MT5 | Indicatore Trend Monitor VZ  |  Indicatore Owl Smart Levels   |  Strategia Owl Smart Levels  |  FAQ La teoria delle onde di Elliott   è un'interpretazione dei processi nei mercati finanziari che si basa su un modello visivo delle onde nei grafici dei Prezzi.   L'indicatore ZigZag Valable   mostra la struttura delle onde del mercato su cui puoi fare affidamento per prendere decisioni di trading. L'indicatore ZigZag Valable è più stabile e spesso non cambia direzione come il classi
FREE
Grid HLevel
Sergey Ermolov
4.52 (29)
Versione MT5  |   Indicatore Valable ZigZag   |   FAQ L'Expert Advisor Grid HLevel è perfetto per i trader che vogliono ottenere un profitto stabile sul mercato Forex ogni mese. L'Expert Advisor funziona secondo la strategia di mediazione e vi consiglio di usarla correttamente. Usarla "correttamente" significa aprire operazioni di mediazione nei punti di inversione del mercato e operare solo nella direzione di un trend globale. Per quanto riguarda la direzione del trend principale, suggerisco d
FREE
Owl Smart Levels MT5
Sergey Ermolov
4.31 (39)
Versione MT4  |  FAQ L' indicatore Owl Smart Levels è un sistema di trading completo all'interno dell'unico indicatore che include strumenti di analisi di mercato popolari come i frattali avanzati di Bill Williams , Valable ZigZag che costruisce la corretta struttura a onde del mercato, e i livelli di Fibonacci che segnano i livelli esatti di entrata nel mercato e luoghi per prendere profitti. Descrizione dettagliata della strategia Istruzioni per lavorare con l'indicatore Consulente-assistente
Universal Box
Sergey Ermolov
5 (2)
Versione MT5   |  FAQ   |   EA Universal Breakout   Universal Box traccia sul grafico gli intervalli di prezzo che possono essere utilizzati in seguito per fare trading sul breakout di un intervallo di prezzo. Sono molte le strategie che si possono applicare a questo indicatore. L'indicatore è impostato di default per segnare sul grafico gli intervalli delle sessioni di trading Asiatica, Europea e Americana . Gli intervalli sono tracciati come rettangoli, i cui confini sono l'ora di inizio e di
FREE
Babylon
Sergey Ermolov
Babylon Expert Advisor opera sui livelli di supporto e resistenza. I livelli di supporto e resistenza sono determinati sulla base di un algoritmo genetico basato sull'intelligenza artificiale. Ciò consente di aprire i trade non solo sui livelli già visibili nella storia, ma anche sui livelli previsti che potrebbero essere formati in futuro. Inoltre, il trading solo nella direzione del trend aumenta l'affidabilità e riduce al minimo i possibili drawdown.  Dopo l'acquisto, scrivetemi un messaggio
Babylon MT5
Sergey Ermolov
Babylon Expert Advisor   opera sui livelli di supporto e resistenza. I livelli di supporto e resistenza sono determinati sulla base di un algoritmo genetico basato sull'intelligenza artificiale. Ciò consente di aprire i trade non solo sui livelli già visibili nella storia, ma anche sui livelli previsti che potrebbero essere formati in futuro. Inoltre, il trading solo nella direzione del trend aumenta l'affidabilità e riduce al minimo i possibili drawdown.  Dopo l'acquisto, scrivetemi un messaggi
Molecule AI
Sergey Ermolov
3.88 (8)
Rapporti V4 dal 2010 |  Versione MT5  |   FAQ !!! NUOVA VERSIONE V4 - DEL 23/09/2023!!! Aggiunto un nuovo algoritmo più stabile (vedere di seguito per i dettagli). IMPOSTARE CORRETTAMENTE PRIMA DI TESTARE È importante che l'Expert Advisor funzioni nel fuso orario corretto, pertanto prima di effettuare il test è necessario impostare correttamente il parametro GMT. Come impostare correttamente il parametro GMT? L'impostazione deve essere effettuata nel momento in cui il mercato è aperto e i tick
Safety
Sergey Ermolov
4.67 (3)
Penso che tutti conoscano una regola di gestione del denaro come "Sicuro". Per coloro che non lo sanno, safe comporta la chiusura di metà della posizione dopo che i profitti dell'operazione sono stati livellati alla dimensione del piede. Quindi, anche se il prezzo si gira e si blocca, non perderai più denaro, perché esattamente lo stesso margine di profitto è stato ottenuto quando una parte della posizione è stata chiusa in precedenza. Safety Advisor ha solo un'impostazione: il lotto di chius
FREE
ATR Zone MT5
Sergey Ermolov
ATR è un indicatore importante per qualsiasi mercato finanziario. L'abbreviazione ATR corrisponde all'acronimo di Average True Range. Questo indicatore è uno strumento per determinare la volatilità del mercato, questo è il suo ruolo diretto. ATR mostra il movimento medio del prezzo per il periodo di tempo selezionato. Il prezzo iniziale dell'indicatore è 63$. Il prezzo aumenterà ogni 10 vendite   fino a 179$ . L'indicatore ATR originale è presente in molti programmi di trading. L'indicatore ATR
Owl smart levels
Sergey Ermolov
4.58 (55)
Versione MT5  |  FAQ L' indicatore Owl Smart Levels   è un sistema di trading completo all'interno dell'unico indicatore che include strumenti di analisi di mercato popolari come i   frattali avanzati di Bill Williams , Valable ZigZag che costruisce   la corretta struttura a onde   del mercato, e i   livelli di Fibonacci che segnano i livelli esatti di entrata nel mercato e luoghi per prendere profitti. Descrizione dettagliata della strategia Istruzioni per lavorare con l'indicatore Consulente-
MiloBot PRO
Sergey Ermolov
5 (3)
Backtest dal 2015 |  Versione MT5  |   FAQ MiloBot PRO è un Forex Expert Advisor basato sulla strategia dell'autore , sviluppata, testata e ottimizzata per oltre 2 anni. I conti reali dello sviluppatore possono essere considerati un indicatore dell'affidabilità della strategia. I loro depositi superano i 100.000 dollari . La strategia algoritmica avanzata di MiloBot PRO consente di ottenere un profitto stabile ogni mese. Inoltre, gli indicatori personalizzati consentono agli EA di entrare nel m
Trend Monitor VZ
Sergey Ermolov
3.67 (3)
Versione MT5   | Indicatore Valable ZigZag |  FAQ La teoria delle onde di Elliott è un'interpretazione dei processi dei mercati finanziari che si basa sul modello visivo delle onde sui grafici dei prezzi. Secondo questa teoria, possiamo sapere esattamente quale tendenza sta prevalendo sul mercato, ascendente o discendente. L'indicatore Valable ZigZag mostra la struttura a onde del mercato e indica la direzione del trend principale al momento sul timeframe corrente. Per comodità, l'indicatore Tr
Trend Monitor VZ MT5
Sergey Ermolov
5 (1)
Versione MT4   |   Indicatore Valable ZigZag   |  FAQ La teoria delle onde di Elliott   è un'interpretazione dei processi dei mercati finanziari che si basa sul modello visivo delle onde sui grafici dei prezzi. Secondo questa teoria, possiamo sapere esattamente quale tendenza sta prevalendo sul mercato, ascendente o discendente .   L'indicatore Valable ZigZag   mostra   la struttura a onde del mercato   e indica la direzione del trend principale al momento sul timeframe corrente. Per comodità,
Molecule AI MT5
Sergey Ermolov
2.43 (7)
Rapporti V4 dal 2010  |  Versione MT4  |   FAQ !!! NUOVA VERSIONE V4 - DEL 23/09/2023!!!   Aggiunto un nuovo algoritmo più stabile (vedere di seguito per i dettagli). IMPOSTARE CORRETTAMENTE PRIMA DI TESTARE È importante che l'Expert Advisor funzioni nel fuso orario corretto, pertanto prima di effettuare il test è necessario impostare correttamente il parametro GMT. Come impostare correttamente il parametro GMT? L'impostazione deve essere effettuata nel momento in cui il mercato è aperto e i t
Filtro:
Nessuna recensione
Rispondi alla recensione