Scalper Terminal X30
- Indicadores
- Kenan Ozkarakas
- Versión: 1.0
- Activaciones: 7
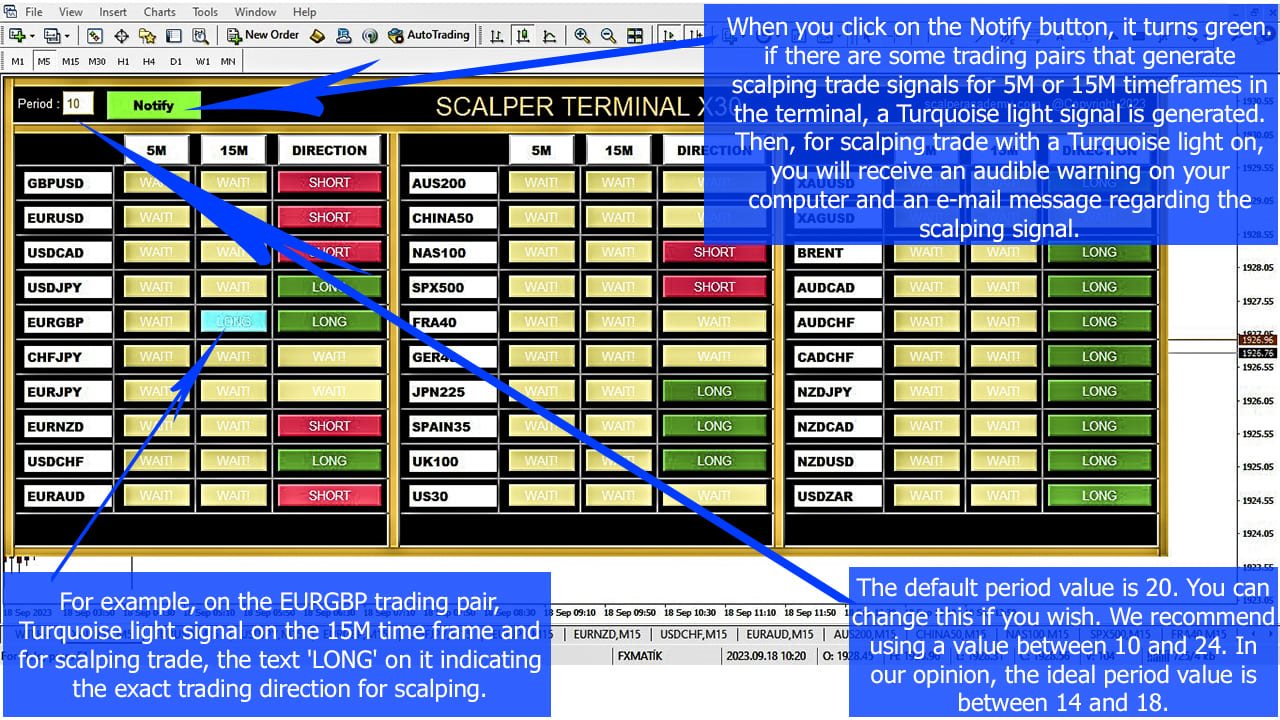
El software de interfaz Scalper Terminal es un indicador, no participa en transacciones automáticas de compra-venta. Este indicador muestra la zona comercial actual donde se pueden ingresar transacciones cuando ocurre una oportunidad comercial de especulación. Cuando hay una señal de especulación, en el lado derecho del par comercial correspondiente, se enciende la luz turquesa y encima se escribe la dirección comercial exacta. Después de eso, haga clic en el botón Turquesa para ingresar a la transacción. Se abre una nueva pestaña. Posteriormente se esperan cierres de velas, que es una condición para entrar en el comercio de especulación.
Para realizar transacciones comerciales de especulación exitosas con Scalper Terminal;
- Asegúrate de ver los videos en la sección de descripción. Quédese como un soldado con el software Scalper Terminal.
- A la derecha de cada par comercial hay columnas 5M, 15M y DIRECCIÓN. Primero, haga clic en el botón Notificar y póngalo verde.
- No es necesario mirar constantemente la pantalla. Simplemente espere a que suene la señal luminosa turquesa o el mensaje de alerta de metatrader.
- Lea la dirección exacta de operación escrita en él (también texto de la columna DIRECCIÓN), que es una luz turquesa. En la dirección comercial exacta, haga clic en el botón Turquesa para realizar especulación.
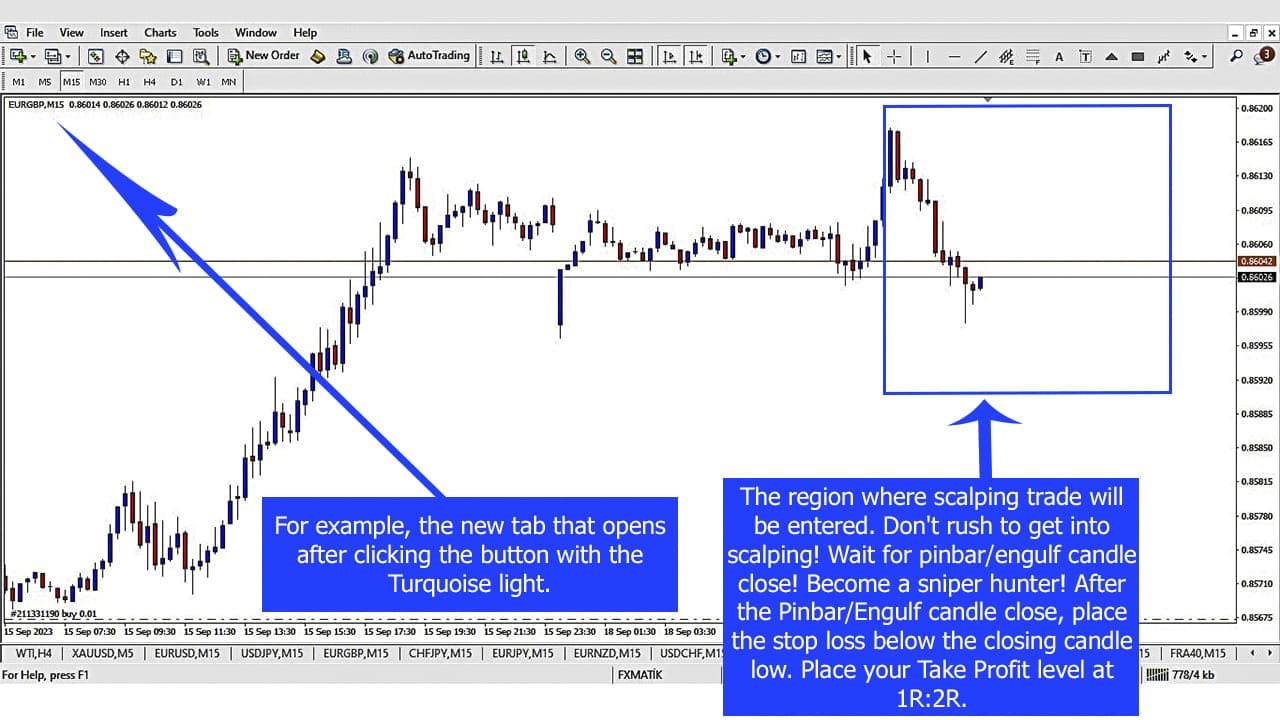
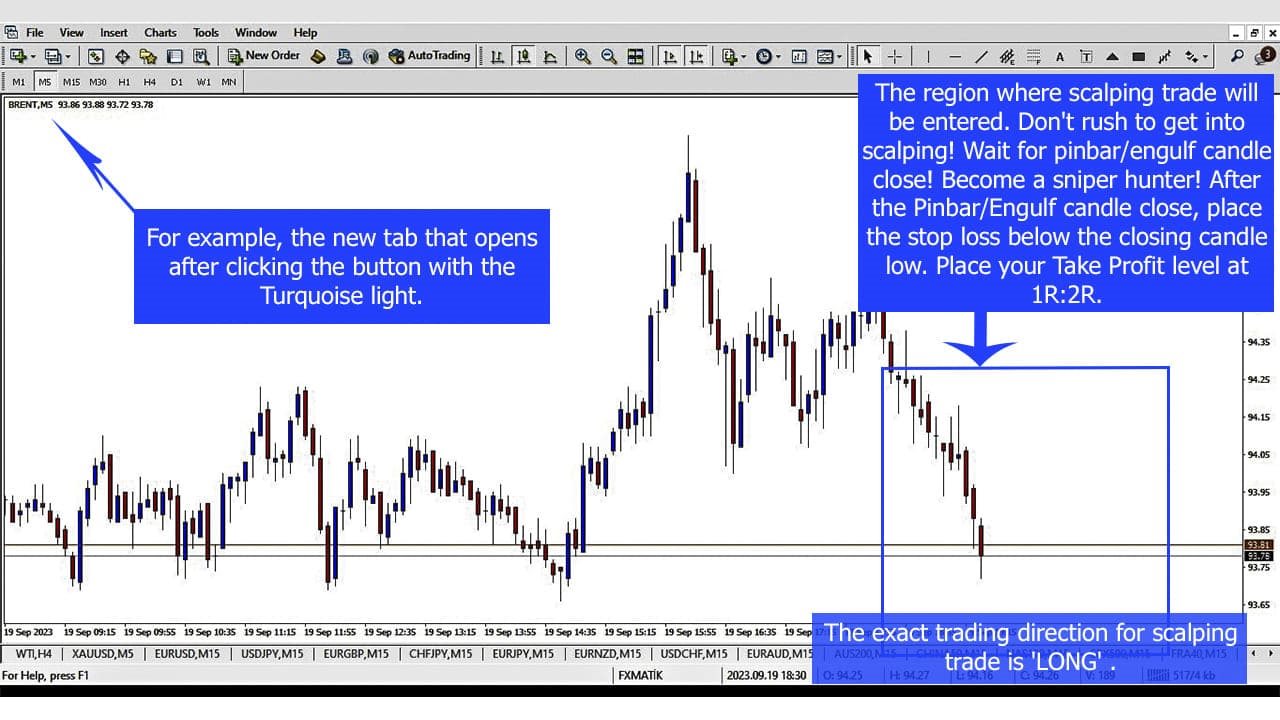
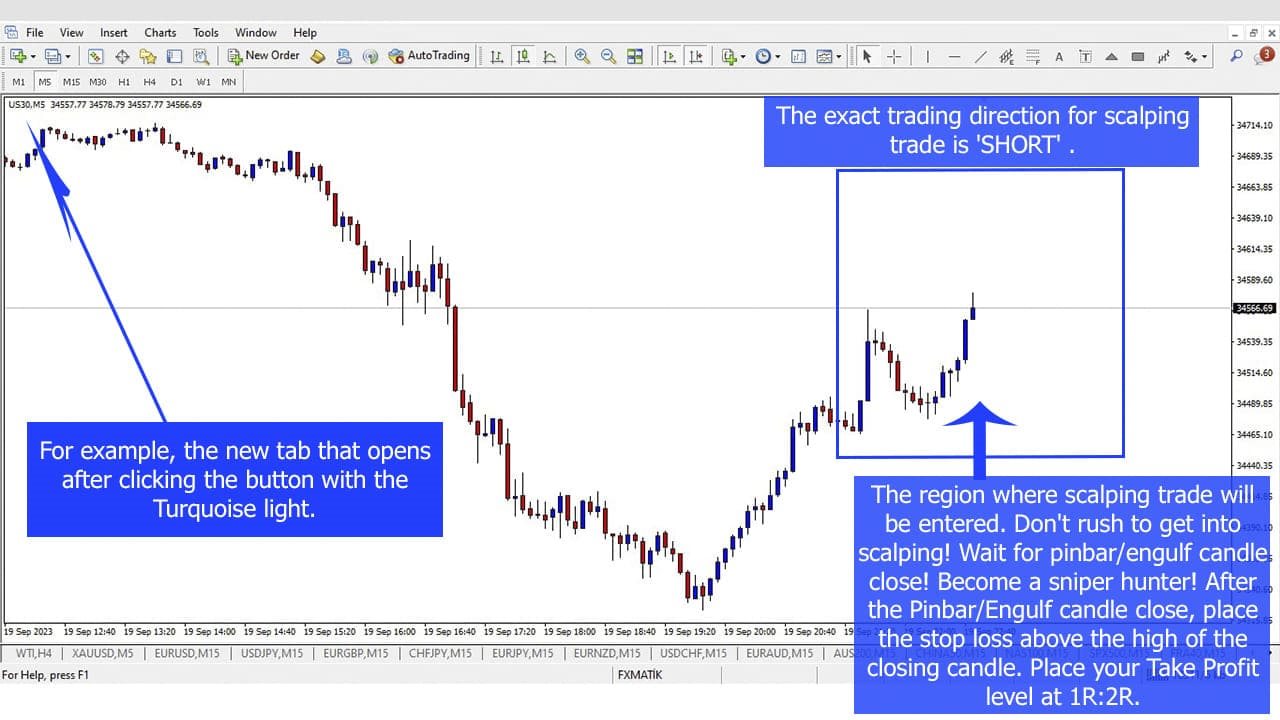
- En la nueva pestaña abierta para la transacción de especulación, espere a que pinbar o engulla la vela se cierre como un cazador.
- Cuando el cierre de la barra pinbar o de la vela envolvente es la condición para ingresar a la posición, abra una posición en la dirección indicada por la Terminal Scalper.
- Agregue una orden de stop loss en el lado opuesto a la dirección de entrada de la posición. (Por ejemplo, si se trata de una operación LARGA, el lugar de la orden de stop loss es el nivel más bajo de la última vela cerrada).
- Luego, agregue su orden Takeprofit como 1R:2R.
- La única condición para el éxito es ingresar a todas las posiciones con la misma tasa de riesgo y el stop loss debe ser 1R y el Takeprofit debe ser 2R. Utilice un complemento gratuito adicional de Metatrader4, como la Calculadora de tamaño de posición (por ejemplo, PSC Trader.ex4) para ingresar posiciones con el tamaño de lote adecuado para su riesgo fijo.
- Scalper Terminal puede generar entre 5 y 20 señales comerciales de especulación durante el día. (Depende del valor del período en la parte superior izquierda del software. Recomiendo usar el valor 18)
- ¡Sé un cazador como un francotirador! ¡Ser paciente! Espere la señal de luz turquesa y luego espere a que se cierre la barra pinbar/vela envolvente.
- Mantenga una hoja de cálculo de Excel para todos sus puestos. Si sigues la regla riesgo-recompensa 1R:2R, el éxito es inevitable.
- Seleccione solo 1 par del grupo índice y 1 par del grupo Forex al mismo tiempo. No debes abrir transacciones en más de una paridad del mismo grupo.
- Cuando abre una operación en un par con una señal luminosa turquesa entrante, tómese un descanso de 1 a 2 horas para ingresar a la siguiente operación. Porque sería más ideal si hubiera tiempo entre dos transacciones consecutivas.