Robots comerciales e indicadores para MetaTrader 5 - 102
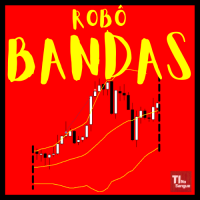
The robot uses one of the most known and used indicators in the world
BOLLINGER BANDS
There are two trading strategies: Upper or Lower Band Break and; Bollinger Band Entry.
Know our products
Position openings are based on the parameters identified as signals.
This Expert Advisor (EA) works on HEDGE (Forex, etc.) and NETTING (Bovespa, etc.) accounts, but manages only one position at a time.
The filters are used to increase the accuracy of the signals and if activated and not met

El EA abre órdenes basadas en el indicador Oscilador estocástico . Todos los parámetros del indicador se pueden configurar y optimizar.
La EA implementa dos estrategias para trabajar con este indicador: Abrir operaciones inmediatamente cuando la línea principal del indicador alcanza niveles de sobrecompra / sobreventa. Apertura de operaciones cuando la línea principal del gráfico de indicadores forma un patrón de reversión en las zonas de sobrecompra / sobreventa. El número de órdenes de comp

EEVCC Hedge Precio de promoción: $ 59 Activación: 10 Introducción Este es un EA de comercio de cobertura de cuadrícula bidireccional (compra y venta al mismo tiempo) Las ofertas firmes a largo plazo son rentables Se puede utilizar en varias monedas al mismo tiempo. Método seguro de cálculo de beneficios característica Gráfico de negociación: H1 Moneda recomendada: EURGBP, EURUSD Depósito mínimo: 3000 USD, recomendado 10000 USD, 100 USD para cuentas de centavos Corredores recomendados: RofoForex,

AUTO3M Pro MT5 is a fully automatic Expert Advisor for Trend, Hedging, News filter Strategy Trade Base On Bollinger Bands And Stochastic Oscillator Bollinger Bands Are Used Mainly To Follow Trends. Stochastic Main Line And Signal Line Use For Open Pending Order Buy Or Sell Fibonacci Are Use Target Profit, support and resistance level price The advisor Auto3M Pro MT5 can work on a VPS. MT4 version : Auto3M Pro MT4 Features No martingale Hard stop loss and take profit for each position Flexib

The Fara Expert Advisor with a drawdown of 6% for 3 years shows itself best on the EUR/USD H1 pair. It uses only three indicators "Moving Average", "Bollinger Bands" and "Top Bottom Price" . Each trade is protected by a Stop Loss and Take Profit. In the parameters of the Expert Advisor, you can change the lot size, as well as the values of indicators, Stop Loss and Take Profit, if necessary. Below is the testing statistics for 3 years. Other product: https://www.mql5.com/ru/users/rev

The QRSI indicator is one of the most important and well-known indicators used by traders around the world. All signals are generated at the opening of the bar. Any closing price or zero bar prices are replaced with the corresponding price of the previous bar in order to avoid false results. This indicator is suitable for those who are interested in the classic calculation method but with improved functionality. There is a version for both MT4 and MT5.
By its nature, the QRSI indicator is an

Catch major price movements, early in the trend. Alerts you to enter at the likely beginning of a trend, and if it's incorrect, quickly alerts you to exit to limit any loss. Designed to capture large, profitable price movements, with early entrance to maximize your returns. As shown in screenshots, typical behavior is several quick entrance/exists with small loss , and then capture of a large trend with high profits . The Instantaneous Trend indicator is a lag-reduced method to detect price t

As you know, the main invariable indicator of all traders is the moving average; it is used in some way in most strategies. It is also obvious that this indicator is capable of showing good entries in every local area. For which it usually needs to be optimized or just visually adjusted. This development is intended for automatic optimization of the indicator. Once placed on the chart, the indicator will automatically re-optimize itself with the specified period ( PeriodReOptimization ) and dis

Use for EURUSD H1 is very good for low drawdown and high profit. Can use original data for trade if you want high profit you can adjust new data and test before run. Can run it minimum capital 500 USD but you increase capital you can safe very good for port. We recommend that you run it on port standard not run on port raw spread because your profit will decrease. If you run port on swap free is very good for you.

Little Swinger (Best choice for passive income lovers)
Developed by RobotechTrading key features:
Financial Freedom Back testing results will match with real live trading results Proper TP and SL Controlled Risk Highly Optimized settings Running on our Real Live Accounts Little Risk, Little Drawdown, Little Stress, Little BUT stable income, just set and forget. Strategy:
Not Indicator based No Martingale No Grid No Repaint strategy Safe and Secure calculation of Live data and than t
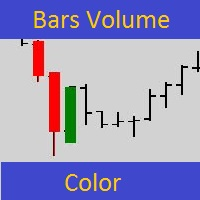
Все знают какую большую роль играют объемы в трейдинге. Основной индикатор объемов чаще всего находится в дополнительном окне и визуально плохо воспринимается. Этот простой инструмент разработан для быстрого и наглядного представления заданного объема непосредственно на графике с котировками для лучшей наглядности. Можно сразу оценить в каких местах на графике сконцентрировались большие объемы. Индикатор подкрашивает свечи по заданному объему от хая или лоу свечи до цены закрытия свечи. Если све
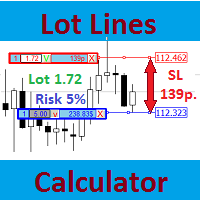
Большинство профессиональных трейдеров декларируют строгое соблюдение управления рисками. Этот простой инструмент разработан для быстрого расчета размера лота, чтобы торговать в соответствии со следующими базовыми правилами риск-менеджмента: Максимально допустимый риск устанавливается как фиксированный процент от общего количества средств на счете (например, 1-2%). Риск измеряется расстоянием в пунктах между открытием ордера и установленным стоп-лоссом. Так как для новичков всегда затруднительно
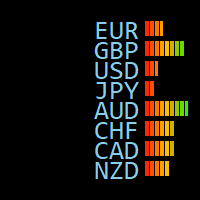
introducir Este es un asistente comercial, indicadores de panel de información, estadísticas de moneda agregadas, estadísticas de cuenta, información de posición, hora local y del servidor, fuerza de la moneda, tiempo restante de la línea K, líneas de soporte y resistencia, compensación de tiempo del servidor, tasa de fluctuaciones de moneda y otras funciones. Se puede utilizar para todo tipo de cuentas y divisas. Excelente desempeño, muy pocos recursos Puede personalizar la posición, el color,

with JR Trend you will able to enter and exit every trade with just a signals appear no need for any strategy just flow the indicator it work on all pairs and all Timeframe i usually take a look on higher timeframe and return to the lowest timeframe and make an order with indicator signals you can see the amazing result so you can depend only on it intraday or swing as you wish
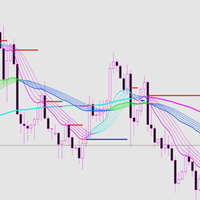
This indicator has good trend malleability and a good trend resistance support line. Index characteristics The color changes, following the trend of different levels . The support and resistance line means that the price follows or reverses.
Basic display A price tag showing historical support and resistance. Shows the approximate recommended range of historical entry positions, as well as take-profit and stop-loss recommendations, and target forecasts. Display the judgment of the current dire

ALERT UP - DOWN PARA METATRADER 5 Este indicador genera una alerta cuando el precio sale de la zona que se encuentra entre las líneas UP y DOWN. Se puede generar alertas de varios tipos como son: > Sonido > Caja de mensaje > Mensaje en la caja de expertos > Correo (previamente configurado) > Notificaciones PUSH (previamente configurado)
Las líneas se deben configurar desde las propiedades del indicador y no desde las propiedades líneas, ya que si se hace desde las propiedades de las líneas ,

Moving Wizard indicator will guide you to work with Trend and give pure Entry point depending on crossing on the chart it work on all currency and all Timeframe you can use it daily or scalping or swing its good with all and This indicator you can make it your strategy i work on it on H1 Timframe and make a good money you can take alook on it and you see a great resault on chart .Gold moving is to Know the Trend of price other moving below it mean we looking to sell orders . if above it we loo

1. What is this. This is a very rigorous indicator to show different market trading sessions. It shows the main markets: NewYork, London, Frankfurt, Sydney, Wellington, Tokyo. Very important: Different markets have different start and end dates for daylight saving time, and the trading session of a market can vary depending on daylight saving time and winter time. Also, the daylight saving time system is different for countries in the northern hemisphere and southern hemisphe

1. What is this. This is a very rigorous indicator to show different market trading sessions. It shows the main markets: NewYork, London, Frankfurt, Sydney, Wellington, Tokyo. Very important: Different markets have different start and end dates for daylight saving time, and the trading session of a market can vary depending on daylight saving time and winter time. Also, the daylight saving time system is different for countries in the northern hemisphere and southern
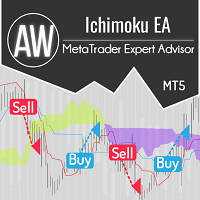
AW Ichimoku EA opera utilizando las señales del indicador Ichimoku Kinko Hyo. El robot comercial totalmente automatizado tiene una configuración flexible y muchos escenarios de trabajo. Muchas funciones útiles están integradas en el producto: cálculo automático de lotes, obtención de beneficios virtual, así como la capacidad de cerrar el primer y el último pedido de la cesta. Resolución de problemas -> AQUÍ / Versión MT4 -> AQUÍ / Instrucción -> AQUÍ Ventajas
Co
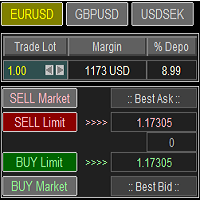
Trade Panel with Loss Breaking for MT5
Multi-instrumental trading panel with the function of transferring the stop loss of positions to loss breaking.
Has the following distinctive properties:
All trading parameters and panel operation are set in the settings. The traded position volume (lot size) is quickly changed. The required margin and the percentage of the required margin of the current deposit for the specified lot size are displayed. Shows profit when take profit is triggered and lo
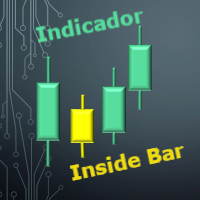
Identificador de Inside Bar O Inside Bar é uma formação de vela de reversão / continuação, e é um dos padrões de Candle mais operados pelos trader. Esse indicador permite que você identifique um O Inside Bar no gráfico de forma rápida e fácil, lhe permitindo uma tomada de decisão muito rápida e precisa. Sendo ideal para lhe ajudar nas suas diversas estratégias de Day Trade ou swing trade. O visual e a marca registrada da análise gráfica por esse motivo esse indicador conta com 3 opções visuais p
Necessary for traders: tools and indicators Waves automatically calculate indicators, channel trend trading Perfect trend-wave automatic calculation channel calculation , MT4 Perfect trend-wave automatic calculation channel calculation , MT5 Local Trading copying Easy And Fast Copy , MT4 Easy And Fast Copy , MT5 Local Trading copying For DEMO Easy And Fast Copy , MT4 DEMO Easy And Fast Copy , MT5 DEMO
Auxiliary indicators It waits for the hunt, waits for the price limit to appear, waits for

The Asian Session - it is a Secure Automated Software for trade Forex market and indices.
This system detects the ranges between the end of the American session and the beginning of the Asian session, operating in favor of the break, thinking that this break prior to the start of the session occurs because within the Asian session there will be an impulse in favor of the break. breaking off. To adapt to the different schedules of the different brokers, you have to set the closing time of the A

This EA uses the following Built-in indicators: Channels indicator Supply and demand indicator Trend indicator It is based on multi-directional grid system, not the normal martingale you are familiar with. When the price is in supply or demand zones, the EA will wait for a confirmation before entering a position. The confirmation is through the three above indicators together. You don't need to purchase any of the indicators mentioned above if you don't want to see them on the live chart.
Reversal candles indicator , use in second window with rsi,levels 10-20-50-80-90 so u can see where the reversal candles pop upat the overbought oversold rsi levels.Great oppertunity to get in early and get out at the best moment. Candle turns blue at the 10-20 level "buy" candle turns red at the 90-80 level "sell" Always look at the major trend beore taking a buy or sell!!!

El EA funciona según el principio de desviación máxima del precio del valor medio. La idea es que el precio siempre busque el equilibrio, y cualquier gran desviación del promedio conduce a una fuerza-reacción recíproca. La entrada se realiza sobre estos desvíos. https://www.mql5.com/en/signals/2047087
(puedes operar de manera más conservadora si lo deseas).
Opciones: sigal_deviation - desviación máxima después de la cual se abre una operación; Filtros:
closeBarOnly: funciona solo cuando l

Все паттерны из книги Томас Н. Булковский "Полная энциклопедия графических ценовых моделей" в одном индикаторе со сканером. Cканер включается параметром ScannerMode. При ScannerMode=false индикатор ищет один паттерн (выбирается переменной Pattern). При выявлении паттерна индикатор рисует стрелку, открывает окно сообщений, выполняет push-уведомление. У индикатора много параметров, некоторые их них задействованы всегда, некоторые выборочно. Включите переменную ShowHelp - на графике отобразится по

Smart Gridder MT5 está basado en RSI y Bandas de Bollinger. La configuración optimizada se proporcionará a continuación. La estrategia del EA se basa en que la vela cruce las bandas de Bollinger y el RSI será el factor decisivo si abrirá una operación de compra o venta. El tamaño de la cuadrícula se calculará automáticamente.
AJUSTES OPTIMIZADOS:
DEPÓSITO MÍNIMO: Cuenta de $ 400 Cent
EURUSD: https://drive.google.com/file/d/1BVz5ad8kwgz7NcJCNr0mfQzGurc53u1t/view?usp=sharing GBPUSD

CandleVolume is an indicator that colors bars according to increasing or decreasing volume. You can use it to identify strategic regions of the chart and complete an analysis. White means low volume, yellow means medium volume and red means climax volume. It is a recommended indicator if you like to interpret market contexts and understand how market cycles work.

This is an intra day strategy that is simple and resilient for long term use. There are only a few parameters and the entry is triggered by price action, no indicators are needed. The time of entry and exit will affect the performance, defaults can be used for safe and conservative trading. Broker spreads will also affect the returns, because it is intraday, the frequency of trade is once per day per pair. Do try out the backtest and forward test to verify the results. No grid or martingale
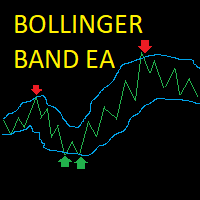
Bollinger Band Scalper EA This EA opens trades when the price hits and bounces off the Bollinger Bands, it closes the trade when it reaches the opposite Bollinger band or if the price reverses into the trailing stoploss. Posisitions are sized dynamically depending on the user's account balance. The EA waits for the price to cross the Bollinger Band and then opens a market order at a set percentage of the bandwidth from the band chosen by the user. The position is sized a percentage of the user's
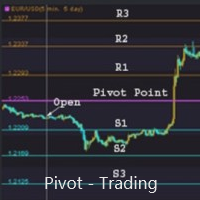
支点交易 : 1.pp 支点 2. r1 r2 r3 , s1 s2 s3 交易实用必备工具指标 波浪自动计算指标,通道趋势交易 完美的趋势-波浪自动计算通道计算 , MT4版本 完美的趋势-波浪自动计算通道计算 , MT5版本 本地跟单复制交易 Easy And Fast Copy , MT4版本 Easy And Fast Copy , MT5版本 本地跟单复制交易 模拟试用 Easy And Fast Copy , MT4 模拟账号运行 Easy And Fast Copy , MT5 模拟账号运行
支点( pivot points) 作为一种交易策略已经很长时间了,最初是场内交易员使用这种方法。使用这种方法通过几个简单的计算就可以了解市场在一天中的去向。 支点法中的支点是一天中市场方向的转向点,通过简单地计算前日的高点、低点和收盘价,可以得到一系列点位。这些点位可能形成关键的支撑和阻力线。支点位,支撑和阻力位被统称为支点水位。 你所看到的市场每天都有开盘价、高价、低价及收盘价(有一些市场是 24 小时开盘,比如外汇市场,通常用 5pm EST 作为开盘和收盘时间)。这些信

Open Risk Profit shows your current risk or possible profit of all open positions. Total open risk is your loss if all positions run into the stop loss.
Total open profit is your profit if all positions reach your take profit.
Total float is your current profit or loss of all positions. The program also breaks down the information into the individual symbols. For example, you can monitor how much is your current profit and your potential risk in EURUSD, no matter how many individual positio

GRat Clusters is an indicator that shows various data in the form of clusters on a price chart: volume, delta, ratio of sales and purchases, etc. It allows you to visually see the market profile in real time and on history at a given depth. Capabilities 1.8 types of cluster data: volume, delta, purchases and sales , volume and delta, imbalance between sales and purchases , volume profile, delta profile, buy and sell profile. 2. A cluster period can be either any available in MT5 timeframe or

Adapted from the award winning international best seller (Short Term Strategies That Work) by Larry Connors and Cesar Alverez in 2008, this concept was retested 10 years after the book published and that will give you an idea of the concept if it still works. Take the last 10 years as walk forward and this strategy is added with a twist to risk management with arbitrary 5% stop loss and exit day counted as calender days instead of trading day. This EA works on dual mode, Long and Short. Origin

Killer Market MT5 is an advisor with a system for "Resolving" a basket of unprofitable orders, a news filter, a filter for open positions on other trading instruments and the function of sending trading signals to your Telegram channel.
The Expert Advisor can be used to restore unprofitable positions on the account as a utility to bring trades to breakeven that you opened with your hands or other Expert Advisors.
Works inside a linear regression channel, input on several conditions. The s

Diagrama de bloques: una forma alternativa de comercio Si es un comerciante que está confundido por las velas en innumerables gráficos, o no sabe cómo dibujar líneas o cómo dibujar líneas de soporte y resistencia, debería encontrar otro método de negociación que se adapte a sus necesidades en este momento. NS. Al igual que un conductor se detiene para una revisión completa después de encontrar problemas repetidamente, lo mismo ocurre con una transacción. El gráfico de ladrillos proporciona un mé

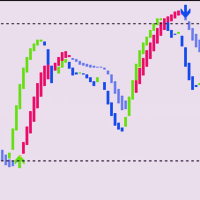
Ing (inguz, ingwar) es la 23ª runa del Futhark mayor ᛝ , Unicode + 16DD. Agregue un poco de magia rúnica a sus estrategias comerciales. El marcado correcto del gráfico diario le indicará los momentos exitosos para el comercio de contra-tendencia. Fácil de usar, tiene una alta eficiencia en áreas volátiles. Tenga cuidado con los movimientos laterales.
Las señales ᛝ se generan cuando se cruzan las líneas de construcción principales.
Flecha roja hacia abajo-ventas recomendadas
Flecha azul

An indicator of patterns #45 and #46 (Three Falling Peaks and Three Rising Valleys) from Encyclopedia of Chart Patterns by Thomas N. Bulkowski. Parameters: Alerts - show alert when an arrow appears Push - send a push notification when an arrow appears (requires configuration in the terminal) PeriodBars - indicator period K - an additional parameter that influences the accuracy of pattern shape recognition. The smaller the value is, the smoother the row of peaks/valleys should be, so fewer patt
An indicator of patterns #50 and #51 ("Triple Bottoms", "Triple Tops") from Encyclopedia of Chart Patterns by Thomas N. Bulkowski.
Parameters: Alerts - show alert when an arrow appears Push - send a push notification when an arrow appears (requires configuration in the terminal) PeriodBars - indicator period K - an additional parameter that influences the accuracy of pattern shape recognition. The smaller the value is, the smoother the row of peaks/valleys should be, so fewer patterns will

Moving average, moving average (English Moving average, MA) is a general name for a family of functions, the values of which at each point of determining the level of some average value of the original function for the previous period.
CalcPipsOn - In order to add rozruhunok on the chart, you must activate this field.
The previous development of a variant of this indicator differed in that it had an extended functionality for calculating averaging in the set, as well as advanced possibili

An anchored Vwap With Arrows is an indicator that includes a moving average weighted by volume that allows you to plot on a bottom or a top. Usually banks and institutions measure an average price, this average price is a price range where they agree to make a trade. Using the logic of anchored vwap with arrows it is possible to understand that if the price breaks the vwap it means that someone with enough buying and selling power has lost control. You can use vwap anchored with arrows in any ti

Market structures, Market balance, Range breakouts This tools helps to identify areas of market ranges, structures and plots colored boxes on breakout of those areas. User is given the option to receive alerts and notifications on the formation of the blocks. The tool has the ability to become an essential part of a technical trading system or even pure price action trading. Usage:- An essential tool for price action or technical traders. More information in the blog

Horizontal volume bars, Cluster analysis, Volume profile Volume in Range gets information about the accumulated volume in a specified vertical range and period in bars. The received data is then plotted on the chart as rectangular boxes with the volume quantity inside. Usage:- The tool acts as a support resistance levels but most importantly it should be used to check in which direction the price breaks out of the significant levels formed by this indicator and then actions to be taken on correc

The QRSI indicator is one of the most important and well-known indicators used by traders around the world. By its nature, the QRSI indicator is an oscillator, that is, it fluctuates in a certain zone, limited by the maximum (100) and minimum (0) values. Specifically, this indicator works according to an accelerated algorithm, but this is not its only difference. This indicator implements a more advanced calculation based on the Relative Strength Index algorithm. The peculiarity of the implemen
An indicator of pattern #55 ("Dead cat bounce, inverted") from Encyclopedia of Chart Patterns by Thomas N. Bulkowski.
Parameters: Alerts - show alert when an arrow appears Push - send a push notification when an arrow appears (requires configuration in the terminal) PeriodBars - indicator period ArrowType - a symbol from 1 to 17 ArrowVShift - vertical shift of arrows in pixels. Note. Arrows appear on a forming bar and do not disappear. It cannot be guaranteed that the indicator recognize
An indicator of pattern #54 ("Dead cat bounce") from Encyclopedia of Chart Patterns by Thomas N. Bulkowski.
Parameters: Alerts - show alert when an arrow appears Push - send a push notification when an arrow appears (requires configuration in the terminal) PeriodBars - indicator period ArrowType - a symbol from 1 to 17 ArrowVShift - vertical shift of arrows in pixels. Note. Arrows appear on a forming bar and do not disappear.
It cannot be guaranteed that the indicator recognizes the pat

An indicator of patterns #24, #25, #26 and #27 ("Head and Shoulders", "Complex Head and Shoulders") from Encyclopedia of Chart Patterns by Thomas N. Bulkowski.
Parameters: Alerts - show alert when an arrow appears Push - send a push notification when an arrow appears (requires configuration in the terminal) PeriodBars - indicator period K - an additional parameter that influences the accuracy of pattern shape recognition. The smaller the value is, the smoother the row of peaks/valleys shoul

This indicator is an oscillators that shows the real strength of 8 main currencies in the Forex market. It recreates a basket of the main currencies and applied a True Strength Indicator on each of them. The calculated real currencies are: EUR - USD - GBP - CHF - JPY - AUD - CAD - NZD. It clearly identifies overbought and oversold ares. From reading the oscillator you can choose the right Forex symbol to trade.
Future versions: I am working on adding alarm and a real buy sell signal, choos
An indicator of patterns #9 and #10 ("Cup with handle") from Encyclopedia of Chart Patterns by Thomas N. Bulkowski.
Parameters: Alerts - show alert when an arrow appears Push - send a push notification when an arrow appears (requires configuration in the terminal) PeriodBars - indicator period K1 - an additional parameter that influences the accuracy of recognition and pattern shape (the lower the value, the smoother the cup edge is) K2 - an additional parameter that influences the accuracy o
Bollinger Bands (BB) are similar to Envelopes. The difference between them is that the boundaries of the Trade Bands (Envelopes) are located above and below the moving average curve at a fixed percentage distance, while the Bollinger Bands are plotted at distances equal to a certain number of standard deviations. Since the magnitude of the standard deviation depends on volatility, the bands themselves adjust their width: it increases when the market is unstable, and decreases in more stable per

Implements a channel based on integrated comparison of moving average values with improved functionality. As a result, the chart displays a channel of deltas of moving averages in the center line and an indentation of the channel boundaries over a specified range.
What is the channel? This is the price range (limited), in which all its dynamics (movement) takes place over a certain period of time. This method is very old, the Forex channel strategy dates back to a long time, when the theory

Implements an oscillator based on a simple comparison of the last two moving average values with improved functionality. As a result, the graph displays the delta of the two moving average values. In the case of a single value, the moving delta is calculated relative to the last two candles, which price of comparison will be specified in the Price parameter. The delta of two values is often used to determine the trend, depending on the length of the moving averages, it can be a longer or sh
Moving average, moving average (English Moving average, MA) is a general name for a family of functions, the values of which at each point of determining the level of some average value of the original function for the previous period.
This indicator is suitable for those who are interested in the classic calculation method but with improved functionality. There is a version for both MT4 and MT5.
Moving averages are commonly used in time series data to smooth out short-term fluctuations a

Implements a channel based on the moving average indicator with improved functionality.
Moving average, moving average (English Moving average, MA) is a general name for a family of functions, the values of which at each point of determining the level of some average value of the original function for the previous period. The channel moves up and down relative to the moving average by a specified number of points.
This indicator is suitable for those who are interested in the classic calc
An indicator of patterns #13 - #20 ("Double Tops" and "Double Bottoms", types Adam-Adam, Adam-Eva, Eva-Adam, Eva-Eva) from Encyclopedia of Chart Patterns by Thomas N. Bulkowski. Adam - sharp tops/bottoms, Eva - flat ones. Parameters: Alerts - show alert when an arrow appears Push - send a push notification when an arrow appears (requires configuration in the terminal) PeriodBars - indicator period K - an additional parameter that influences the accuracy of pattern shape recognition. The smalle
An indicator of patterns #2 and #3 ("Broadening formation right-angled and ascending" and "Broadening formation right-angled and descending") from Encyclopedia of Chart Patterns by Thomas N. Bulkowski.
Parameters: Alerts - show alert when an arrow appears Push - send a push notification when an arrow appears (requires configuration in the terminal) PeriodBars - indicator period K - an additional parameter that influences the accuracy of pattern shape recognition. The smaller the value is, t
An indicator of patterns #1 and #4 ("Broadening Tops" and "Broadening Bottoms") from Encyclopedia of Chart Patterns by Thomas N. Bulkowski. Version 1: bottom, top, bottom, top, top breakout. Version 2: top, bottom, top, bottom, top breakout.
Parameters: Alerts - show alert when an arrow appears Push - send a push notification when an arrow appears (requires configuration in the terminal) Variant1 - show version 1 of the pattern Variant2 - show version 2 of the pattern PeriodBars - indicat

Versión MT4: https://www.mql5.com/en/market/product/72558 La estrategia se basa en rebotar en los niveles de soporte y resistencia más importantes. El algoritmo no utiliza estrategias de alto riesgo. Cada comercio está protegido por varios niveles de control. Se utiliza un algoritmo de seguimiento de transacciones adaptativo. La estrategia ha sido probada con éxito a lo largo de todo el historial disponible, con una calidad de simulación del 100%. Con deslizamientos y comisiones cercanas

The robot uses one of the most used indicators in Asia:
* ICHIMOKU CLOUD *
There are two trading strategies:
Crossing of Tenkan and Kijun lines and; Kumo lines crossing.
Know our products
Position openings are based on the parameters identified as signals, if you activate all the robot will issue a trading order only if the number of signals is greater than the minimum stipulated by the user.
This Expert Advisor (EA) works on HEDGE (Forex, etc.) and NETTING (Bovespa, etc.) accou
Trading Strategy The Leicester expert advisors uses three exponential moving averages to determine entry positions. Trend Line Slow Moving Average Fast Moving Average Crossovers between the fast moving average and the slow moving average will create sell signals. If prices are below the trend line then only sell positions will be opened. Vice versa for when prices are above the trend line, only buy positions will be opened. Inputs/Features
Candles after cross - Number of candles to wait before
An indicator of patterns #5 and #6 ("Wedges, ascending, broadening" and "Wedges, descending, broadening") from Encyclopedia of Chart Patterns by Thomas N. Bulkowski.
Parameters: Alerts - show alert when an arrow appears Push - send a push notification when an arrow appears (requires configuration in the terminal) PeriodBars - indicator period ArrowType - a symbol from 1 to 17 ArrowVShift - vertical shift of arrows in pixels ShowLevels - show levels ColUp - color of arrow up СolDn - color

Ferramenta derivada do DR Assistant, a versão Lite conta com recursos semelhantes, mas sendo mais específica em sua aplicação, destina-se exclusivamente ao uso para gestão de ordens abertas a partir de suas funções. Deste modo, quaisquer outras negociações ou posições abertas por outras ferramentas ou manuais serão ignoradas pelo Assitant Lite. Os parâmetros e configurações disponíveis, bem como suas principais funções são: - Take Profit e Stop Loss: duas opções de Steps, em pontos, para ambas a

This is MT5 version of ChristMyHedge . It should be referred to as ChristMyHedge-for-MT5.
Like its MT4 counterpart, the EA/signal runs on Daily (D1) time-frame on 12 pairs: GBPUSD, EURUSD, USDCHF, USDCAD, NZDUSD, USDJPY, AUDUSD, GBPEUR, EURJPY, CADJPY, AUDJPY and EURCHF concurrently, with a recommended minimum of 150USD equity per 0.01 lot size.
Default parameters may be OK, and it's best to run on VPS, if you do not have 24/5 Internet and electricity.
However, the newer version of Christ
If you are looking for a safe ea to start trading in index this is your ea
This ea performs a market entry that starts the algorithm at the time of day that the trader decides. We recommend it to be 1 min after the opening of the index.
It also allows you to say close the operation at the close of the session or keep the cycle open.
It only performs a daily cycle that starts at the scheduled time and remains alive until it exits for profit or session close.
This system is designed to

Lógica de trabajo
El Asesor Experto en Estrategia de Dow es un Asesor Experto basado en la teoría de Chalse Dow de "retención de tendencias".
El Asesor Experto usa el TF seleccionado, si la barra anterior estaba arriba, significa que abrirá una compra y colocará un stop detrás del Mínimo de la vela anterior (es posible establecer un filtro para una compensación de la vela anterior), luego, una vez que se cierra la vela actual, el stop loss se moverá nuevamente más allá del mínimo, por lo qu

El panel tiene la interfaz más intuitiva que todo principiante puede manejar.
En la columna SLp , debe especificar el tamaño de SL en pips. Si el valor se vuelve gris y al mismo tiempo los botones Bay / Sell también están inactivos, entonces ha especificado un valor SL que es menor que el permitido antes de que lo estableciera su corredor.
En la columna TP% , indica TP en% del saldo de la cuenta. En la configuración, puede elegir en función de lo que se calculará este indicador, por capital
¿Quieres un EA con stoploss pequeño? ¿Quieres un EA que esté dentro y fuera del mercado?
Este EA está actuando en breakout para DAX (índice de Alemania), o Dow Jones. Solo se compra cuando se abre el mercado y con una ventana de 10 minutos o menos.
Estas estrategias (sí, se trata de 2 estrategias diferentes que se pueden utilizar con 3 gráficos diferentes) tienen stop loss apretado y un takeprofit que a menudo se alcanzará en cuestión de segundos!
Las estrategias están bien probadas. Los
Lógica de estrategia Pump and Dump for mt5 Expert Advisor es un asesor comercial totalmente automatizado creado por un comerciante para comerciantes. La estrategia es "comprar más barato, vender más caro". Las órdenes se abren después de una subida / bajada significativa del precio. El significado básico de la estrategia Pump and Dump es comprar un activo más barato cuando el precio baja y venderlo más alto cuando sube el precio. Probablemente haya notado que después de fuertes movimientos de p
MetaTrader Market - robots comerciales e indicadores técnicos para los trádres, disponibles directamente en el terminal.
El sistema de pago MQL5.community ha sido desarrollado para los Servicios de la plataforma MetaTrader y está disponible automáticamente para todos los usuarios registrados en el sitio web MQL5.com. Puede depositar y retirar el dinero a través de WebMoney, PayPal y tarjetas bancarias.
Está perdiendo oportunidades comerciales:
- Aplicaciones de trading gratuitas
- 8 000+ señales para copiar
- Noticias económicas para analizar los mercados financieros
Registro
Entrada
Si no tiene cuenta de usuario, regístrese
Para iniciar sesión y usar el sitio web MQL5.com es necesario permitir el uso de Сookies.
Por favor, active este ajuste en su navegador, de lo contrario, no podrá iniciar sesión.