YouTube'dan Mağaza ile ilgili eğitici videoları izleyin
Bir ticaret robotu veya gösterge nasıl satın alınır?
Uzman Danışmanınızı
sanal sunucuda çalıştırın
sanal sunucuda çalıştırın
Satın almadan önce göstergeyi/ticaret robotunu test edin
Mağazada kazanç sağlamak ister misiniz?
Satış için bir ürün nasıl sunulur?
MetaTrader 5 için Uzman Danışmanlar ve göstergeler - 102

Эксперт основанный на простой стратегии пересечения 2-х скользящих средних .
Используйте ECN-счета или прочие счета с низким спредом.
Стандартные настройки оптимизированы под EURUSD H1 . Депозит: $100 . Плечо: 1:3000 . Лот: 0.05
Ведется работа по оптимизации под другие торговые инструменты и таймфреймы, а также улучшение текущих настроек для получения более качественных результатов. Внимание! Цена динамически меняется. Успейте приобрести сейчас по начальной цене, пока эксперт находитс

Индикатор "Tiger" показывает развороты рынка. Основан на индексе относительной бодрости (RVI).
Представлен в виде осциллятора, который показывает энергию текущего ценового движения и отражает уверенность ценового движения от цены открытия к цене закрытия в диапазоне максимальных и минимальных цен за данный период. Это, в свою очередь, даёт трейдеру возможность находить точки разворота с большой вероятностью.
Не перерисовывает!
Хорошо показывает себя на боковом движении рынка, которое п
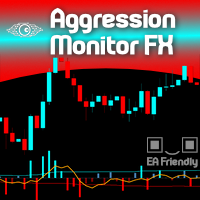
Would you like to monitor the aggression between Buyers and Sellers, minute by minute? Now you can! Welcome to the Aggression Monitor FX ! The Aggression Monitor FX indicator was developed for those markets that do not provide REAL data Volume, i.e. like the Forex market. We developed a way to use 1-minute Tick Volume data generated by Forex (and other) Brokers and manipulate it into "aggression" information in a very visual histogram with additional analysis lines. And it worked! (but hey! you

There are no limits!
Golden Limit is the ultimate indicator to get clear and easy readings of price movements on charts. It projects support and resistance ranges, calculated by statistical models involving Price Action and the Fibonacci sequence, revealing in advance the behavior of prices and the best places to trade and not to trade. It also has two moving averages to help choose the best entries. The Golden Limit method was created from a proven model. In summary: We use the names of preci

the indicator will show signal arrows on the graph at the crossing of Awesome Oscillator base level it has push and audible alerts and Email alert. By crossing above base level , a blue arrow will come out for the BUY, at the same time an audible signal will sound. By crossing Below base level, a red arrow will come out for the SELL, at the same time an audible signal will sound. Possibility to deactivate push and audible alerts.
MT4 version : Buy the 'Awesome cross' Technical Indicator for
Unlike a standard moving average, trendy traders unique algorithm will show you a less choppy signal resulting in a smoother and easier trend to follow thereby making your trading decisions more confident. Put simply when price moves above the average it signals a bullish trend and when price moves below the average it signals a bearish trend. The trader is then given 2 levels of take profit and a stop loss on each new signal. It can also be added to other trend-following systems for better pe

Binance borsasındaki herhangi bir kripto para birimini analiz etmek ve ana kritik sinyalleri (Binance'de, ayrıca herhangi bir MT5 brokerinin herhangi bir sembolünü) izlemek için güçlü bir araç.
Avantajlar:
Hepsi bir arada!!! Geçmişi indirmek ve çevrimiçi Binance verilerini almak için artık farklı ürünlere ihtiyacınız yok. Telgrafa, mobil terminale ve maile sinyal göndermek, piyasalar hakkında her zaman bilgi sahibi olmanızı sağlar. Esnek sinyal ayarları ve kırılmaları ve sıçramaları izlemek

This algorithm uses smart martingale. Able to survive in any situation. New orders are not determined by distance. But it is determined by the point where the market is expected to reverse. The robot start with ordering according to the trend. Never place orders that are against market trends and do not place orders in situations where market trends tend to reverse. Finally, you can earn more profits by using Trailing Stop.

- Go up one more level with the most important Tools to Analyze the Market, such as drawing Horizontal and Dynamic Lines, Zones, Ratios, Trap Level Strategy, Impulse Projection, Bar Information with precision, automatic drawing of the most important Opening Levels (Open Day , Open Week, Open Month, Open Year), floating boxes on the chart where we can see the Countdown of each bar, the Spread and ATR indicator, an independent Panel with buttons for all options and shows the symbol, Time Frames,
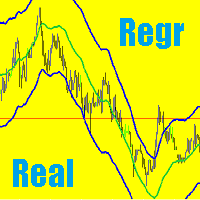
Realization of the regression channel on МetaТrader 5, with real residual image of the lines.
The regression channel itself consists of two lines equidistant above and below the regression trend line. The distance between the channel boundaries and the regression line is equal to the deviation of the maximum closing price from the regression line, only this definition corresponds to the most recent regression points. As everyone noticed, the lines of the regression channel are redrawn with ea

Cumulative delta indicator As most traders believe, the price moves under the pressure of market buying or selling. When someone redeems an offer standing in the cup, the deal is a "buy". If someone pours into the bid standing in the cup - the deal goes with the direction of "sale". The delta is the difference between purchases and sales. A cumulative delta - the difference between the cumulative sum of purchases and sales for a certain period of time. It allows you to see who is currently contr

A real girder with "blood and bones". Virtual Bot will open virtual trades, using them to monitor the market to determine the entry point(according to the inputs parameters), at which point Virtual Bot will start opening real trades. It is recommended to test this Expert on demo account or cent account.
Input Parameters input group "..........Choice..........." ; input start_enum start= 2 ; //Start input uchar starting_real_orders= 4 ; //Start opening re

The Commissioner indicator is very sensitive to current price activity and displays signals quite well. Reacts quickly to trend changes, clearly shows the price movement. The colored version of the indicator signals a trend change. The indicator allows you to see a rising or falling trend.
In addition to the direction of the trend, the indicator shows the change in the slope, the analysis of which allows you to filter signals using filters by angle, this can be used when building a bot with t

The "Blockchain" Expert Advisor is based on the market consolidation algorithm. The algorithm is designed to determine the direction of price movement. Works on all instruments, including cryptocurrency. The Expert Advisor contains many combinations of trading settings, grid, using one order using stop orders. It is also possible to trawl the placed order. Enabling and disabling the EA operation mode. It can also be used as an indicator for manual trading. Sets are provided for three pairs of yo

The utility helps to locate in the lower time frames the maximum and minimum of the upper time frame. The length of time frame level line represents the temporal length of the upper time frame. It's possible to OnOff the levels with a button or keys
The indicator draws lines that delimit the upper time frames candle and highlights his high-low price and the pips candle range. How it works:
Firstly . Choose which time frames levels to represent in the lower ones : monthly, weekly, da

Some professional traders do not enter the market by market orders... they use limit orders... they are creating the market... so how are they profiting with that approach? Lets say GBP-USD is at 1.32545 Program will offer to sell GBP at 1.32548... so 0.03 cents higher... ( advantage is in market spreads in your favor ) if someone takes that trade... EA will try to sell it at marker price of 1.32545 making 0.03 cents profit on that transactions. But that may not happen... Price can go down 0
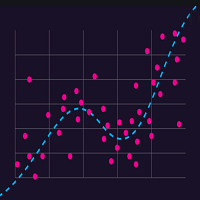
The Regression Channel consists of two lines equidistant above and below the regression trend line. The distance between the channel boundaries and the regression line is equal to the deviation of the maximum closing price from the regression line, only this definition corresponds to the most recent regression points.
The term regression refers to the field of statistics. The center line of the channel is the trend line. To calculate it, the method of least squares is used. The line above the

At first, I got my teeth into Dragon Ultra Expert Advisor. Build a smart grid both with the trend and against the trend. The powerful combination of locking and partial loss closure. The program is constantly being improved and upgraded. You should use the Dragon Training proficiently before buying the product. You can run in real environment with the Dragon Lite , note that the input parameters are hidden. Advantages of the Dragon Ultra Smart recovery system with Fibonacci grid Good resist

when we use EA to trade, sometime we need open a manual order and we don't want to close order within a period of time manually, but want EA to take over. this EA can create manual position with Comments and magic number so that EA can take over. it supports both direction for buy and sell positions, we can also change lot manfully before create any position. I personally used this EA for several months and it look good.

The Urgently indicator is designed to quickly determine the situation in the market, reflect the state of the market and signal profitable levels for opening trades. Market conditions change quickly enough, requiring constant calibration of trading strategies. Recommended for use in conjunction with any of the oscillators. The Urgently forex market trend indicator shows the trend direction and entry points. It smooths out price fluctuations when generating a signal by averaging the data and the

Bu gösterge, mevcut zaman diliminde daha yüksek zaman diliminin bir projeksiyonunu oluşturur. Renkli mumlar şeklinde görselleştirme. Pazardaki süreçleri, ölçeğini ve dinamiklerini daha iyi anlamaya yardımcı olur. Tüm bunlar bir ilham kaynağı olabilir ve başarılı bir ticaret stratejisi bulmanın doğru yolunu gösterebilir. Gösterge, şamdan desenlerini aramayı basitleştirir. Birkaç göstergeyi farklı parametrelerle etkinleştirmek ve aynı anda birçok zaman dilimini görmek mümkündür. Ayarlarda mumları
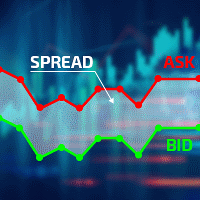
Excellent spread indicator. Reflects the spread on each bar as it is. It should be remembered that the spread is displayed at the time of the bar opening. Therefore, the most correct information will be on the minute bars. Spread is one of the basic forex concepts that any trader should know. If explained clearly, you can describe such an example. The trader buys the EUR / USD pair at the rate of 1.1000. However, he immediately goes into negative territory, for example, by 10 points, as if he bo

The CandleStick Factory is a tool that allow you to perform a market scan and search any candlestick pattern that you already created. The lite version can be downloaded here : https://www.mql5.com/en/market/product/75568 You can perform a quick search in the current chart (500 bars will be scanned), or save your custom candlestick patterns, and search in different Symbols/Timeframes that you can select in the settings tab, the scan can be scheduled every 1, 5 or 10 minutes by updating the Ref
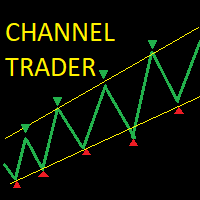
The Auto Channel Trader creates a channel by plotting a line along the high points and low points of the chart, the EA then makes long trades near the bottom of the channel and short trades near the top of the channel. The channel is created by finding high points for the top line and low points for the bottom line, these points are shown with arrows. A line of best fit is then plotted through these points and extended until the end of the chart. The length of the channel is determined by the M
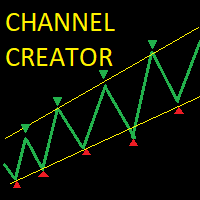
The auto-channel indicator creates a top line and bottom line that encloses a channel within which the symbol has been trading. The channel is created by finding high points for the top line and low points for the bottom line, these points are shown with arrows. A line of best fit is then plotted through these points and extended until the end of the chart. This indicator is useful for trading both within the channel and for breakouts. Inputs: MAPeriod - The moving average period over which the

Stochastic Cross Arrow is an indicator that automatically places arrow when stochastic K and D line crosses each other on a certain level.
Buffer Guide For Developers: Buffer 0 =Buy Arrow Buffer 1 =Sell Arrow Inputs: ---Stochastic Settings--- %K - %K value. %D - %D value. Slowing - Slowing value . Stochistic Method - Moving Average method. It can be any of enumeration values. Newbar - arrow only appear on new bar. Buy_Msgs - type info message when buy arrow appears. Sell Msgs - type inf
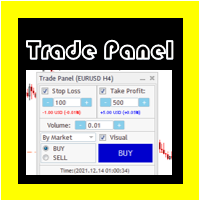
TİCARET PANELİ OSW METATRADE 5
Bu panel, hesapta oluşturulan para birimine göre her bir işlemin maliyetini görüntülemenize olanak tanıyan piyasa emirleri vermenize yardımcı olacaktır.
İŞLEV KILAVUZU:
1) Butonları ile veya yazılı olarak bir DURDURMA seçin (Koyma seçeneğini aktif veya pasif hale getirebilirsiniz).
2) Butonları ile veya yazılı olarak bir TAKEPROFIT seçin (Koyma seçeneğini aktif veya pasif hale getirebilirsiniz).
3) veya düğmeleri yazılı olarak bir VOLUME seçin.
4) "Piy
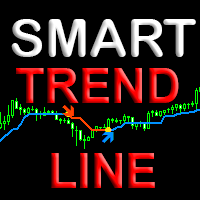
Индикатор с уникальным авторским алгоритмом определения направления тренда. Показывает лучшие результаты определения тренда на любых валютных парах, акциях, криптовалюте без перерисовки результата. Имеет встроенную статистику, что поможет сразу определить прибыльность текущей пары и таймфрейма. Использует паттерны Price action в связке с уникальным алгоритмом фильтрации. Подходит как новичкам так и профессионалам для всех видов торговли. Как выбрать прибыльный таймфрейм и оптимизировать индикато

The current expert advisor is accomplished as a Telegram-bot. The purpose of the EA is to inform about events retrieved from thу database of the economic calendar . It is necessary to allow the following URL in the options in the tab "Expert Advisors": https://api.telegram.org There's ony 1 input parameter "User name". The Telegram username must be added here as @name. After starting the Expert Advisor onto the chart one needs to open Telegram app and find the bot named " Mql5News ". No

Merhaba arkadaşlar, Ben Özgür ve yaklaşık 10 yıldır forex bilgisine sahibim ve bu ürün ticaret için en iyi seçenek. Agry Birds, grid algoritmasına sahip benzersiz bir ticaret sistemidir. Ayrıca benim tarafımdan kodlanmış özel takip durdurma ve DD azaltma işlevleri gibi bazı benzersiz stratejilere de sahiptir. Şimdi gerçek bir hesapta Agry Birds'ü test ediyorum. Bir süre sonra harika bir robot olacağına eminim çünkü ben de sizin gibi bir tüccarım. Mevcut fiyat bu EA için normal fiyat değil, bir h
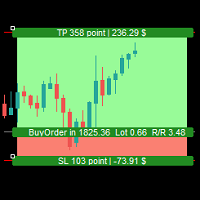
Simple Assistant for Trading
Precise Risk Management in each
Automatic Money Management Visual Trading Open Position Management User friendly and practical
during 15 years of considerable experience in stock market, we have dealt with many professional traders who have been used profitable and unrivalled methods in this market but failed in the long term. The reason is undoubtedly the lack of standard in their manner during their trade. Standard means the accurate repetition of a proces

产品简介: 本工具是一个简单的交易面板,主要用于复盘交易训练。您可以在策略测试环境下根据自己的交易策略进行交易练习。 这个工具主要适用单向交易训练,不适合进行对冲交易训练。
使用方法: 在策略测试中选择本EA,并进行货币兑、图表周期、复盘时间段等相关参数设置。 点击“开始”按钮后,会显示交易面板。 您可以点击“+”、“-”来调整下单时的仓位大小,每点击一次,变化0.01。 BUY按钮用来建立多头仓位。 SELL按钮用来建立空头仓位。 CLOSE按钮用来平仓,如果持有多个仓位,会平仓“报价”靠前的订单。
均线指标: 这个工具提供两条均线指标的显示支持。 在“输入”选项卡中,可以设置均线的显示与否,以及均线的周期参数。
自定义指标: 这个工具还提供一个自定义指标的显示设置。 在“输入”选项卡中,可以设置自定义指标的显示与否,以及它的路径参数。

1. What is this Rising volatility and falling volatility are not the same, whether it is academic research or actual testing has shown this point. The original ATR indicator is calculated by putting up and down fluctuations together. This indicator is to calculate separately the upward volatility and the downward volatility, which can better help you study the market.
2. Indicator description There are two modes for the calculation of this indicator, as shown in the f

Hello, boys and girls!
Script allows you either to quickly save opened charts and then close all charts opened by visual tester mode or just faster close all charts. Feel free to take a look at video manual about how to use this script on my YouTube channel. Also, feel free to join my telegram channel , where time to time I publish some exclusive stuffs. Feel free to leave feedback and thoughts how to improve this script - I'd highly appreciate that. All the best.

Fiyat kanalı, mevcut piyasa durumunu analiz etmek için bir tüccarın ana aracıdır. Onun yardımı ile gelecekteki fiyat davranışını başarılı bir şekilde tahmin edebilirsiniz, ancak kar elde etmedeki ana faktör zamanında kararlar. Bu genellikle bir sorundur, çünkü sürekli olarak monitöre bakmak imkansızdır. Bu gösterge, farklı periyotlarla (hızlı ve yavaş) iki trend kanalını otomatik olarak oluşturur ve günceller. Eğilim, doğrusal regresyon kullanılarak belirlenir. Kendiniz oluşturabileceğiniz 1 öze

FXC Trade AssistanT MT5
This trading software will help you in manual trading. You can use it for open and close positions in many forms. The EA offers you lot sizeing, stop management methods and other usefull tools using with its control panel.
New in v1.13: Ultra-Fast CLOSE operation can close over 100 trades/second (Only MT5) New SETUP panels: Control, Chart, Msg., SFX, Advanced Added SFX sound profiles
Zero-Point Calculation with Swap & Commission Can handle foreign trades
New Info data
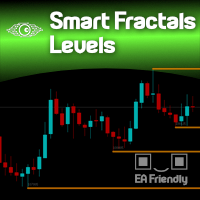
Support & Resistance taken to the next level. The Smart Fractals Levels indicator is based on Bill Williams' theory of identifying Support & Resistance levels through the use of the so-called "fractals". The difference between common Support and Resistance regions drawn on chart and the Smart Fractals Levels is that only NEW and untouched levels will still stay drawn on the chart (if you decide so), and also based on your own set of rules, totally configurable from the "settings" menu of the ind

This indicator shows supports and resistences calculated form historical data when market was swing. When market was swing ? When ADX was below 25 for some bars. In fact market can be considered without a trend. I mean and suggest timeframes H4 and Daily. Using that lines in the present you see resistance and support. More lines are distant and best is possible profit. Every ADX parameters can be set, so colors, swing market bars number.
I am available to get feedback or modify code. Thanks Al

Haswell MT5 is a fully automated trading system designed to work on one of the most popular currency pairs GBPUSD. The strategy is based on the indicators "ADX MA Oscillator", "Previous High Low" and "Stochastics", as well as on the analysis of the price chart movement. Profit is made using a dynamic step-by-step algorithm. It is recommended to use VPS and use the services of a proven ECN broker with a narrow spread and fast order execution. Other products: https://www.mql5.com/ru/users/revan

Clear Dom
This Indicator shows a pressure color box based on depth of market of the current symbol. Notice that it only works when book information is received.
You decide weather you want or not to display higher (ask) and lower (bid) levels of book.
The proportion ratio is calculated using volumes read from the book. You can read the actual pressure in the market any time.
Indicator parameters: color_Ask -> ASK box color and ASK value line color color_Bid -> BID box color and BID valu
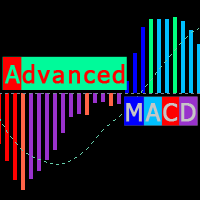
Modified MACD, for technical analysis of charts, with color backlight of histogram signals. The indicator highlights, the direction of the histogram movement, the change in the direction of the histogram movement, the histogram peaks, the interaction of the histogram and the signal curve. Also, the indicator makes it easier to find convergences / divergences between bars and the histogram (which serve as a powerful signal in some trading systems using the MACD indicator). Color designation of Ad

Rediscover trading. The future of Forex is intuitive hybrids. Hello, my name is Szymon, I am a professional algorithm developer for trading on financial markets forex. Working experience in finance and programming for more than 10 years. I specialize in grid systems and martingale. Black Horse EA is an automated forex robot (this is not your usual grid or martingale). This EA trades based on the breakout of price levels (according to the mathematical algorithm, it determines the area of a rang
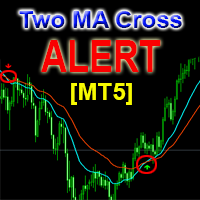
This is a support tool that will notify you when a fast MA (Moving Average) Line crosses a slow MA Line, you can choose any fast MA Line and slow MA Line by parameters in input tab The Indicator will draw a red arrow where fast MA line crosses DOWN slow MA line and it will draw a green arrow where fast MA line crosses UP slow MA line There are 3 Alert methods : Pop Up Alert, Send Email or Notification You can choose true or false to use or not for any Alert method in input tab You can choose Al

Merhaba arkadaşlar,
Foreks de güvenli alım satım yapmak için; ihtiyacınız olan tek şey " pro intraday trading" göstergesidir. Bu gösterge, belirlediğiniz zaman aralıklarında bu enstrümanın "günün en düşük ve en yüksek değerini" analiz ederek "Güvenli Alım / Satım" noktalarını tespit eder ve size canlı grafikte anında "hedef fiyat" verir.
Güvenli Satın Alma noktaları olarak Buy 1- Buy 2- Buy 3 sunar. Güvenli satış noktaları olarak Sell 1 - Sell 2 - Sell 3 sunar. Risk anlayışınıza göre bu
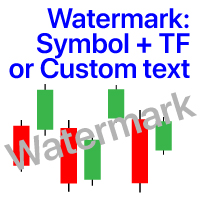
Grafikte filigran: Sembol + Zaman Dilimi / veya kendi metniniz # 1 Yardımcı Programım: 38'den fazla özellik içerir | Herhangi bir sorunuz varsa bana ulaşın Göstergenin ayarlarında şunları yapılandırabilirsiniz: Punto; Metin rengi; Yazı Tipi Adı; Pozisyon:
1 = Sol Üst;
2 = Sağ Üst;
3 = Sol Alt;
4 = Sağ Alt;
5 = Merkez; Geçerli Zaman dilimini göster: açık / kapalı; Kaldırılacak Sembolün öneki ( n_AUDCAD --> AUDCAD ); Kaldırılacak Sembolün soneki (USD CAD pro -> USD CAD); Özel metni göster: E

Dear friend, I'm glad you're interested in the results of my work and you want to understand how to use this tool better. Here I will try to explain in detail and clearly what works and how to do to set everything up, as well as to get pleasure and profit from the results of my labors. If you liked it, I'll be really happy to see the positive feedback on the Market:)
Currency pairs: EURUSD, GBPUSD - they are the main ones and give good profits right now! (USDJPY, USDCHF, AUDUSD, USDCAD on r
Takip Eden Durağınızı Yapın, Kar Elde Edin, Başabaş ve Stop Loss seviyelerini komisyoncuya görünmez hale getirin!
GİZLİ MOD (STEALTH MODE) Sanal Takip Durağı Sanal Kar Elde Edin Sanal Başabaş Sanal Durdurma Kaybı Sanal 2 seviyeli Son Durak Sanal Firar Kar Almak Siparişlerin Sanal Ömrü Grafikteki etiketleri sürükleyerek düzeyleri ayarlama (Sürükle& Bırak)
TİCARET PANELİ Siparişler / pozisyonlarla daha hızlı çalışın [1] Sipariş lotunu değiştir [2] Satın alma siparişi verin [3] Satı

The indicator connects the price in a cyclical-wave relationship. Thus, all intersection points will be optimal points at which the movement changes taking into account the indicator period. Crossing points can be used as potential market reversal points. But do not forget that the approach must be complex, the indicator signals require additional information to enter the market.
Suitable for forex, futures and binary options without redrawing. It gives a lot of signals, which requires additi

Fibonacci'den türetilen harmonik kalıpların kullanıcıları için mevcut en eksiksiz araçtır.
Tamamen Özelleştirilebilir: Düzey, Renk, Çizgi Tipi ve Kalınlık.
Çalışmalarınıza göre kullanılacak Fibonacci seviyelerini seçin.
Varsayılan olarak, araç zaten saygı duyulduğu kanıtlanmış, ancak kullanıcı tarafından serbestçe değiştirilebilen Fibonacci seviyelerine sahip olacaktır.
Fibonacci seviyelerinin, dikdörtgenlerin (dolgulu veya dolgusuz) ve sınırlı yatay çizgilerin nasıl çizileceğinin rengi
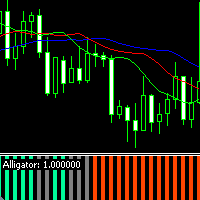
The modified Alligator indicator is designed as an oscillator. Facilitates the analysis of the Alligator indicator values by signaling the trader about market changes using a colored histogram. Histogram color values
Medium Spring Green - uptrend Orange Red - downtrend Gray - lateral movement (flat) Parameter values jaw_period - jaw period teeth_period - teeth period lips_period - lips period jaw_shift - jaw shift teeth_shift - teeth shift lips_shift - lips shift ma_method - method for calcula

The intelligent algorithm of the Ikiru indicator accurately detects the trend, filters out market noise and generates input signals and exit levels. Functions with advanced statistical calculation rules improve the overall performance of this indicator. A convenient indicator for technical analysis and is suitable for trading binary options. All entry points are ideally optimal points at which movement changes. Entry points should be used as potential market reversal points.
It is a hybrid tr

Это классический вариант реализации экспоненциальной скользящей средней с коррекций ошибки, какой используется в индикаторах DEMA и TEMA. Соответственно названию, глубина коррекции ошибки увеличена до 33. Индикатор оптимизирован. Потребляет минимально возможные ресурсы. Достаточно быстр, учитывая объёмность вычислений. Может накладываться на другие индикаторы. Как и обычные скользящие средние, nEma_33 не перерисовывается (за исключением нулевого бара). Требуется история > Период*33*33. Согласно

This tool has been designed for macroeconomic investors. It allows you to observe and operate currency indices that are more uncorrelated instruments than currencies, that do not share the same noise level as pairs and are totally uncorrelated with each other.
CurrencyTrader is a tool that allows you to trade the DXY, EURX, JPYX, GBPX, CADX, AUDX, CHFX and NZDX currency indices
Currently I use this tool for my swintrading in darwinex MACRO for MetaTrader 5 - Antonio Renteria Arce
I have l
53% OFF until December 31 (Normal price $125)! Don't miss the opportunity to have this invaluable tool!
This is a totally automated multi timeframe support and resistance levels finder on every MT5 chart. No manual work! Just drop this indicator on a chart and you will have the S/R levels always up to date. It is very convenient and helps the trader to anticipate possible stalls and reversions in price movements. The levels are displayed as lines and each timeframe has a different color. The
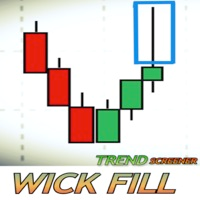
Ticarette fitil nedir? Bu Screener nasıl çalışır? Bir mum çubuğundaki fitil, fiyattaki bir reddi yansıtır. Bu Screener, doldurulma potansiyeli yüksek olan fitilleri belirlemeye çalışıyor. Bu Screener, trend piyasasında meydana gelen fitillere odaklanmıştır.
Screener, canlı olarak işlem gören potansiyel fitillerin genel bir görünümünü sunan bir gösterge tablosu görüntüler. Zaman dilimine göre düzenlenen TÜM çiftleri / enstrümanları gösterir. Satın alma fırsatları "UP-W.'' olarak adlandırılır.

This is a fully automatic system for multi-currency trading (17 currency pairs) on the Forex market. The trading system itself finds the most powerful Price Action patterns in a fully automatic mode! Trading is conducted on 17 currency pairs at the same time and uses timeframes M5. Each pair has a stop loss, take profit, breakeven and trailing stop. Real m onitoring : https://www.mql5.com/ru/signals/2238618
Benefits Partial closure to reduce the load on the deposit. Determines the direction
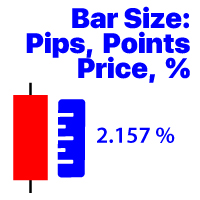
Seçilen zaman diliminde çubuğun fiyat değişimini görüntüler
Mevcut hesaplama seçenekleri: Fiyat değeri; Yüzde değeri (%); Yeniyor; Pazar noktaları; # 1 Asistanım: 38'dan fazla özellik içerir | Herhangi bir sorunuz varsa bana ulaşın Program dosyası " Indicators " dizinine yerleştirilmelidir.
Göstergenin ayarlarında şunları yapılandırabilirsiniz: Punto; Metin rengi; Grafikte konumlandırma: sol alt veya sağ alt köşede; Bilgisayarınızın geçerli saatinin görüntülenmesini açma / kapatma; He

Price reach indicator. It also serves as the perfect term for supports and resistance. I use it in two experts. The basic tool for professional trading. The indicator analyzes the last 500 bar and uses this to determine the levels ( but it doesn't predict the future ) . Personally, I use it on TF H1. It is very simple. Four lines on chart and that's all. Only two input parameters. Thousands of indicators. Why this? Is good ? No! Is very good. Please test the indicator prior to purchasing. You

MT 5 Gelişmiş Stokastik Robota Hoş Geldiniz
Sadece 2 Stokastik Filtreyi istediğiniz gibi ayarlayın ve Robot işi sizin için yapar.
Özellik:
- Sihirli Numara
- Forma Filtresi
- Kar Al
- Zararı Durdur
- Çubuk Kaydırma
- Sinyal karşısından çıkın
- Filtre (ayarlanabilir)
- Takip
- Martingale
ve daha fazlası.
1 Lütfen 7/24 indirme ve işlem yapmaktan çekinmeyin.

This EA trades according to your trendline. It can trade in several modes: will open only one trade and then be stopped trades only in the direction of the trendline opens more trades after each touch with the trendline trades in both directions it can place a pending order or open a market order See the screenshots below for a better understanding of its features.
Unfortunately, it is not possible to draw your own trend line in the MT5 strategy tester. This EA will draw its own trendline for

-Fitil Dolgu Trend konsepti
Piyasadaki yüksek volatilite olayları sırasında, mumlar hareketleri boyunca fitil oluşturma eğilimindedir. Bir mum çubuğundaki fitil, fiyattaki bir reddi yansıtır. Çoğu zaman bu fitiller doldurulur çünkü bu yönde iten büyük bir hacim vardır. Wick Fill Trend, trend piyasalarına odaklanan bu fırsatları tarar.
Giriş noktası, kar alma ve zararı durdurma ile canlı sinyali görüntüleyen bir başarı oranı simülatörü gösterge tablosuna sahiptir. Bu başarı oranı simülatörü,
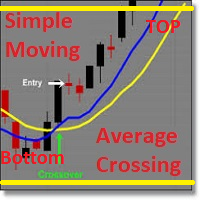
Info: marcobarbosabots
This EA automates order opening by crossing two simple moving averages. If price is on a top region, a sell order is placed. Othewise, if price is on the bottom region, a buy order is placed. Only one order at a time. No martingale and no grid system. This EA also has the option to allow it to place or not orders on the market. The value of moving averages, lot, takeprofit, stoploss, top price, bottom price and width price region are configurable, and they do not allo

I want to clarify right away that the "Zero" adviser uses the "Martingale" strategy, so who is not satisfied with this strategy, you can not read further. The EA also uses several indicators "Previous High Low", "Top Bottom Price" and "ATR MA Oscillator" which help to find the best entry points in the market. The default parameters of the Expert Advisor are suitable for the EUR/JPY M5 currency pair. For other currency pairs, additional parameter settings will most likely be required. Other produ
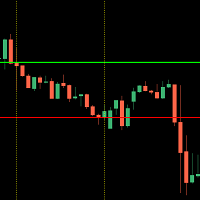
This indicator shows you the higher high and lower low of a certain period of time.
It is easy to use - select your desired time frame (current, 15Min, 1H, 1D) and the corresponding number of candles.
The indicator measures the highest and lowest point within the specified range and automatically draws the two corresponding lines.
The design of the lines is up to you!
Should the trend break one of the drawn lines with a closed candle, a message will be sent to you by the built-in alarm f
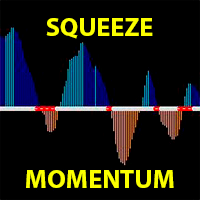
TTM Squeeze Momentum is a volatility and momentum indicator introduced by John Carter of Trade the Markets (now Simpler Trading), which capitalizes on the tendency for price to break out strongly after consolidating in a tight trading range.
This derivative Squeeze Momentum indicator attempts to identify periods of consolidation in a market. In general, the market is either in a period of quiet consolidation or vertical price discovery. By identifying these calm periods, one has a better oppo
MT5 için Para Birimi Gücü Göstergesi , yeni başlayan veya uzman tüccarlar için yenilikçi bir çözümdür! Fiyat hareketi ile birleştirdiği ve 8 ana para biriminin olağan 28 kombinasyonu dışında herhangi bir sembol/çift üzerine uygulanabildiği için para birimi gücü kavramını tamamen yeni bir seviyeye taşıyor. Bu, tüm para birimleri, majör, minör ve egzotikler, emtialar ve kriptolar (endeksler değil) dahil olmak üzere herhangi bir çiftin gücünü veya zayıflığını takas edebileceğiniz anlamına gelir. H

Looking for a quality pivot point indicator? So Prosecution is what you need! To identify pivot points, the Prosecution indicator analyzes many conditions, as the aggregate analysis provides a more accurate picture of the market situation.
What are pivot points? Pivot point analysis is often used in conjunction with the calculation of support and resistance levels, as is the case with trend line analysis. When analyzing pivot points, the first support and resistance levels are calculated

Trend Everest MT5 göstergesi, karar vermeye yardımcı olan bir trend takip göstergesidir. Yardımcı olan ATR'nin ve ortalama gövdenin hesaplanmasına dayanır. Önemli bir konu, Trend Everest MT5 adayının yeniden boyamamasıdır, böylece daha fazla güvenle geriye dönük test yapabilirsiniz. Yeşil Yüksek Trend olduğunda Kırmızı düşüş trendi olduğunda. Piyasa fraktal olduğundan değil, bu nedenle grafik süresi ne kadar uzun olursa, iddialılık derecesi o kadar yüksek olur.
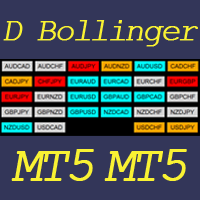
This indicator helps to visualize the Bollinger Band status of 28 pairs. With the feature of color panel, alert, and notification features, user can catch the potential Bollinger Bounce opportunities from 28 main pairs on one Dashboard quickly. Dashboard Bollinger Band is an intuitive and handy graphic tool to help you to monitor all 28 pairs and provide trading signals based on the Bollinger Bounce Rules (Overbought/Oversold and Bollinger Band Cross).
Color legend clrOrange: price is above th
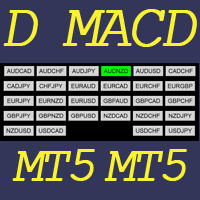
This indicator helps to visualize the MACD status of 28 pairs. With the feature of color panel, alert, and notification features, user can catch the potential buy and sell opportunities when the 28 main pairs’ fast EMA cross the slow EMA on one Dashboard quickly. Dashboard MACD is an intuitive and handy graphic tool to help you to monitor all 28 pairs and provide trading signals based on the MACD Rules (Fast EMA Cross Slow).
Color legend clrRed: MACD fast EMA down cross MACD slow EAM and MACD
MetaTrader Mağaza, ticaret robotları ve teknik göstergeler satmak için en iyi yerdir.
MetaTrader platformu için ilgi çekici bir tasarıma ve iyi bir açıklamaya sahip bir uygulama geliştirmeniz yeterlidir. Milyonlarca MetaTrader kullanıcısına sunmak için size ürününüzü Mağazada nasıl yayınlayacağınızı açıklayacağız.
Ticaret fırsatlarını kaçırıyorsunuz:
- Ücretsiz ticaret uygulamaları
- İşlem kopyalama için 8.000'den fazla sinyal
- Finansal piyasaları keşfetmek için ekonomik haberler
Kayıt
Giriş yap
Gizlilik ve Veri Koruma Politikasını ve MQL5.com Kullanım Şartlarını kabul edersiniz
Hesabınız yoksa, lütfen kaydolun
MQL5.com web sitesine giriş yapmak için çerezlerin kullanımına izin vermelisiniz.
Lütfen tarayıcınızda gerekli ayarı etkinleştirin, aksi takdirde giriş yapamazsınız.