Nuevos robots comerciales e indicadores para MetaTrader 5 - 92

Dark Moon is a fully automatic Expert Advisor for Scalping Trading. This Expert Advisor needs attention, in fact presents highly customizable. Dark Moon is based on Dark Absolute Trend MT5 indicator, these Trades can be manage with some strategies. (Write a review at market to receive 1 paid indicator for free!) The expert advisor is able to get a very high-rate of winning trades. My tests were performed with the real tick date with 99,90% accuracy, actual spread, additional slippage
FREE

The MA Bounce Strategy is a strategy that seeks to long FX pairs on a strong uptrend as they bounce off their MA support and shorting FX pairs on a strong downtrend as they bounce off MA resistance. The best suitable periods of moving averages for that strategy are 18, 30, 50. This indicator helps to identify and find place for potential market entry by MA bounce strategy. More information about MA Bounce Strategy can be read by this link https://www.mql5.com/en/blogs/post/743037 . By defau

Quick Info - una utilidad de información para recopilar y proporcionar a un comerciante de forma conveniente información variada y útil necesaria para comerciar en los mercados financieros todos los días. Toda la información útil que necesita se recopila y agrupa en una ventana separada. En la primera pestaña, encontrará estadísticas comerciales para el período de tiempo seleccionado. Para recopilar estadísticas comerciales, solo necesita seleccionar un período de tiempo de la lista o especifi
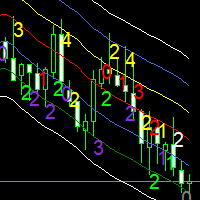
Las medias móviles son un indicador sencillo y serio para evaluar la evolución de un precio. Pero, ¿qué configuración elegir? 12 periodos? 20 periodos? No existe una configuración única de promedio móvil para todos los instrumentos, en todo momento, para todos los períodos de tiempo, simplemente porque no todos los instrumentos tienen la misma volatilidad, todos son muy diferentes. Tienen firma. La aplicación Signature es una poderosa herramienta de apoyo a las decisiones. Se basa en el uso de e

https://www.mql4.com El indicador de evolución de los precios refleja con precisión la evolución de los precios de mercado y, al mismo tiempo, la evolución futura de los precios de mercado. El indicador no se redibuja y no se retrasa. Se recomienda UN período de tiempo no inferior a H1. Cuando los precios de mercado se sitúan en el rango verde claro, el mercado se sitúa en el rango ascendente, y cuando los precios de mercado se sitúan en el rango verde claro, el mercado se sitúa en el rango desc
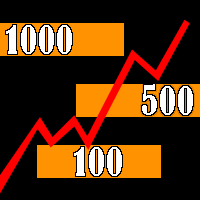
The indicator builds "psychological levels": levels of round numbers and intermediate levels of round numbers.
Round numbers play an important role in forming support and resistance levels. There is a pattern in which the decline or growth of the price can stop at round numbers.
The level whose price ends at 0 is the level of a round number of the first order. Intermediate level, this is the level between two round levels, for example, between 10 and 20 this is level 15.
In the " Num_Zero
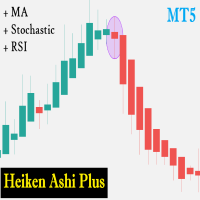
Heiken Ashi Plus is a trading tool in the form of an expert advisor. This EA works based on the change in the color of the Heiken Ashi candle. called a plus because there are additional indicators such as Moving Averages, Stochastic and RSI which you can combine its use with Heiken Ashi candles.
Update V2. = Add Multi TimeFrames Features
Explanation of EA parameters LotMethod : 1 = Fixed Lot, 2 = RiskLot (Freeze of Balance), 3 = Martingale System TrailingStart : Trailing will activated aft

The utility draws pivot levels based on a selection from day week month The previous candlestick of the selected timeframe is taken and the values for the levels are calculated using the following formulas:
Pivot = (high + close + low) / 3 R1 = ( 2 * Pivot) - low S1 = ( 2 * Pivot) - high R2 = Pivot + (R1 -S1) R3 = high + ( 2 * (Pivot - low)) S2 = Pivot - (R1 - S1) S3 = low - ( 2 * (high - Pivot));
The style and thickness for all lines are adjusted.
The colors for the R, Pivot and S line
FREE

Deflection MT5 (MT4 version https://www.mql5.com/ru/market/product/63276 ) - a trend following expert advisor. It is based on strategy of searching entry points in the beginning of a trend. 2 EMA are used for a signal determination. Deflection has an adaptive system of profit and losses targets calculation which is based on current volatility. The control of risks is managed by TP/SL ratio and via setting risk per trade of a balance amount. Stop Loss and Take Profit targets in points are calc
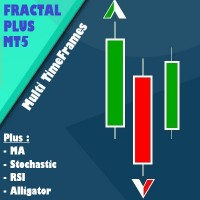
Fractal Plus is a trading tool in the form of an expert advisor. I n it there are 1 indicators that are position execution and 4 indicators that function as filters. You can choose whether each indicator is active or not, it can even be combined according to your trading needs. All filter indicators have multi timeframes options.
Indicators as execution position: 1. Fractal
4 Indicators as Filter: 1. Moving Averages 2. Stochastic Oscillator 3. RSI 4. Alligator
Parameter Information: - Lot
CAP Stochastic EA Pro MT5 trades using the Stochastic Indicator. It offers many customizable Stochastic trading scenarios and flexible position management settings, plus many useful features like customizable trading sessions, a martingale and inverse martingale mode. [ Installation Guide | Update Guide | Submit Your Problem | All Products ]
Before buy Pro version? You can buy alternation pro version, our powerfull EA, CAP Strategy Builder EA . This is strategy builder EA. It produc

This indicator sums up the difference between the sells aggression and the buys aggression that occurred in each Candle, graphically plotting the waves of accumulation of the aggression volumes. Through these waves an exponential average is calculated that indicates the direction of the business flow.
Note: This indicator DOES NOT WORK for Brokers and/or Markets WITHOUT the type of aggression (BUY or SELL). Be sure to try our Professional version with configurable features and alerts: Agr
FREE
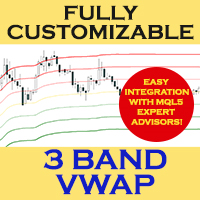
3-BAND VWAP (Volume Weighted Average Price)
Fully customized and EA-friendly VWAP Bands Indicator
MAIN FEATURES:
Choose the period of the VWAP calculation reset (Daily, Weekly or Monthly): For day trading use the Daily VWAP, and for longer term analysis use the Weekly or Monthly calculations.
Fine adjustment of the deviation of the bands: Find the best band’s deviation for the instruments you trade and adjust accordingly.
Customize line colors, style and width according to you

It is a system with many options to help each user find their own settings. There are possibilities to use a filter based on two averages, as well as the choice of whether the system will work at certain hours of the market. The default settings are tested for the eurusd pair. I would recommend that each user do their own testing and find settings that suit their preferences. This is not a ready-made system that you will use without working on it. But it is a good tool to build each user a strat
FREE

The utility draws reversal levels using the formulas for each of the selected number of candles:
Pivot = (high + close + low) / 3 R1 = ( 2 * Pivot) - low S1 = ( 2 * Pivot) - high R2 = Pivot + (R1 -S1) R3 = high + ( 2 * (Pivot - low)) S2 = Pivot - (R1 - S1) S3 = low - ( 2 * (high - Pivot)) H = high L = low U = if the candle is bullish, then close. Otherwise - open D = if the candle is bullish, then open. Otherwise - close
On any timeframe.
After a new candle closes on the calculated timefr
FREE

The indicator paints the candlesticks of the chart in colors calculated from the values of the strengths of the bulls and bears.
It works like this:
The values of the two indicators Bears and Bulls are taken, and who is stronger on the candlestick is compared. It's all.
.
FREE

Find out in real time which side, buy or sell, is putting the most pressure through a simple and efficient visualization of Depth of Market. The indicator calculates the amount of offers at the specified depths and displays the percentage on each side in relation to the total. PressureBook Indicator is fully customizable, in which you can: Select which symbol you want to track. By default, the selected symbol is the same as the graph in which the indicator was inserted; Define the amount of pri

The Better Volume indictator improves the comprehension on volume by coloring the classical histogram bars . The colors point out differents nature of volume .
The Better Volume OnOff allows to open/close the subwindow through a botton or using the keyboard only. There is the possibility to customize 3 symbols and assign them different parameters for each time frame .
The indicator improves the comprehension on volume by coloring the classical histogram bars : CLIMAX UP -

Capital protector MT5 es un Asesor Experto que trabaja en función de las pérdidas y ganancias de su cuenta. Sus funciones incluyen: Cierre de todas las órdenes cuando se alcanza una determinada ganancia o pérdida. Elimina cualquier otro Asesor Experto instalado en un gráfico secundario cuando se alcance una determinada ganancia o pérdida. Envía una notificación al móvil cuando se alcance una determinada ganancia o pérdida. Para configurar el Asesor Experto solo tendrás que programar el límite d

Description: TrendAccess can optimize your trading time by showing you the trend via two different calculation modes quick and easy.
No more searching for Trends. Just open the chart and look at the trend display.
Features: Shows Uptrend, Downtrend and "No Trend" indicator
Shows the calculated ZigZag Profile
Works on all timeframes Two different calculation Modes (MACD and Candle-based calculation)
Settings: Variable
Standard Value Description
Calculation Mode
Candle based
C
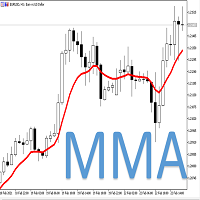
This system use M M A (Multipair Moving Average ) It is a multipair system, which uses the value of the averages in the majors to detect the entry points in the EURUSD.
!!!!!IMPORTANT!!!!! THIS EA IS FOR USED IN EURUSD ONLY. !!!!!IMPORTANT!!!!!
Only one operation at a time. It does not use hedging or marging systems, all operations have Stoplost, Take Profit and trailing stop, configurable. The system also allows you to configure the parameters of the averages that give us the entry and

Индикатор Trading Strategy призван помочь трейдерам в поиске оптимальных входов в сделку и выходов из неё. В его основе лежат показания технических индикаторов (MA, RSI, ATR и др.), а также авторский алгоритм, связывающий их сигналы в единое целое. Индикатор даёт сигналы на покупку и продажу в виде стрелочек: стрелочка вверх — сигнал на покупку, вниз — на продажу. В правом верхнем углу показаны сигналы индикатора на 6 таймфреймах (M1, M5, M15, M30, H1, H4) данной валютной пары. Индикатор свои з

TRADE CLOSER is an Expert Advisor which manage your manual trades. One click and all your manual trades are handled, the Expert Advisor doesn't trade. The Expert Adviser can : CLOSE ALL TRADES CLOSE PROFITABLE TRADES ONLY CLOSE LOSABLE TRADES ONLY CLOSE MOST PROFITABLE LOSABLE TRADES CLOSE PAIR ON PROFIT, you specify the amount and the target pair will close profit CLOSE ACCOUNT ON PROFIT, you specify the amount of all pairs on profit and account will close profit. Close all your trade

White Crow Indicator
by VArmadA A simple yet powerful candle analysis based indicator using the White Soldiers & Crow patterns.
Works with timeframes 1H and higher and tested on all major pairs. Pay attention to the signal: An arrow indicating a long or short entry.
How It Works:
Arrows indicate a ongoing trend. After multiple bullish or bearish candles in a row the chances for another candle towards that trend is higher.
Instructions: - Crow Count: Set the number of candles that ne
FREE

This EA will read news from MQL website and create global variable to indicate if there is a news reported within the specified time frame. You can then read these global variable in your EA to filter out trades. Global variable format - News_CHF, News_EUR, News_GBP, News_JPY and News_USD If value is 0 means no news. If value is 1 means there is news reported within the specified time frame.
Please comment to give suggestion to improve it.
FREE

Индикатор RSI MT5 - это индикатор Metatrader 5, и суть этого технического индикатора заключается в преобразовании накопленных исторических данных на основе индикатора RSI. Сигналы показаны разными цветами свечей. Смотрите настройки, тестируёте. Это очень полезный индикатор и он точно должен быть у вас . The RSI in candlelight MT5 indicator is a Metatrader 5 indicator, and the essence of this technical indicator is to transform the accumulated historical data based on the RSI indicator. Signals a

Описание индикатора будет крайне коротким. Индикатор Коридор тренда показывает трейдерам зону в которой находится валюта и даёт понимание по какому тренду движется рынок. Визуально очень хорошо воспринимается. Уровни взяты и просчитаны не просто. Полезный индикатор для арсенала индикаторов трейдера. The description of the indicator will be extremely short. The Trend Corridor indicator shows traders the zone in which the currency is located and gives an understanding of which trend the market is
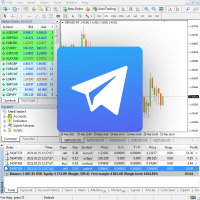
Сообщения в Telegram из MT5 о торговых событиях: Открытие/закрытие сделок; Выставление/удаление отложенных ордеров. Версия утилиты для MT4 здесь: https://mql5.com/8bjjy Настройки Telegram:
Создайте своего бота. Для этого напишите для пользователя @BotFather команду /newbot , и следуйте инструкциям. В результате вы получите Token бота, примерно такой: 1245680170:BBGuDFVkTYIPtjSaXMgQEhdfg7BOQ6rl8xI. Узнайте свой ID в Telegram, для этого напишите пользователю @userinfobot любое сообщение.

This algorithm is based on the grid strategy and performs dynamic position management to make it work on netting accounts. Unlike other robots, this grid system bases its entries on profit over time of the asset instead of using pips. This parameter is the one that corresponds to "Average Distance".
You can trade all 28 major currencies simultaneously. Parameters: +------------------------------------------------------------------+ :-:-:-:-:-:-:-:EXPERT SETTINGS:-:-:-:-:-:-:-: +--------------

This MT5 indicator, Bull Bear Visual MTF (21 Time Frames), summarize the strength color graphic and percentages of power for both Bull and Bear in current market emotion stage which will show you in multi time frames and sum of the total Bull and Bear power strength which is an important information for traders especially you can see all Bull and Bear power in visualized graphic easily, Hope it will be helpful tool for you for making a good decision in trading.

ADX is one of the most versatile indicators, understanding it can help you understand the true nature of movements. It is often used within automatic experts to filter input signals. Unfortunately in its original form it is not immediately understandable. This version aims to simplify its reading by transferring the burden of interpreting its values to the code. The result is a clear graph where it is easy to identify the accumulation and distribution phases, trend phases and excesses. The color

This MT5 indicator, Bull Bear Visual MTF V2, summarize the strength color graphic and percentages of power for both Bull and Bear in current market emotion stage which will show you in multi timeframes (21) and sum of the total Bull and Bear power strength which is an important information for traders especially you can see all Bull and Bear power in visualized graphic easily, Hope it will be helpful tool for you for making a good decision in trading.
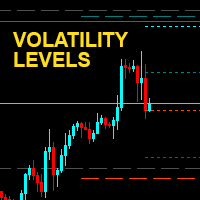
Transfer volatility levels to the chart to understand the nature of the ongoing movements. The levels are calculated based on the volatility recorded in the last few sessions. Easily identify possible targets or swing points for intraday , daily and weekly trading. In addition, the round price levels considered most important are also visible, here the highest trading volumes are usually concentrated. NO REPAINT

MCDX is an indicator based on specific formula to detect Buy and Sell momentum Red Bar means Price go up and Buy momentum. Green Bar means Price go down and Sell momentum" Height of RED bar > 50% means Bull is in control. i.e. RED more than GREEN to go buy. Lower of Green bar < 50% means Bear is in control. i.e. GREEN more than RED to go sell. DARKER RED COLOR - STRONG Up Trend or Strong Bullish Power
LIGHTER RED COLOR - WEAK Up Trend or Weak Bullish Power
LIGHTER GREEN COLOR - STRONG Down

Pivot Point Multi Method MT5 Pivot Point Multi Method MT5 is a fully automatic pivot point indicator and indicate support and resistances (S1,S2,S3,S4,R1,R2,R3,R4) based on four Methods that you can select on of them Pivot point detection and drawing support resistances Methods( Classic ,Camarilla ,Woodie ,Fibonacci)
Pivot Point Multi Method Mt5 is working on all time frames and all currency pairs and gold silver and crypto currencies .
Recommended Setting : Pivot_Method select one of

Description. This EA base on Accelerator oscillator indicator and Parabolic sar indicator. Accelerator oscillator details. set = iAC(_Symbol,_Period); Parabolic sar details. set = iSAR(_Symbol,_Period,0.02,0.2); This is only Buy EA. This EA fixed details in side. Only input is volume. Because i need to keep it simple. Buy order when Accelerator oscillator indicator and Parabolic sar indicator had a signal for buy. Close order when Accelerator oscillator indicator and Parabolic sar indicator had

¡Binance es un intercambio de criptomonedas de renombre mundial! Para facilitar un análisis más preciso del mercado de divisas digitales cifradas, el programa puede importar automáticamente los datos de la línea K de Binance a MT5 para su análisis. Las funciones principales son:
1. Apoye la creación automática de pares comerciales al contado en el departamento de seguridad de divisas, y también puede establecer la divisa de beneficio y la divisa base por separado. Por ejemplo, si ProfitCurren

Pivot Point Fibo RSJ es un indicador que rastrea las líneas de soporte y resistencia del día utilizando las tasas de Fibonacci.
Este espectacular indicador crea hasta 7 niveles de soporte y resistencia a través del Pivot Point utilizando las tasas de Fibonacci. Es fantástico cómo los precios respetan cada nivel de este soporte y resistencia, donde es posible percibir posibles puntos de entrada / salida de una operación.
Características Hasta 7 niveles de soporte y 7 niveles de resistencia
FREE

Este panel muestra noticias actuales de tres fuentes: del sitio web ForexFactory.com (calendario FFC), del sitio web Investing.com y del calendario económico de mql5.com. Puede ordenar las noticias por impacto y por país y mostrarlas en el gráfico con un solo clic. Al mantener presionada la tecla 'Ctrl', puede seleccionar varias 'monedas' o 'impactos' diferentes para ordenar. Además, esta utilidad muestra no solo el pronóstico, sino también los valores reales después de que aparecen en el sitio

Vikings es un asesor experto que utiliza indicadores caseros para operar en función de la volatilidad. Dispone de valores para proteger el capital. Recommended for default settings: EURUSD-H1-1000$ .
Can work on any pair but need optimizations . Discord: https://myx.gg/discord
Live trading: https://myx.gg/mql5 Recommended Broker : ICMarkets (4.8/5 on Trustpilot for 10k+ reviews) Recommended balance per pair : low risk: +3000$, medium risk: +1,000$, high risk: ±500$ Inputs: Strat

Buenas tardes. Hoy presentamos el nuevo indicador PointIntoChannelTOMSON: https://youtu.be/dmgtVwX3nvg
https://youtu.be/Wr7N2WEY8lA este indicador se calcula desde el canal hasta el nivel de desviación del precio hacia la compra y venta, la ventana verde y roja de los indicadores, respectivamente. Cuanto mayor sea el nivel de desviación, mayor será la probabilidad de reversión. Las lecturas del indicador se vuelven a calcular con cada nueva barra y se recomienda usarlo solo como auxiliar

Buenas tardes. UturnAnalysis - para comprobar el funcionamiento de la calidad del indicador
LANZÓ la versión de PRUEBA envío gratuito de señales de reversión sobre la base de este indicador para el mercado de valores y el mercado de valores MICEX
escriba al soporte técnico, yo 777basil@mail.ru , o en los comentarios su dirección de correo electrónico y le enviaremos los datos de la cuenta donde vienen las alertas, de forma gratuita. https://youtu.be/q228LvLec-Y
ponemos varias herramientas

Pyramids es un asesor experto que utiliza mi nuevo sistema piramidal de cierre parcial. Las entradas se realizan en zonas de sobrecompra y sobreventa. Los valores están disponibles para proteger el capital. Recommended for default settings: EURUSD-H1-1000$ .
Can work on any pair but need optimizations .
Discord: https://myx.gg/discord
Live trading: https://myx.gg/mql5 Recommended Broker : ICMarkets (4.8/5 on Trustpilot for 10k+ reviews) Recommended autolot & balance per pair : lo

Este indicador de volatilidad es útil para detectar mercados muertos. Se basa en el índice EVZ, que mide la volatilidad del euro (pero puede aplicarse al mercado de divisas en general). Los valores altos representan un alto volumen/volatilidad en el mercado. Si está por debajo de 7, el volumen es bajo y el riesgo al operar es mayor. Para los operadores que utilizan el método No Nonsense Forex (NNFX), este indicador puede ser útil para hacer backtest de los algoritmos y medir el impacto que el EV

Este indicador forma un canal basado en las lecturas del indicador ADX (índice de movimiento direccional promedio), muestra e informa al comerciante de una reversión del precio en los límites de este canal y también puede informar cuando el precio toca los límites del canal. También dibuja líneas de puntos adicionales, que dependen de las lecturas + DI y -DI del indicador ADX. También tiene una opción para filtrar señales en función de las lecturas estocásticas. El canal dibujado por este indic
FREE

Esta es una utilidad simple y muy efectiva para cerrar pedidos con un solo clic. Lo necesitará si tiene un número de órdenes abiertas en su saldo y toma demasiado tiempo cerrarlas manualmente, lo que podría provocar una pérdida adicional de dinero en la cuenta.
La utilidad consiste en un panel externo con dos botones "Cerrar por filtro" y "Cerrar TODO", que es conveniente para moverse alrededor del gráfico.
Puede configurar la utilidad Cerrar TODO para que las órdenes se cierren tan pronto
MeetAlgo RSI Trade EA Pro MT4 trades using the RSI Indicator. It offers many customizable RSI trading scenarios and flexible position management settings, plus many useful features like customizable trading sessions, a martingale and inverse martingale mode. [ Installation Guide | Update Guide | Submit Your Problem | FAQ | All Products ]
Before buy Pro version? You can buy alternation pro version, our powerfull EA, CAP Strategy Builder EA . This is strategy builder EA. It product h

If you have the opportunity to read the book " Trend Trading - A Seven-Step Approach to success " by Daryl Guppy, you will have a great deal of information about how to "read" the market. In his book Daryl show, among other things, how can we use a visual tool to measure the volatility and trend between Long and Short-term periods: The GMMA - Guppy Multiple Moving Averages .
Instead of using his original idea of having 12 Exponential Moving Averages in your chart - which could be very CPU-dem
FREE

The signal trend indicator Sliding Step . The appearance of a signal in the form of an arrow gives a recommendation to open a deal. The appearance of scissors warns of a changing in the situation and gives a recommendation on fixing profit (loss).
Settings:
Trend filter (period) - the filter restricts trade in transitional stages and U-turns. It is recommended that you actively work with the filter settings. The upper limit of the settings depends on the volatility of the instrument.
FREE

Bar Countdown es un simple indicador para MetaTrader 5 que muestra el tiempo restante de cada vela.
Se puede colocar en cualquier esquina del gráfico o cerca del cierre del precio.
Elija el formato del contador entre HR:MIN:SEC o MIN:SEC
¡¡¡Es muy fácil de usar, se establece el color, el tamaño y la posición en el gráfico del contador y ya está!!!
¡La cuenta atrás comienza ahora!
Actualizaciones:
28/02/2021; v1.0: Versión inicial
16/03/2021; v1.1: Pequeños cambios en el có
FREE

"Support or Resistance Alert Broken" es una herramienta sencilla y muy intuitiva que permite crear o eliminar soportes y/o resistencias horizontales y de tendencia con un simple click. Cuando la linea de soporte o resistencia son rotas por el precio de cierre al finalizar la vela actual, la herramienta "Support or Resistance Alert Broken" enviará una alerta con sonido, así como también una notificación a la aplicación de celular de MT4 ó MT5. Esta herramienta puede enviar alertas de varios pares

Secret Average Trade : this is a revolutionary system unlike any other, the strategy uses algorithms such as grids, averaging, hedging and partially uses martingale algorithms. Trading is carried out on 17 currency pairs simultaneously and uses timeframes: 9. Fully automatic trading with the calculation of entries based on a system of various Trends and also supports reverse trading. Benefits
Partial closure to reduce the load on the deposit. Averaging orders, which are required to close past

The EURUSD looking at the Majors is a Multipair System for operate the EURUSD
!!!!!IMPORTANT!!!!! THIS EA IS FOR USED IN EURUSD ONLY. !!!!!IMPORTANT!!!!!
This system detects a multi-pair entry point based on the value of the majors and operates that entry in the EURUSD with its own and efficient algorithm. All tickets have an SL and TP and use optimized trailing. You have to use the name of the value in your broker, in the corresponding inputs.
Very stable growth curve as result

A small utility displays the time in five time zones. You can customize the display of one to five time zones. For each time it is configured: show or not; name; time offset from GMT; color; In general settings, you can change: date / time format ("hh: mi", "hh: mi: ss", "yyyy.mm.dd hh: mi", "yyyy.mm.dd hh: mi: ss") font name; font size; offset from the left edge of the chart; offset from the top edge of the chart;
FREE
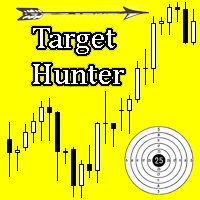
The indicator determines the most important component of any trading system - the possible exit point from the transaction.
As the price moves, depending on the market situation, the indicator builds goals. The target becomes relevant when the price starts moving towards the target. If the movement is strong, then it may take a certain number of targets to stop or reverse price. The accumulation of targets is most likely able to stop the price. Some goals are executed several times.
But the

The Relative Strenght Index presented to the world in 1978 by J. Welles Wilder Jr. in his book " New Concepts in Technical Trading Systems " is widely used around the world in several ways, not only with the traditional approach of Overbought and Oversold states, which in several cases and depending on the assets and timeframes it just simply doesn't work anymore . BUT, this indicator has its value when used, for instance, looking for divergences between its measuring system and the Prices appea

After purchasing, you can request and receive any two of my products for free!
После покупки вы можете запросить и получить два любых моих продукта бесплатно! Expert Advisor for manual and automatic trading on the trend lines of the indicator Bollinger Bands. The Expert Advisor draws trend lines from the middle band for a specified number of candles. Important!!! - you need to test the adviser in visual mode.
You may be interested in my other products: https://www.mql5.com/ru/users/vy
FREE

The indicator makes calculations based on data obtained from one of seven (7) moving averages and colors the chart.
Simple moving averages are those that have only one important calculation parameter - the period.
The shift in the indicator is not used.
There is a shift trick setting, it is used to smooth the result of calculations. You can see the changes if you reduce this parameter to 1 (minimum value).
shift trick must always be less than the period value.
Available averages:
MA
FREE
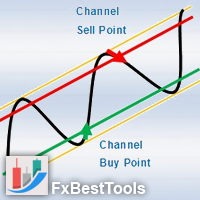
Channels Indicator is an All-In-One Indicator with a powerful calculation engine. The Indicator contains 4 different and usual methods for finding channels on the market. Indicator is powered by a visual interface and with various selections of alerts and notifications.
Testing Indicator : Strategy Tester does not respond to your clicks on panels (This is metatrader tester limitation). Thus input your desired settings on the indicator pre-settings and test.
Using Indicator :
Display

CAP Moving Average Pro EA trades using the Moving Averages Indicator. It offers many customizable Moving Averages trading scenarios and flexible position management settings, plus many useful features like customizable trading sessions, a martingale and inverse martingale mode. [ Installation Guide | Update Guide | Submit Your Problem | FAQ | All Products ]
Before buy Pro version? You can buy alternation pro version, our powerfull EA, CAP Strategy Builder EA . This is strategy b

Experto asesor basado en el Indicador - Bollinger Bands Dado que no es sencillo predecir en qué momento se producirá la reversión de la tendencia este Experto puede colocar órdenes adicionales a diferentes distancias de la primera orden, y con diferentes lotes, de manera que permite promediar las posiciones y alcanzar más fácilmente la toma de beneficios. Dado que las condiciones de sobre-compra o sobre-venta aplican a cualquier par de divisas del mercado Forex, este experto se puede utilizar co
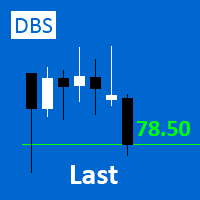
A small utility displays the value of the last price (Last) to the right of the chart. The Last price is the price at which the last deal was executed. Utility is convenient to use for screens with small print, for visual observation of the price level (value) or for people with poor eyesight. You can customize: Growth color Fall color Text font Font size Offset text
FREE
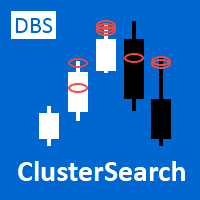
Professional traders know that volume is the fuel for price movement. Large players try to hide their true intentions, but they can be recognized by volume bursts. The standard vertical volume does not show us specific price levels, but the cluster volume and especially its surges provide a very clear picture and specific price levels (areas).
The DBS Cluster Search indicator searches for clusters of the specified size in tick data and highlights them with colored figures on the chart. These
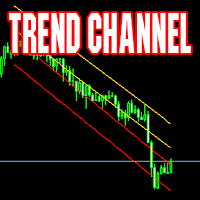
Channel indicator. Calculated dynamically. Suitable for both working in the direction of the trend and inside the channel. Excellent results when working on timeframes from 4H towards the center of the channel.
Example of use: when the price touches one of the extreme lines - opening a deal in the center of the channel with a take profit on the nearest middle line of the indicator. MT4 version The indicator can be used in expert advisors (4 buffers), receiving data in a standard way. Support:

Asesor experto basado en una estrategia de acción de precio ampliamente testeada El AE ya incorpora en su programación todas las variables, es suficiente con dejarlo correr en el gráfico con los valores que incorpora por defecto.
DESCRIPCIÓN DE LA ESTRATEGIA La acción del precio en trading analiza el rendimiento de una divisa para predecir lo que podría hacer en el futuro. Este AE analiza una serie de patrones característicos que se utilizan para identificar la tendencia de precios más

The indicator plots dynamic POC, VAH and VAL levels for a specified period from tick data. POC - Point Of Control, the price at which the maximum volume has accumulated over a certain period of time (POC in the volume profile). VA - Volume Area, the zone of the fair value of the asset. VAH - Volume Area High. VAL - Volume Area Low. The DBS_DynamicLevels indicator plots dynamic levels where the calculation point is the maximum volume level (POC) and zone VAH / VAL. The indicator shows the history

We at Minions Labs always like to defy the stablished systems and beliefs trying new things and new ways of seeing and interpreting the Market Data. And all starts with the following question...
WHAT IF...
You give more relevance and focus on the Wicks/Shadows on the candlesticks? And Why? In volatile markets wicks play an important role on determining who is winning the the fight between Bulls and Bears , and more than that, Higher and lower wicks can present you with a good status of the cu
FREE

Coiote Book Balance é um indicador que monitora o livro de ofertas e indica de maneira simplificada o níveis de renovação de ordens agrupados no timeframe gáfico, mostrando quanto o maior lado renovou e a diferença dessas renovações. Além disso, é possível visualizar em quais preços estão as maiores ordens da cada lado, o preço teórico dessa liquidez e a quantidade de lotes em tempo real. Para correto funcionamento do indicador é preciso que o livro de ofertas seja aberto antes da inclusão do in

Order Entry - Probably the easiest way to enter an order If you like this perhaps you might consider buying the pro version https://www.mql5.com/en/market/product/64353?source=Site+Profile+Seller An aid for entering orders. Features: * Drag & drop tool to adjust price, stop loss and take profit levels. * Calculates lot sizes automatically based on risk entered, currency pair and stop loss / price levels.
Description It enables you to visually enter a trade's price, stop loss and take profit
FREE

产品介绍 这是款非常简单有效的EA , 该EA使用布林带、AO指标以及斐波那契回调线的组合而进行工作。产品的核心理念为市场情绪的惯性交易。该EA是不考虑趋势方向的,适用于市场振幅始终的产品,多数直盘货币对均可试用。白银以及股指类慎用。
适用品种: GBP/USD JPY/USD EUR/USD
联系我: 知乎:https://www.zhihu.com/people/maysen-30 微信:maysen55
参数 介绍 开仓分数 BB、AO指标打分高于多少开仓 幻数 交易标识 布林带周期 周期,建议考虑最近5天以上数据 内偏移 偏移指数 外偏移 偏移指数(要大于内偏移) 开仓类型 固定值、资金比例 开单比例 资金比例开仓百分比 最小开仓量 固定值开仓手数 回调线观察柱数 超过柱数不再进行回调线划线
FREE
El Mercado MetaTrader es la única tienda donde se puede descargar la versión demo de un robot comercial y ponerla a prueba, e incluso optimizarla según los datos históricos.
Lea la descripción y los comentarios de los compradores sobre el producto que le interese, descárguelo directamente al terminal y compruebe cómo testar el robot comercial antes de la compra. Sólo con nosotros podrá hacerse una idea sobre el programa, sin pagar por ello.
Está perdiendo oportunidades comerciales:
- Aplicaciones de trading gratuitas
- 8 000+ señales para copiar
- Noticias económicas para analizar los mercados financieros
Registro
Entrada
Si no tiene cuenta de usuario, regístrese
Para iniciar sesión y usar el sitio web MQL5.com es necesario permitir el uso de Сookies.
Por favor, active este ajuste en su navegador, de lo contrario, no podrá iniciar sesión.