YouTube'dan Mağaza ile ilgili eğitici videoları izleyin
Bir ticaret robotu veya gösterge nasıl satın alınır?
Uzman Danışmanınızı
sanal sunucuda çalıştırın
sanal sunucuda çalıştırın
Satın almadan önce göstergeyi/ticaret robotunu test edin
Mağazada kazanç sağlamak ister misiniz?
Satış için bir ürün nasıl sunulur?
MetaTrader 5 için yeni Uzman Danışmanlar ve göstergeler - 92

This Expert Advisor will change how you manage your risk forever.
The EA automatically calculates your position size by either looking at your balance or equity. You need simply type in how much risk you want to have on that particular trade, move your TP line and SL line and it does the rest. Click buy or sell and it enters the position and places your TP/SL for you. It does the same thing for pending buy limits or sell stops. Feel confident knowing your risk before entering your trade! Mo
FREE

Dark Sprint is an Indicator for intraday trading. This Indicator is based on Trend Following strategy, also adopting the use of the atr to determine the right volatility. We can enter in good price with this Indicator, in order to follow the strong impulse on the current instrument.
Key benefits
Easily visible sprint lines Intuitive directional arrows Automated adjustment for each timeframe and instrument Easy to use even for beginners Never repaints, never backpaints, Not Lag 100% compati

One of the best tools for analyzing volume, Weis Wave was devised by David Weis to facilitate reading the directional flow.
For the disciples of the Wyckoff method, this means an evolution, facilitating a predictive reading of the market, always looking for Accumulation and Distribution zones for traded assets.
For better understanding, in this indicator we try to cover every reading of EFFORT (traded volume) versus RESULT (price change). Thus, you can apply the indicator on the chart twice

The SSD With Histogram is a custom forex indicator for Metatrader 5 that shows a slow stochastic line, a signal line, and a histogram that reflects the difference between the slow line and the signal line. The indicator and its elements are displayed in a separate window just below your main trading chart.
parameters: k period; 5 D period; 3 time frame: m1 m5 m15 m30 h1 d1
FREE
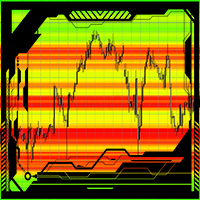
J.M.T.I
This indicator automatically shows a level or support and resistance in the currant market. Can be used on any time frame Can be used on any currency pair Works on the active bars in the window To add more bars one can simply zoom out. Red zones can be strong liquidity pools. Green zones usually is where an possible break out might occur. The higher the contrast of the colors the stronger the support or resistance levels will be. The indicator has an option to refresh on each tick

Unlike any indicator you’ve seen, Trend Volley is an advanced purpose-built trend trading charting system that has been successfully used in nearly every tradable market. It is unique in many ways. Trend Volley’s internal trend detector algorithm studies the market and dynamically chooses the right values for the internal parameters, to adapt to the price and to decrease consecutive trend failures. It can be applied to any financial assets: forex, cryptocurrencies, metals, stocks, indices. ITS

Binary MA Cross MA Cross indicator by 4Umbella
Create for traders both experienced and inexperienced to use it because it is a basic indicator
How to use : 1. MA Fast : Moving Average fast (Period 4 upto 50) 2. MA Middle : Moving Average Middle (Period 10 upto 100) 3. MA Slow : Moving Average Slow (Period 50 upto 200) to control trend markets.
and trader can be set for Apply to price (Close, Open,Low,High,Median,Typical,weightd)
For alert you can set to alert Next bar or instant bar

Why choose GBot? Very fruitful EA that trades gold, it can be tested in this site and contact me if you need the source code and the application file. The strategy used is used internally with minimum data to be as input from the user. In the past 10 years the EA has been able to maintain the minimum of 30% return per month. Well in the past 3 - 5 years it obtained very impressive results. The maximum balance drawdown in the past 10 years has been around 5 %. Advantages Controlled risk. Good ret
Uyarı: MetaQuotes'un son değişiklikleri nedeniyle sinyal abonelik işlemlerinin kopyalanması ve çoğaltılması artık kısıtlanmıştır. Bu nedenle, Signal Multiplier EA MT5 artık sinyal aboneliğinizin işlemlerini çoğaltamaz !!!
Signal Multiplier EA MT5 yalnızca başka bir parti büyüklüğü çarpanı değildir. Hesabınızdaki işlemlerin lot büyüklüğünü uzman danışmanlardan veya manuel girişlerden çarpmanın yanı sıra, işlemlerinizi aktif olarak izleyecektir. EA, her yeni orijinal ve çoğaltılan ticaret
Comprehensive on chart trade panel with the unique ability to be controllable from mobile as well. Plus has a library of downloadable configuration, e.g. exit rules, extra panel buttons, pending order setup and more. Please see our product video. Works with all symbols not just currency pairs. Features On chart panel plus controllable from free app for Windows, iPhone and Android Built-in script engine with library of downloadable configuration, e.g. add 'Close All Trades in Profit' button, exit

Bu gösterge, farklı zaman ölçeklerinde birçok grafiğin gözden geçirilmesini daha hızlı ve daha kolay hale getirmek için tasarlanmıştır. Birden fazla grafikte Zaman ve Fiyatı İzleyin Bir grafikteki Sembolü Değiştirin ve aynı sembolün diğer tüm çizelgeleri de değişecektir. Kullanımı kolay, ustalaşması hızlı Gösterge, aynı Sembolde açık olan diğer tüm grafiklerde fare işaretçisinin geçerli grafikte bulunduğu fiyatı ve zamanı belirlemenize olanak tanır. Bu, birden fazla grafikteki bilgileri hızlı bi

(Kripto Para Birimi Grafikleri)
Belirttiğiniz çubuk sayısı kadar geçmişi getirir ve anlık verileri direkt olarak göstermeye başlar.
Tüm zaman dilimlerinde çalışma imkanı sağlar.
Birden çok sembolle çalışmanıza izin verir.
Bu uygulama bir arka plan hizmetidir.
Piyasa izleme ekranında "F" ile başlayan tüm sembollerin geçmişini indirir ve kene verilerini gösterir.
Binance Vadeli İşlemlerinin gerçek zamanlı ticaret verilerini otomatik olarak MT5'e aktarır.
Programı kullanm

(Kripto Para Tabloları)
Binance Future'daki tüm sembolleri özel sembollere kaydeder.
Binance Future'daki sembollere "F" önekini ekler.
Binance Future'daki sembollerin takip edilebileceği alt yapıyı oluşturur.
Araçlar menüsü >> Seçenekler >> Uzman Danışmanlar'dan WebRequest'e izin vermeli ve URL'yi eklemelisiniz: https://fapi.binance.com
komut dosyasına çift tıklamanız yeterlidir.
Tüm listeye saniyeler içinde sahipsiniz.
https://www.mql5.com/en/market/product/68694 linkteki ürü
FREE

The arithmetic mean or median can be used to determine the measure of the central trend of a time series. Both methods have some disadvantages. The arithmetic mean is calculated by the Simple Moving Average indicator. It is sensitive to emissions and noise. The median behaves more steadily, but there is a loss of information at the boundaries of the interval. In order to reduce these disadvantages, pseudo-median signal filtering can be used. To do this, take the median of a small length and rec

The EA is based on a scalping strategy in a calm market time. In quiet times, the price on the chart is almost always in the Flat, and the EA trades in the flat. The EA provide a variety of filters to filter out trend situations and trade only during flat price periods. Each trade uses a stop loss and take profit. Also, smart filters for fixing the transfer of stops to profit. To create a strategy, we used historical data with a history quality of 99.9%. The EA has the following features: Uses a
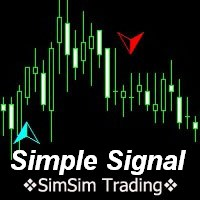
MT5 trend indicator works without redrawing. Provides signals for entering trades, works on charts of any instrument. Трендовый индикатор МТ5, работает без перерисовки. Выдает сигналы для входа в сделки, работает на графиках любого инструмента. Input parameters are for styling and messages only. / Входные параметры только для оформления и сообщений. All original signal calculations do not need additional parameters. / Все оригинальные расчеты сигнала, не нуждаются в дополнительных параметрах.
In order to detect "Big activity", new elements of the VWAP standard indicator were incorporated into this project.
In short, the plotted lines represent the moving average with EMA[VWAP]=VWAP[EMA].
Averages of the prices have been combined with volumetric weights and exponential decay.
Also, it was included the same weights to compute the standard deviation.
The parameter called as "strain" is a linear constant shifting the result (strain)xSD(VWAP).
So, a any set of bands can be plotted.
An indicator of pattern #49 ("Triangle, symmetrical") from Encyclopedia of Chart Patterns by Thomas N. Bulkowski. Parameters: Alerts - show alert when an arrow appears Push - send a push notification when an arrow appears (requires configuration in the terminal) PeriodBars - indicator period K - an additional parameter that influences the accuracy of pattern shape recognition ArrowType - a symbol from 1 to 17
ArrowVShift - vertical shift of arrows in pixels ShowLevels - show lines ColUp - c
An indicator of patterns #39 and #40 ("Rounding Tops" and "Rounding Bottoms") from Encyclopedia of Chart Patterns by Thomas N. Bulkowski. Parameters: Alerts - show alert when an arrow appears Push - send a push notification when an arrow appears (requires configuration in the terminal) PeriodBars - indicator period K - an additional parameter that influences the accuracy of pattern shape recognition. Changes from 0 to 1 ArrowType - a symbol from 1 to 17 ArrowVShift - vertical shift of arrows
An indicator of patterns #11 and #12 ("Diamond Tops" and "Diamond Bottoms") from Encyclopedia of Chart Patterns by Thomas N. Bulkowski. Parameters: Alerts - show alert when an arrow appears Push - send a push notification when an arrow appears (requires configuration in the terminal) PeriodBars - indicator period K - an additional parameter that influences the accuracy of pattern shape recognition ArrowType - a symbol from 1 to 17 ArrowVShift - vertical shift of arrows in pixels ShowLevels - s
An indicator of patterns #37 and #38 ("Rectangle Tops" and "Rectangle Bottoms") from Encyclopedia of Chart Patterns by Thomas N. Bulkowski. Parameters: Alerts - show alert when an arrow appears Push - send a push notification when an arrow appears (requires configuration in the terminal) PeriodBars - indicator period VertexCount - the number of tops and bottoms: 2, 3, 4. ArrowType - a symbol from 1 to 17 ArrowVShift - vertical shift of arrows in piхels ShowLevels - show levels ColUp - colo
An indicator of patterns #7 and #8 ("Bump-and-Run" and "Bump-and-Run Reversal") from Encyclopedia of Chart Patterns by Thomas N. Bulkowski. Parameters: Alerts - show alert when an arrow appears Push - send a push notification when an arrow appears (requires configuration in the terminal) PeriodBars - indicator period K - an additional parameter that influences the accuracy of pattern shape recognition ArrowType - Character: from 1 to 17 ArrowVShift - vertical shift of arrows in pixels ShowL

This indicator displays fractal symbols and bars Use this indicator to show different symbols for bearish and bullish fractals: Choose from 144 symbols (refer to table below) Colors, size and offset of fractals can be modified Fractal price bar or candle color can be changed Hide fractals and show fractal price bar only Frequency in fractal calculation can be changed
How to use 1. Select which symbols to use for bearish and bullish fractals; 2. Select which colors to use for bearish and bulli
FREE

You can think of these indicators as moving pivot points. MasterChartsTrading Price Action Indicators show good price levels to enter or exit a trade. The Blue indicator line serves as a Bullish Trend setter. If your instrument closes above the Blue line, we think about going Long (buying). When your trading instrument closes below the Red line, we think about Shorting (selling). It is very easy to read price action if you have a reference point. These support/resistance lines are there to help

This reliable, professional trade copier system is without a doubt one of the best on the market, it is able to copy trades at very fast speeds from one master account (sender) to one or multiple slave accounts (receivers). The system works very fast and mimics the master account a full 100%. So changing stop losses, take profits, pending orders on the master account is executed on the slave accounts too, like each other action. It is a 100% full copy (unlike many other copiers who only copy ma

DYJ Tradays Economic Calendar is calendar Indicators of macroeconomic events for fundamental market analysis. Therein you will find financial news and indicators for the largest global economies – from the US and the EU to Australia and Japan, a total of 23 economies, involving more than 60 currency pairs. More than 800 macroeconomic indicators and events are collected from public sources in real time. Historical, current and forecast values, as well as importance characteristics are available

EMA Crossover Pro MT5 this EA uses two exponential moving average crossover, a slow ema, and a fast ema on which it takes buy/sell decision.
A default ema configuration is 12 and 35 where 12 is the value of slow ema, and 35 is the value of fast ema.
Expert advisor parameters:
stop loss (greater than 40, but some brokers accept stop loss under 40)
take profit (greater than 40, but some brokers accept stop loss under 40)
trailing_stop (set it as 0 for disabling trailing stop)
slow ema (21 by
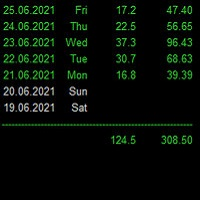
Statistics for each day
Индикатор показывает статистику - итоговую конечную прибыль/убыток по каждому отдельному торговому дню с учетом свопов и комиссий. Параметры : Dey - количество анализируемых дней; Weekday color - цвет будних дней; Weekend color - цвет выходных дней; Loss color - цвет убытка; font_size - размер шрифта; font_face - название шрифта; Для удобства просмотра статистики за большие временные периоды, при инициализации индикатор выгружает данные в Statistics.csv
Созданный файл и

This reliable, professional trade copier system is without a doubt one of the best on the market, it is able to copy trades at very fast speeds from one master account (sender) to one or multiple slave accounts (receivers). The system works very fast and mimics the master account a full 100%. So changing stop losses, take profits, pending orders on the master account is executed on the slave accounts too, like each other action. It is a 100% full copy (unlike many other copiers who only copy ma
FREE

This is a tool created for scalping. it can generate pending orders with 4 input: 1. Volume : Lot for the Pending Orders 2. Distance : Distance within the Orders in Points 3. Total Order : Total Generated Orders 4. Take Profit : TP for the generated Orders in Points 5. Stop Loss : SL for the generated Orders in Points It also have another tools which can monitor the floating and close at defined profit using Closed at Profit Input What's new: - Stop Loss in Pip
FREE

Let the KING trades!!!
KING of TRADES is a trading system that can be optimized according to: - Trend indicator: Ichimoku Kinko Hyo (either in different timeframe) - Trigger system: Fractals - Filter - trade in: Stochastic Oscillator (values and upper and lower limits) - Stops definition: ATR (period and long and short takeprofit and stoploss) - General: magic number, autolot (% balance), symbol digits, max spread and max number of openned orders Default configuration on EURUSD, H1.

Get a free complementary EA after your purchase! Contact me and ill provide it for you.
MT4 Version: https://www.mql5.com/en/market/product/61215
Some users are very comfort 2 able keeping their trades for ages, while other users are happy to get the least and leave :)
If you cannot wait on your trades, then this expert will be the best for you!
The expert tries to enter trades on a high probability of success, and in most cases it do catch the right wave. If not , don't worry

Super Bollinger EA is an exclusive expert advisor that uses Bollinger Bands as indicator. It´s possible to configure the EA to trade as a low frequency or high frequency one - Scalping expert advisor. A Stochastic Oscillator filter is implemented to have some specific trades on Bollinger Bands. Takeprofit and Stoploss are calculated according to Bollinger Bands width or even with fixed TP and SL ( in points ). A trail and trade out system can also be configured and optimized. A number of orders

O Indicador BOPCoiote é uma releitura do indicador Balance of Power proposto por Igor Livshin em Agosto de 2001, publicado na Stocks and Commodities Magazine. Uma média móvel de 14 períodos é recomendada para gráficos diários. Embora o número de períodos possa variar dependendo da natureza do mercado e dos prazos.
O nível em que ele agrupa seus fundos e topos é considerado uma das propriedades mais importantes do indicador BOP.
Durante as tendências de alta, suas máximas frequentemente tocam
OCTOBER SALE!!! OCTOBER SALE!!! OCTOBER SALE!!!
Heiken Ashi Short Grid is an EA that is using the Heiken Ashi Indicator for the initial trade and uses grid trades when the the trade is on the losing side.
OPTIMIZED SETTINGS ARE AVAILABLE IN THE COMMENT SECTION!!! Optimized Currency Pairs: - AUDCAD - USDCAD - AUDUSD
Parameters: - Initial Volume 1 = 0.01 Lot will not open a martingale system 3 = 0.03 Lot for every $10,000 - Grid Size - Multiplier - Take Profit HEIKEN ASHI SETT

EQUITY DRAWDOWN MONITOR This is a simple mt5 advisor that monitors the drawdon levels Features:
Easy to use Useful for money managers How to Use Load the EA once a single chart Type the maximum drawdown desired in inputs
Leave the EA alone and never close that chart The EA monitors all trades and magic numbers in your account.
Input Parameter Drawdown Percent: Maximum drawdown in percentage terms allowable in the account. When the drawdown level is surpassed, the EA will close all tra

AW Süper Trend - Bu, en popüler klasik trend göstergelerinden biridir. Basit bir ayarı vardır, yalnızca trendle çalışmanıza izin vermez, aynı zamanda bu gösterge tarafından hesaplanan zararı durdur seviyesini de gösterir. Faydalar:
Aletler: Döviz çiftleri , hisse senetleri, emtialar, endeksler, kripto para birimleri. Zaman dilimi: М15 ve üstü. İşlem süresi: 24 saat. Mevcut trendin yönünü gösterir. Durdurma kaybını hesaplar. Ticaret ile çalışırken kullanılabilir. Üç tür bildirim: push,
FREE

The indicator identifies when a divergence occurs between price and an indicator or oscillator. It identifies both regular and hidden divergences. Combined with your own rules and techniques, this indicator will allow you to create (or enhance) your own powerful system. Features
Can detect divergences for the following oscillators/indicators: MACD, OsMA, Stochastics, RSI, CCI, RVI, Awesome, ADX, ATR, OBV, Composite index, MFI and Momentum. Only one oscillator/indicator can be selected. Draws
FREE

The trend allows you to predict the price movement and determine the main directions of the conclusion of transactions. The construction of trend lines is possible using various methods suitable for the trader's trading style. This indicator calculates the parameters of the trend movement based on the von Mises distribution. Using this distribution makes it possible to obtain stable values of the trend equation. In addition to calculating the trend, the levels of possible deviations up and dow

The indicator Supply Demand RSJ PRO calculates and plots the "Supply" and "Demand" zones on the graph, identifying the type of Zone (Weak, Strong, Verified, Proven) and in case of retests of the Zone it shows how many times it was retested. "Supply" Zones are the price zones where more supply than demand has occurred, driving prices down. "Demand" Zones are the price zones where more demand than supply has occurred, pushing prices up.
Classification of zones
Weak: Price region which, if re-te

//////////////////////////////////////////////// ////////////////////////////////// This indicator uses polynomial regression to plot three channels and six lines accordingly. The first channel and its borders with a large period, the second with an average and the third with a small period. The setup is simple - you only need to specify the colors and enable / disable the display of price labels. It is also very easy to understand the readings of this indicator. Channel lines are used to set s

Volume is a widely used indicator in technical analysis, however there is a variation that is even more useful than Volume alone: the Moving Average of Volume.
It is nothing more than a moving average applied to the popular Volume indicator.
As the name says, Volume + MA serves to display the transacted volume (purchases and sales executed) of a certain financial asset at a given point of time together with the moving average of that same volume over time.
What is it for? With the Volume
FREE
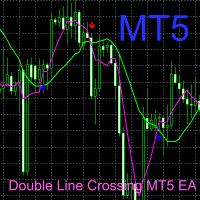
This is based on the double moving average cross and arrow mark under the preparation of custom indicators EA.
When the blue arrow appears, make a long order.
When the red arrow appears, short the order.
When the pink line crosses the green line upward, the pink line is above, the green line is below, the golden fork appears, and the blue arrow appears.
When the pink line crosses the green line downward, the pink line is below and the green line is above. There is a dead fork and a red

Arielfx Smart Money Imbalance Indicator
What is Imbalance? imbalance noun: Lack of proportion or relation between corresponding thing
We Use Imbalance as a part of our trading system. When an imbalance is filled or price comes into it we often see big reactions and moves from those areas!
How can you use it?
You can take a trade an scalp reactions off of imbalance zones

This indicator displays the spread with extra options Simple and easy to use and fully customisable: View as Pips or Pipettes Chart symbol can be hidden Text display can be changed Change colour and text styles Add or hide a decimal point Spacing options between inputs Default screen positions Screen position inputs
Pro version includes: Drag and drop box on the screen Add an alert when the spread is too high Alert colours for text and text box changeable
How to use 1. Simply use the defaul
FREE

This Expert Advisor is a Combination of Averaging & Martingale.
1. Trend : to define what position the EA should Trade - LONG SHORT ( EA will open both BUY and Sell ) - LONG ONLY ( EA will only open BUY ) - SHORT ONLY ( EA will only open SELL ) 2. Distance between Each Positions - Point value of each Positions 100 : - if 100 Points reached between the last position and current price, new Position will be open by EA - EA will set up a higher volume for this new Position - new TP calculated u
An indicator of patterns #47 and #48 ("Triangle, ascending" and "Triangle, descending") from Encyclopedia of Chart Patterns by Thomas N. Bulkowski.
Parameters: Alerts - show alert when an arrow appears Push - send a push notification when an arrow appears (requires configuration in the terminal) PeriodBars - indicator period K1 - an additional parameter that influences the accuracy of pattern shape recognition K2 - an additional parameter that influences the accuracy of pattern shape recogn

Monkey Springs EA is an expert advisor that analysis two moving averages difference (stretch) . It´s possible to trade on trend or reversal. It´s possible to configure each moving average and its difference value - stretch, as soon as a stochastic and OBV filter . Takeprofit and stoploss are configured according to a percent of the moving averages difference. A trail system can also be configured, according to moving averages and stochastic. It´s also possible to configure a average

Эксперт торгует по сигналам индикатора SystZ Trend Lines . Входные параметры: Take in atr, 0 - do not use a take profit - размер тейк профита по ATR (50) , рассчитанному на текущем таймфрейме. Если значение параметра равно 0, то не используется; Stop in atr, 0 - do not use a stop - размер стоп лосса. Если значение равно 0, то не используется; Risk factor, volume eq Equty*Risk factor/1000 - используется для расчета размера рабочего лота, который вычисляется как Эквити*Risk factor/1000. Нап
FREE

Indicator works with two moving average, when this moving averages cross, then change of colors. You can change the color both moving average and chage all setup if you want, like a native moving average . If you want to put this indicator, all buffers are disponible and their are work fine. In case of doubt or any question don't exitate to write me, I'll read and aswer all the question.

Sends price alerts conveniently to your Android/IOS device. Make sure push notifications are enabled in Metatrader settings and the PC/VPS is online 24/7. Price levels are updated automatically, but you can modify them in global variables, if needed. Suitable for any market instrument, but if notifications are too frequent, increase point value of the indicator parameter.
FREE

With my custom built formula, you can visualize the market similar to displaying a heat map; with color showing at a glance the strength of the current trend, and the bar length showing the intensity of current movement. In more detail: Length of the histogram bar shows the average bar size of the last period, and color (from red to blue) shows the strength of upward or downward movement. Purple zones can indicate a change into a new trend. Bar period is adjustable so as to measure larger or sm
All words I spent time to describe this EA trading system does not worth a download that you can do to test this expert advisor.
MC Datrix EA is a trading system that combines trend filter, trigger points with specific conditions, smart takeprofit and stoploss calculations, a break orders system based on smart reversal trend.
Trend filter was developed with TRIX indicator and also can be enabled or not.
Trigger points were specially projected with MACD indicators values and signals. Tr

" A successful trading means being able to master the art of timing, the art of execution and the art of protecting your capital in a very simple and faster way ". HermanGhost Manager is the most powerful tool that's actually designed to help you win in terms of executing different operations BUY,BUY STOP, BUY LIMIT, SELL,SELL STOP, SELL LIMIT, STOP LOSS, TAKE PROFIT, BREAKEVEN, TRAILING STOPS, all can be executed in seconds.
features : The intuitive interface One time configuration One click
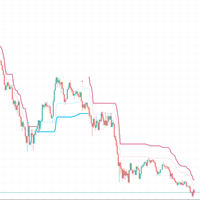
Using ATR to judge the trend, the dotted line is a short-term trend, and the solid line is a stable trend
Set different parameters according to different products. In most cases, please use the default parameters
Time cycle 5 minutes 15 minutes 1 hour
This indicator performs well in monetary products and gold
Index without future function
The entity part of the K line exceeds the entity trend part, which represents the trend conversion. Please wait for the K line to finish
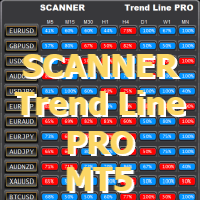
Trend Line PRO göstergesi ile çalışır ve Optimizer Yardımcı Programı tarafından oluşturulan dosyaları ayarlar Ek programlar indirebilirsiniz: burada
Tarayıcı, M5'ten mn1'e kadar tüm çiftler ve zaman dilimlerinde Trend Line PRO göstergesinin yeni sinyallerini almak üzere tasarlanmıştır
Tarayıcının çalışabilmesi için bir göstergeye sahip olmanız gerekir. SCANNER Trend Line Pro'nun en büyük avantajı, her bir çift ve zaman dilimi için ayrı bir set dosyası kullanma yeteneğidir. Ek tarayıcı pence
FREE

Piyasalar yuvarlak rakamları gerçekten sever ve genellikle düşen bir piyasada destek veya fiyat yükselirken direnç olarak hareket ederler. Bu gösterge, Yuvarlak değerlerde fiyat seviyeleri çizmek için tasarlanmıştır. Bunu otomatik olarak yapar, ancak bunu geçersiz kılma ve görmek istediğiniz seviyeleri belirleme seçeneğiniz de vardır. Yuvarlak bir seviye 10'luk adımlar kadar basit olabilir, yani 10, 20, 30 vb. Gösterge, her biri farklı formatta olan Major ve Minor olmak üzere iki sınıf çizgi çiz

Aggression Wave PRO is an indicator developed to monitor the divergence, strength, and continuity of the aggression volume of sell and buy negotiations. The Agrression Wave PRO has features that allow you to view beyond the accumulated delta volume of the day.
Note: This indicator DOES NOT WORK for Brokers and/or Markets WITHOUT the type of aggression (BUY or SELL). Cryptocurrencies and Forex do not provide this type of information, that is, it does not work with it.
Operation
It is pos

This scalper helper helps you manage your trader by placing AUTOMATIC stops and takes. When you enter a position and the market quickly turns against you, it's pretty boring isn't it? but with this helper your StopsLoss and TakeProfit will be AUTOMATIC, just configure how many pips you want and that's it. Besides, the helper has AUTOMATIC BreakEven, you just choose the amount of pips you want to place, and finally it contains a stop protector, whenever a candle closes in profit in your favor, it

ScalpJumping July 50% OFF Hey, haven't you tried it yet? What are you waiting for???? Try yoursef. It is a buy scalper robot with a recommended risk of 6%.This is not magic, it works well in a bullish context. you can do a back test yourself and check its operation. It is a multi-currency robot although it was tested with greater success on the EURUSD pair. Recommendations: currency EURUSD, timeframe 5M, Stop Loss 60, Take Proffit 60, Trailing Stop 0, Dynamic Lots true although you can tes

The Donchian Channel Channels are among the most popular tools of technical analysis, as they visually convey to the analyst the limits within which most price movement tends to occur. Channel users know that valuable information can be obtained at any time, whether prices are in the central region of a band or close to one of the border lines.
One of the best known techniques to explore these concepts is Bollinger Bands. However, John Bollinger was not the only one to research the applicatio
FREE

Two Factor Customizer is an fully custimizable Expert Advisor. You can choose multiple parameters that act as a trigger to execute a buy or sell order. Additionally you can choose a previous step (Two Factor), where you can also combine multiple parameters previous to those configured for the buy and sell orders. The parameters available to configure to your liking are: lots, stop loss, take profit, dynamic lots, order type,timeframe. Indicator combinations for triggering orders and for precondi

The indicator draws the daily open line. Parameters
GMT shift (minutes) The time zone could be shifted. The value is given in minutes. Draw closest regular bar's open price This parameter could fine-tune the open price line when using GMT shift. Yes - Draw the open line based on the current chart period's closest regular bar No - Draw the open line based on the M1 chart's closest bar. Let's assume that your shift is 10 minutes, and you are using H1 chart and the first candle in every day is
FREE

Convenient drawing of parabolic channels by four points (two lower and two upper extremums). Additional control keys: N (New) - Start drawing a new channel. C (Clear) - Deletes the current channel. By default, the current channel is the last channel. But you can click on the line of any channel to make it current. Click on the gear in the upper right corner to set some parameters for all channels or the current channel. All work is visible from the animated Gif.
Do not forget to express your
FREE

Trendy Stock is a price following indicator that uses Stochastic to show when the price is out of the oversold or overbought areas. The algorithm allows you to stay longer in a trend where the bulls or bears are in control. The indicator changes color immediately the price exits oversold/overbought state. In short, the downtrend [red] bars start to paint when the buying pressure decreases while the uptrend [green] bars form as the buy pressure kicks in. For MT4 version, follow :: https://www
FREE

Simple indicator used in technical strategies to analyze tops, bottoms and reversal or continuation points. Developer information:
Line values and colors:
Buffer 0 : ZigZag line value;
Buffer 1 : ZigZag color value;
Buffer 2 : Median line value;
Buffer 3 : Median color value; Buffer to get the values of each top and bottom. Buffer 4 : Top value;
Buffer 5 : Bottoms value;
Buffer that returns the type of the last direction.
Buffer 9: 0 = Not updated, 1 = High, -1 = Low;
FREE

Hello!
Tired of constantly subscribing to other people's signals and earning pennies?
Want to manage your own trading?
Then you are on the right page!
It's very simple ==> buy my indicator ==> put it on the chart ==> blue arrow - buy ==> red arrow - sell. Even an infant can do it!
A handy histogram to trace the market direction.
Are you still here? Then read the parameter descriptions and take a look at the screenshots: Stoch K period - period for calculating the% K oscillator line.

This indicator creates the perfect RENKO for you to work with timeless types of Candles! Due to RENKO characteristics of timeless, the indicator adjusts trading arrows (otherwise they would be lost) and leaves them exactly where the negotiation occurred in Renko Candles! In addition, this indicator shows exactly the division between days, in order to make it clear to user where each trading session started and ended! Furthermore, the following indicators were added, giving you bigger analysis p

Delta Aggression Volume PRO is an indicator developed to monitor the strength and continuity of the aggression volume of sell and buy negotiations. Note: This indicator DOES NOT WORK for Brokers and/or Markets WITHOUT the type of aggression (BUY or SELL). Cryptocurrencies and Forex do not provide this type of data, that is, it does not work with them.
O Delta Agrression Volume PRO has features that allow you to view beyond the delta volume of the day.
Operation
Multi symbols (those who pro

Tom DeMark developed TD Sequential by hand, through a process of trial and error, in the 1970s. It never ceases to amaze me how something originally created to analyze daily price data can be applied so effectively, more than thirty years later, to any time frame—from one minute to one year—and to any market. The indicator has two components: TD Setup, which relies on momentum to define price ranges, and TD Countdown, which is trend based, and looks for low-risk opportunities to fade establishe
MetaTrader platformunun uygulama mağazası olan MetaTrader Mağazadan bir ticaret robotunun nasıl satın alınacağını öğrenin.
MQL5.community ödeme sistemi, PayPal, banka kartları ve popüler ödeme sistemleri aracılığıyla yapılan işlemleri destekler. Daha iyi bir müşteri deneyimi için satın almadan önce ticaret robotunu test etmenizi şiddetle tavsiye ederiz.
Ticaret fırsatlarını kaçırıyorsunuz:
- Ücretsiz ticaret uygulamaları
- İşlem kopyalama için 8.000'den fazla sinyal
- Finansal piyasaları keşfetmek için ekonomik haberler
Kayıt
Giriş yap
Gizlilik ve Veri Koruma Politikasını ve MQL5.com Kullanım Şartlarını kabul edersiniz
Hesabınız yoksa, lütfen kaydolun
MQL5.com web sitesine giriş yapmak için çerezlerin kullanımına izin vermelisiniz.
Lütfen tarayıcınızda gerekli ayarı etkinleştirin, aksi takdirde giriş yapamazsınız.