Indicadores técnicos para MetaTrader 5 - 61

Introduction
The "Smart Money Concept" transcends the realm of mere technical trading strategies to embody a comprehensive philosophy on the dynamics of market operations. It posits that key market participants engage in price manipulation, thereby complicating the trading landscape for smaller, retail traders.
Under this doctrine, retail traders are advised to tailor their strategies in alignment with the maneuvers of "Smart Money" - essentially, the capital operated by market makers

Introducing our state-of-the-art Wave Indicator, meticulously designed for the discerning traders of the MQL5 community! At the core of this innovative tool lies an unmatched sensitivity to capture even the slightest market movements. Our Wave Indicator serves as the foundational element for constructing comprehensive trading strategies, providing you with an unwavering edge in the dynamic world of finance. Whether you're aiming to refine short-term tactics or develop long-term systems, this ind
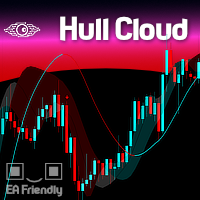
The Hull Moving Average is known for its ability to reduce lag and provide a clearer, more accurate depiction of market trends. By smoothing price data more effectively than traditional moving averages, it helps traders identify trend directions and reversals with greater precision. The Hull Cloud indicator elevates this by using four Hull Moving Averages working together like an orchestra. This combination creates a dynamic system that highlights short, medium, and long-term trends, giving trad
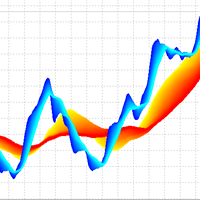
3D Trend Indicator is a non-repaint indicator using multiple moving averages with a 3D surface view. By using this indicator, you can remove uncertainties that can happen using a single and fixed moving average period. You can use a cloud area using a range of moving average periods. Also a wide range of visual settings are added to this indicator to have a better view from the cloud area. Alert and notification system added to the indicator to inform the trader about the action of candles on t
Apresentamos o Indicador de novo grafico - uma ferramenta poderosa para traders que buscam uma análise de preço suave e clara. Este indicador inovador calcula a média simples dos preços, oferecendo uma visão precisa e ajustada dos movimentos do mercado. Como Funciona : O Indicador de Média de Preços Simples (SMA) utiliza uma fórmula simples e eficaz: Ele soma o valor do último preço com o preço anterior. Em seguida, divide essa soma por 2 para obter a média. Fórmula : SMA = U ˊ ltimo Pre c ¸ o +

The Multi Asset Monitor Panel is a game-changer for traders who need to keep an eye on multiple markets simultaneously. This innovative panel allows you to monitor any symbol and any timeframe you need, all within a single, organized interface. With up to three lists of symbols and customizable MT5 templates, you can tailor your monitoring setup to fit your specific trading strategy. What sets the Multi Asset Monitor Panel apart is its flexibility and customization options. You can control the s

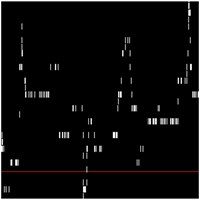
O LIVRO VISUAL é uma ferramenta que auxilia na identificação de escoras e renovação de ordens, para quem opera Tape Reading ou fluxo no gráfico é uma excelente ferramenta. Porem ele funciona somente em Mercados Centralizados ou com profundidade nível 2. É de fundamental importância você saber que ele não funciona em Mercado de FOREX. Porem pode ser utilizado no Mercado da B3.

Bienvenido al futuro del trading con KMeans Price Zones Detector, un innovador indicador de MetaTrader que aprovecha el poder del aprendizaje automático para identificar zonas clave de precios. Esta herramienta utiliza el algoritmo de agrupamiento KMeans para detectar dinámicamente los centroides en los datos de precios, destacando áreas donde es más probable que los precios encuentren soporte, resistencia o consolidación. Algoritmo innovador KMeans KMeans Price Zones Detector se destaca por su

¡Optimiza tus estrategias de trading con el indicador RAR (Relative Adaptive RSI)! Este avanzado indicador de análisis técnico combina la potencia del índice de fuerza relativa (RSI) con técnicas adaptativas, proporcionando señales más precisas y confiables que un oscilador común. ¿Qué es el Indicador RAR? El RAR es un indicador diseñado para MetaTrader 5 que utiliza medias móviles exponenciales (EMA) y medias móviles adaptativas (AMA) para suavizar el RSI y ajustarlo dinámicamente a las condici

Индикатор тиковых объемов представляет собой инструмент технического анализа, используемый для оценки активности трейдеров на рынке. Этот индикатор отображает количество тиков (изменений цен) за определенный временной период и показывает преобладание тиков, направленных на покупку или продажу.
Основные характеристики и функции индикатора тиковых объемов: Гистограмма объемов:
Белый цвет: Означает преобладание тиков, направленных на покупку. Когда количество покупок превышает количество прода

Bienvenido a una nueva era de trading con el indicador AI Moving Average, un avanzado indicador de MetaTrader 5 diseñado para proporcionar a los traders información predictiva sobre los movimientos del mercado. Esta herramienta combina la potencia de la IA con la fiabilidad de una media móvil exponencial sin retraso para ofrecer predicciones precisas y oportunas de las tendencias futuras de los precios. Modelo Innovador de Regresión Lineal AI Moving Average aprovecha un modelo de aprendizaje aut

Trend reversal identification: The K-line countdown indicator helps traders capture trend reversal signals by identifying excessive buying and selling behavior in the market. This indicator is particularly effective when the market is in extreme states. Risk management: This indicator can help traders identify potential risks in the market before the trend reverses and adjust positions in time to avoid losses. For example, you might consider reducing your long position when a bullish countdown c

Price update indicator — can issue any type of alert when the price reaches certain levels set by a trader. There are three types of price levels: the first one is used when the price rises above certain level (displayed with the green line on the chart), the second one is used when the price falls below certain level (displayed with the red line on the chart), and the third one is used when the price reaches the certain level exactly (displayed with the yellow line). Three alert types include

Evaluate operational viability in each timeframe and in any instrument, according to their respective spread and percentage volatility, which are essential for correct risk management in your trades.
This indicator is essential for both Day Traders and Swing Traders, as in addition to evaluating operational viability in each timeframe, it is also possible to identify the fair minimum stop for each period and instrument.
Example in Swing Trade: your broker charges a spread equivalent to 0.05
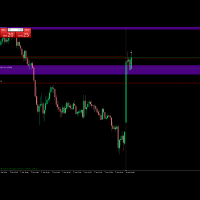
Tu indicador de precio medio para el puesto que estabas buscando. Este indicador inserta una línea horizontal en su gráfico cuando está posicionado, en largo o vendido, después de completar el parcial. Luego de completar el parcial, inserta la línea horizontal en el gráfico mostrando visualmente dónde está el verdadero BreakEven de la operación. Veja a seguir

Escáner de mercado multiplazo y multisímbolo. El indicador probará la estrategia técnica seleccionada en todos los instrumentos y plazos de su elección y mostrará los resultados del escaneo en una fracción de segundo.
Caso de uso Inicie el indicador, establezca el tiempo de negociación y la lógica comercial. Asegúrese de que los resultados del escaneo sean rentables en la mayoría de los instrumentos, luego cambie al gráfico deseado con un solo clic del mouse. Las señales comerciales están list

StochastiX is an extension of a well-known indicator.
1) StochastiX is displayed in the range of -100 to 100.
2) A histogram is calculated from the difference of the main and signal curves - again as a stochastic, but without smoothing.
The histogram gives the user a hint about the dynamics of oscillator changes. Patterns need to be studied from real graphs.
I wish you successful trading.

Why the RSI Alert Indicator is Essential for Your Trading Toolkit
In the fast-paced world of trading, timely and accurate information is crucial. The RSI Alert Indicator is a powerful tool designed to help you stay ahead of the market by providing real-time alerts when the Relative Strength Index (RSI) reaches critical levels. Whether you're a novice trader or a seasoned professional, this indicator can significantly enhance your trading strategy by pinpointing potential market reversals with
The Order Imbalance indicator, crucial in the toolkit of traders and market analysts, serves to highlight significant disparities between buy and sell orders within a specific financial asset. Essentially, it reveals the difference in volume between buy and sell orders over a defined period, typically in short, frequent intervals ( You can choose the frequency ). For traders, Order Imbalance can be interpreted as a signal of buying or selling pressure in the market. A positive imbalance, where s

Indicador de tendencia trillionario .
La tendencia Trilliant es un indicador forex avanzado que combina los indicadores respetados ocultos para detectar la tendencia temprano. Como su nombre sugiere, es un indicador de tendencia pero incorporado para el comercio de casi todas las estrategias de divisas (todas en una), manipulando los ajustes, bandas y líneas en el indicador.
Cualquier estrategia de divisas se puede negociar utilizando la tendencia trillionaria. Las condiciones se cumplen c
This is a multi time frame Support and resistance indicator which works on all forex pairs and commodities. Users can also see the historical support and resistance levels which got taken out . For Major Forex pairs like EURUSD, GBPUSD, USDCAD , USDCHF, NZDUSD, AUDUSD, EURCHF enable the s&r levels from 5 minutes from the settings. (Lower timeframe snr levels may act as as noise for major currency pairs.) For Gold and Silver enable all timeframe s&r levels.
Results may vary from broker to br
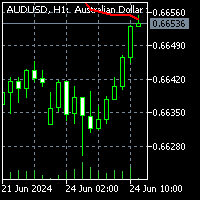
To download MT4 version please click here .
- This is the exact conversion from TradingView: "Chandelier Exit" By "everget". - This is a non-repaint and light processing load indicator - input options related to coloring and labels are removed to fit into MetaTrader graphics. - Buffers are available for processing within EAs. - You can message in private chat for further changes you need.

Indicator Description This indicator displays the highest and lowest prices for the previous day, week, and month. Additionally, it shows pivot levels calculated using different methods: Standard, Fibonacci, Woodie, Camarilla, and Floor pivots. Features: Previous Day High/Low: Indicates the highest and lowest prices of the previous trading day. Previous Week High/Low: Indicates the highest and lowest prices of the previous trading week. Previous Month High/Low: Indicates the highest and lowest p

Jabidabi Session Indicator The Market Session Indicator is a powerful tool used by traders to identify and track different trading sessions within the forex and stock markets. It visually highlights key trading periods, such as the Asian, European, and North American sessions, directly on the trading chart. This indicator is especially useful for traders who follow ICT (Inner Circle Trader) strategies, which emphasize the significance of various market sessions for optimal trading opportunities.

Subscribe to the MA7 Trading channel to receive notifications about new programs, updates and other information. Ask questions in the profile on the MQL5 .
Description of work The MA7 Moss indicator is based on the standard Accelerator Oscillator (AC) indicator. Shows overbought and oversold zones. Detailed information about the MA7 Moss indicator.
Indicator settings General settings: Upper level ; Lower level .
Message settings: Send message to the terminal (Alert) – permission to send m

Bienvenido a HiperCube DonChian
Este indicador le proporciona información muy útil sobre el precio, mostrándole cuándo es probable que el precio suba o baje.
Características: Indicador en las ventanas principales Colores de velas personalizados Período personalizado del indicador Establecer parámetros de desplazamiento
Cómo interpretar: Tendencia alcista: si algunas velas suben por encima de la banda superior, significa que es posible que se acerque una tendencia alcista. Tendencia bajist

Order Block indicator, highs and lows; the indicator focuses mainly on OBs, on the chart they are represented with a horizontal line on the minimum and maximum of that candle. While for the maximums and minimums only one line is marked (see the images to understand better). The indicator is for MT5, it works on all Timeframes, on any Forex Pair, on any index and on crypto markets. (For any information on the indicator do not hesitate to contact me). Limited time discount (50%) 74.90$ -> 38.60$

Highs, Lows and Bos Indicator for MT5; The indicator works on any type of market and on all TimeFrames. It also works on the MetaTrader5 Tester. the main function of the indicator is to identify the highs and lows by marking them with a point above/below the candle, then with a horizontal line it marks the Bos. It is very simple and intuitive, there are only 2 inputs: -the color of the maximums -the color of the minima
For any other information do not hesitate to contact me.
The Reversal Candlestick Structure indicator detects multiple candlestick patterns occurring when trends are most likely to experience a reversal in real-time. The reversal detection method includes various settings allowing users to adjust the reversal detection algorithm more precisely.
A dashboard showing the percentage of patterns detected as reversals is also included. USAGE Figure 1 Candlestick patterns are ubiquitous to technical analysts, allowing them to detect trend continuati
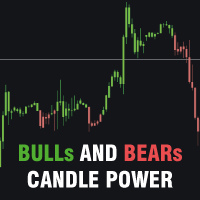
Bulls and Bears trend Power
The Bulls and Bears trend Power is a no repaint versatile technical analysis tool that helps traders identify market trends and see who's in control. It features dynamic trend capture logic that adapts to market conditions for a clear visual representation of trend direction. Traders can customize the colors to suit their preferences.
Features : Trend identification Compensation of market noise by strength of sellers or buyers
Recommendations : Use H1 timefram
The DYJ SignalSource WPRBashboard signal source is based on the WPR indicator information dashboard It can be used for any currency pair and time frame.
WPR suggests that a metric value between 80% and 100% indicates oversold in the market The indicator value between 0 and 20% indicates that the market is overbought.
The entry signal of this indicator is a turning point in the trend.
It provides reverse trend selection direction.
This indicator uses simulated trading techniques.
It pr

Este asistente de noticias está diseñado para obtener los eventos económicos que necesitan los comerciantes de las principales fuentes editoriales, que publican noticias en tiempo real basándose en Market Watch del terminal con varios y sencillos filtros.
Los operadores de Forex utilizan indicadores macroeconómicos para tomar decisiones informadas sobre la compra y venta de divisas. Por ejemplo, si un comerciante cree que la economía estadounidense va a crecer más rápido que la economía japon

Este producto está diseñado para mostrar las sesiones de negociación de 15 países según la zona horaria de su servidor de corredor y varios modos de visualización según la configuración deseada para evitar la congestión del gráfico y la posibilidad de configurar una sesión con la hora deseada por el usuario.
El sol nunca se pone en el mercado de divisas, pero su ritmo baila al compás de las distintas sesiones comerciales. Comprender estas sesiones, sus superposiciones y sus atmósferas únicas
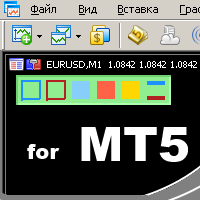
удобный инструмент для тех, кто использует технический анализ с использованием таких инструментов, как Трендовая линия и Прямоугольник. Имеется возможность настройки двух пустых прямоугольников, трех закрашенных и двух трендовых линий. Настройки индикатора крайне просты и делятся на пронумерованные блоки: С цифрами 1 и 2 вначале - настройки пустых прямоугольников (рамок); С цифрами 3, 4 и 5 - настройки закрашенных прямоугольников; С цифрами 6 и 7 - настройки трендовых линий. Объекты создаются оч

To get access to MT4 version please click here . This is the exact conversion from TradingView: " WaveTrend" by LazyBear.
This is a light-load processing and non-repaint indicator. All input options are available. Buffers are available for processing in EAs. You can message in private chat for further changes you need. The filling area option is omitted to fit into MT5 graphics.
Indicador de Fuerza de la Moneda (Currency Strength Index - CSI) ANTES DE ACTIVAR EL INDICADOR, RECUERDA CONFIGURAR "TRUE" PARA VISUALIZAR LOS PARES El Indicador de Fuerza de la Moneda (Currency Strength Index - CSI) es una herramienta poderosa utilizada en el trading de forex para medir la fuerza relativa de las principales monedas. Este indicador ayuda a los traders a identificar las monedas más fuertes y más débiles en un momento dado, permitiéndoles tomar decisiones de trading más informada

El indicador Bollinger Bands Dashboard ofrece una manera conveniente e informativa de rastrear las señales del indicador Bollinger Bands en diferentes períodos de tiempo utilizando un solo panel (Dashboard). Esta herramienta permite a los traders obtener rápida y fácilmente la información que necesitan, permitiendo una toma de decisiones eficiente en el mercado.
Características principales:
1. **Panel de señales**: el panel muestra señales de bandas de Bollinger para períodos de tiempo sele
Overview: Elevate your trading strategy with the Advanced SuperTrend Buy Sell Signals Indicator! Designed for both novice and professional traders, this indicator provides clear and accurate buy/sell signals based on the popular SuperTrend algorithm, enhanced with customizable parameters and visual alerts. Features: Clear Trend Visualization: Identifies UpTrends (green line) and DownTrends (red line) with precision. Customizable Parameters: Adjust ATR period and multiplier to fit your trading s

Los niveles de soporte y resistencia azul y rojo se muestran directamente en el gráfico.
Alertas de cierre por encima de la resistencia y cierre por debajo del soporte.
Valores predeterminados: EnableNativeAlerts = falso;
EnableEmailAlerts = falso;
EnablePushAlerts = falso;
Es realmente fácil comerciar con él. ¡No hay lugar como el comercio SR! Descargo de responsabilidad: El soporte se produce cuando se espera que una tendencia bajista se detenga debido a una concentración de la

Cambio de tendencia > Flechas ('Arriba' y 'Abajo')
Cuando el icono aparece en el búfer del indicador ("Arriba" o "Abajo"), se activan las alertas.
Puede utilizar 200 EMA para reducir las señales falsas.
Ingrese al comercio cuando aparezca la flecha, pero espere hasta que se cierre la vela.
Cierre la operación cuando cambie el color de la línea o utilice su propia estrategia de cierre.
Funciona en todos los plazos
Funciona en todas las monedas
Nota Funciona mejor con otros indica
the Spike detector show multiple indication for entries, for max profits enter on each indication given u can also add on lots size as entries go to secure max profits before spike occure, the more entries you enter along the way ,the more profits u have after the initial spike, after spike hold 3-5 candles before close for max profits . good on al timeframes max stop loss is 22candles.

ObieTrader es un indicador de señales a corto plazo. Se utiliza para el comercio intradiario. ObieTrader identifica la tendencia a corto plazo utilizando el indicador de porcentaje R de Williams y el rango verdadero promedio. Cuando el indicador confirma una tendencia a corto plazo, traza semáforos en la barra para mostrar la tendencia. Las barras con puntos rojos indican una tendencia bajista y las barras con puntos azules indican una tendencia alcista.
Cuando se identifica una tendencia, ab

RSI Divergence Signal
The RSI Divergence Signal is a technical analysis tool used in financial markets to identify potential trend reversals. It compares the Relative Strength Index (RSI) with price action to detect divergences. When the RSI moves in the opposite direction of the price, it signals a potential change in momentum, suggesting that the current trend may be weakening. This divergence can indicate a buying opportunity in a downtrend or a selling opportunity in an uptrend. Traders

Magnified Price Experience trading like never before with our Magnified Price indicator by BokaroTraderFx , designed exclusively for MetaTrader 5. This revolutionary tool provides traders with instant insights into price movements, offering a clear advantage in today's fast-paced markets.
Key Features: 1. Real-time Precision: Instantly magnify price action to uncover hidden trends and patterns. 2. Enhanced Visibility: Clear visualization of price movements with adjustable zoom levels. 3. Use

** All Symbols x All Time frames scan just by pressing scanner button ** *** Contact me to send you instruction and add you in "Order Block group" for sharing or seeing experiences with other users. Introduction: The central banks and financial institutions mainly drive the market, Order block is considered a market behavior that indicates accumulation of orders from banks and institutions, then the market tends to make a sharp move(Imbalance) on either side once the order block is

Market Heartbeat is in your hand! Introduction The Market Heartbeat indicator with a special enhanced algorithm (volume, money flow, cycle of market and a secret value) is a very repetitive trend finder with a high success rate . Interestingly, this Winner indicator indicates that the trend has changed its direction or the end of a trend retracement or even appears at the range market. The Market Heartbeat can use in scalping trading or trend trading. It finds immediately with alarm, n
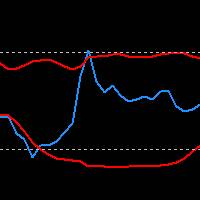
RSI Indicator with Bollinger Bands: Maximize Your Win Rate with Precision and Advanced Trading Strategies Take your trading to the next level with the RSI Indicator combined with Bollinger Bands. Customize the RSI period, band moving average, and deviation to tailor the indicator to your unique strategies. Upon request, we also offer the possibility to customize or create bespoke indicators to best meet your trading needs.
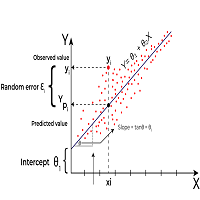
Linear Regression is a statistical method used to model the relationship between two or more variables. The primary goal of Linear Regression is to predict the value of one variable (called the dependent variable or outcome variable) based on the value of one or more other variables (called independent variables or explanatory variables) Linear Regression can be applied to technical analysis, and it is indeed one of the tools used by traders and analysts to make predictions and identify trends i
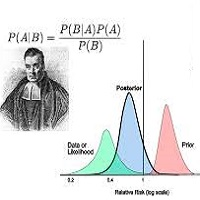
Bayesian methods can be effectively applied to predict price trends in financial markets, including Forex, stocks, and commodities. Here’s how Bayesian techniques can be used for trend prediction: 1. Bayesian Linear Regression Bayesian linear regression can be used to model the relationship between time and price. This method allows for the incorporation of prior beliefs about the trend and updates the trend as new data comes in. Example: Suppose you want to predict the price trend of a currency

Dominant Candle Finder is a significant candlestick on a price chart that stands out due to its size, volume, or price movement compared to surrounding candles. It often indicates strong buying or selling pressure and can be used to identify potential reversal points, breakouts, or continuations in the market. Dominant candles can serve as key indicators for traders to make informed decisions, providing insights into market sentiment and potential future price movements. MT4 Version - https://w
This indicator will draw lines for previous day Highs and Lows, current day open price and current day price plus and minus ATR. This will provide an overview of the support and resistance for the price movement of the current trading day. The ATR is fixed to the 1 day period, so this indicator is suitable for the time frames lower than 1 day, i.e. 4HRTF, 1HRTF or 15MTF.

If you like this project, leave a 5 star review.
Follow on TikTok: @quantum.trader
[ Any Symbol Can Be ADDED ] DM me for adding any Pair symbol, crypto, index, stock or anything related. you can also DM me in TikTok [@quantum.trader] Works on [ EURUSD-GBPUSD-GBPJPY-USDJPY-XAUUSD-US30-BTCUSD-ETHUSD-SOLUSD ]
This indicator calculate and draw the Prediction or Forecast the peaks of the current day ( forecast high - forecast low - forecast middle - forecast upper q - forecast lower
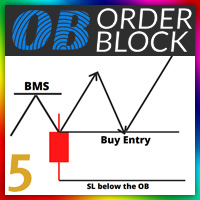
Orde Block Detector: The order block detector can automatically identify the breakthrough of the market structure. After the trend framework breaks through, the order block area can be drawn automatically. In order to draw the OB area more accurately, we also automatically find the candle on the left and right sides of the original candle according to its trading principle, and draw a more accurate ob area through more subtle quantitative rule judgment. Futures : 1. Customize the BMS color, a

RTS5Pattern AVG RTS5Pattern AVG is a revolutionary statistical indicator designed for the MetaTrader 5 platform, bringing an innovative approach to technical analysis and market movement prediction. This indicator combines advanced mathematical methods, including normalization and historical data analysis, with a user-friendly interface and precise trading capabilities. RTS5Pattern AVG is an ideal tool for traders looking to improve their trading strategies and achieve better results. Key Featur
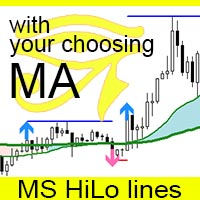
The MS High Low Lines indicator is a tool designed to enhance trend visualization for MT5. It displays high and low prices as lines, using your preferred Moving Average (MA) settings (either SMA or EMA, with customizable periods). The indicator shows configured signals when prices break above or below these MAs. By setting it up with highly functional MAs, traders can better understand market trends and make trades with a statistical edge. You can modify settings and place multiple indicators o

Here is a version for MetaTrader 5 of the famous Wave Trend indicator. Introducing the Wave Trend Oscillator Indicator for MT5 We are excited to present our Wave Trend Oscillator Indicator, exclusively designed for MetaTrader 5. This advanced tool is a must-have for traders who seek precision and efficiency in their trading journey. Our oscillator is built on the principles of wave trend analysis, capturing the ebb and flow of market trends with unparalleled accuracy. It helps traders identify p
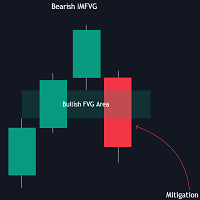
The FVG Instantaneous Mitigation Signals indicator detects and highlights "instantaneously" mitigated fair value gaps (FVG), that is FVGs that get mitigated one bar after their creation, returning signals upon mitigation.
Take profit/stop loss areas, as well as a trailing stop loss are also included to complement the signals.
USAGE Figure 1 Instantaneous Fair Value Gap mitigation is a new concept introduced in this script and refers to the event of price mitigating a fair value gap

Easy Fibonacci es un indicador para MT5 que te permite trazar fácilmente retrocesos de Fibonacci. Características Se pueden establecer hasta 10 niveles de Fibonacci desde la configuración del indicador. Cada nivel puede tener diferente estilo de línea, color de línea, ancho de línea y otros ajustes personalizables. Puedes usar un ratón con botones adicionales para asignar las teclas V y B y trazar Fibonacci cómodamente. Acciones de los botones: B y V: Trazar Fibonacci superior/inferior en el áre

Indicador financiero SolarTrade Suite: Indicador del mercado terrestre: ¡su guía confiable en el mundo de los mercados financieros!
Este es un reemplazo de las velas japonesas grises estándar, que utiliza algoritmos especiales, innovadores y avanzados para calcular su valor, y también tiene un diseño agradable a la vista.
Es muy sencillo entender las lecturas de este indicador: color azul - comprar, color rojo - vender. Cuanto más brillante sea el color, más fuerte será la señal.
Consulte
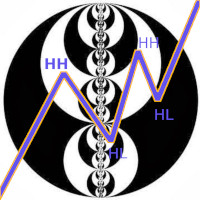
El indicador de la estructura del mercado en el marco temporal actual encuentra:
1. Tendencia (ondas ascendentes y descendentes). El cambio de dirección de la onda se produce después de la interrupción del extremo (retirada de liquidez del lado opuesto). La representación de la tendencia se realiza teniendo en cuenta las barras externas (puede haber 2 extremos en una barra externa). La tendencia se puede dibujar teniendo en cuenta el número mínimo de barras en la onda (2 o más). Configurable

The indicator displays the total number of ticks during the formation of a single bar. It can be used to analyze market activity in financial trading. Peaks and troughs of the indicator effectively highlight potential reversal points in price movements. This tool is particularly useful for traders seeking to identify periods of high volatility, allowing them to make informed decisions based on tick volume patterns. By observing changes in tick frequency, traders can gain insights into market se
Introducing the Gold Market Arrow Indicator, specifically designed for the 15-minute chart. This advanced tool provides clear and actionable buy and sell arrows, enabling traders to make timely and informed decisions in the gold market. Whether you're a seasoned trader or a novice, our indicator simplifies complex market data into straightforward signals, ensuring you never miss an opportunity to capitalize on gold price movements." This indicator works with a custom build in strategy The indic

EspañolIndicador financiero SolarTrade Suite: Uranus Market Indicator - ¡Su guía confiable en el mundo de los mercados financieros!
Se trata de dos promedios móviles que utilizan algoritmos especiales innovadores y avanzados para calcular su valor, y también tienen un diseño agradable.
Es muy fácil entender las lecturas de este indicador: color azul - compra, rojo - venta.
Cuanto más brillante sea el color, más fuerte será la señal.
Vea nuestros otros productos de la serie SolarTrade Su

EspañolIndicador financiero SolarTrade Suite: Neptune Market Indicator - ¡Su guía confiable en el mundo de los mercados financieros!
Se trata de seis promedios móviles que utilizan algoritmos especiales innovadores y avanzados para calcular su valor, y también tienen un diseño agradable.
Es muy fácil entender las lecturas de este indicador: color azul - compra, rojo - venta.
Cuanto más brillante sea el color, más fuerte será la señal.
Vea nuestros otros productos de la serie SolarTrade

Para una descarga gratuita, únete a nuestro grupo. ¡Oferta por tiempo limitado! Descripción General: Identifica las monedas más fuertes de un vistazo con el Currency Strength Chart para MetaTrader 5. Este potente indicador proporciona una representación visual clara de la fuerza relativa de las principales monedas durante los últimos 30 días, permitiéndote tomar decisiones comerciales más informadas. Características Clave: Análisis Comparativo de 30 Días: Compara la fuerza de cada moneda princip
A simple indicator for plotting a tick chart.
This indicator will allow you to track the spread dynamics and the price behavior in general.
In the settings, you can select the price to display on the chart - Bid, Ask or both prices at the same time.
Tick Chart Indicator will definitely be useful when using scalping strategies. The MT4 version is available here . Good luck to everyone and successful trading!

Para una descarga gratuita, únase a nuestro grupo. ¡Oferta por tiempo limitado! Presentamos nuestro innovador indicador MQL5, diseñado para mejorar su experiencia de trading proporcionando señales visuales claras de los límites de las velas diarias en marcos de tiempo más bajos. Esta herramienta es perfecta para los traders que desean estar informados sobre el progreso de la vela diaria, asegurando una mejor toma de decisiones y ejecución de estrategias. Características principales Visualización
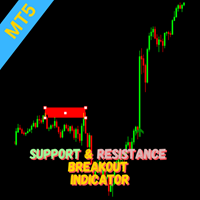
Indicator Overview This indicator utilizes the Zigzag indicator to identify potential support and resistance levels. When the price action breaks through one of these levels, a trading signal is generated. How it Works The Zigzag indicator is employed to pinpoint significant price highs and lows, forming potential support and resistance areas. A signal is triggered when the current candle closes beyond a previously established support or resistance level. Traders can consider entering a position
CLICK HERE FOR FREE DOWNLOAD This trading indicator Automatically identifies and plots contract blocks, which are essential zones marked by significant levels of support and resistance. This powerful tool provides traders with a clear and intuitive visualization of critical market points where prices are likely to bounce or reverse. The contract blocks, represented by distinct colored rectangles, highlight support zones (at the bottom) and resistance zones (at the top), enabling traders not onl

Breakthrough signal indicator for the MT5 platform: Your reliable assistant in the world of trading!
We are pleased to present you with an innovative signal indicator, which was created in collaboration with an outstanding mathematician. This indicator combines advanced algorithms and the best of the world of mathematical analysis, providing traders with a unique tool for predicting market movements.
Why is this indicator unique?
1 .Entry signals without redrawing If a signal appears, it
El Mercado MetaTrader es una plataforma única y sin análogos en la venta de robots e indicadores técnicos para traders.
Las instrucciones de usuario MQL5.community le darán información sobre otras posibilidades que están al alcance de los traders sólo en nuestro caso: como la copia de señales comerciales, el encargo de programas para freelance, cuentas y cálculos automáticos a través del sistema de pago, el alquiler de la potencia de cálculo de la MQL5 Cloud Network.
Está perdiendo oportunidades comerciales:
- Aplicaciones de trading gratuitas
- 8 000+ señales para copiar
- Noticias económicas para analizar los mercados financieros
Registro
Entrada
Si no tiene cuenta de usuario, regístrese
Para iniciar sesión y usar el sitio web MQL5.com es necesario permitir el uso de Сookies.
Por favor, active este ajuste en su navegador, de lo contrario, no podrá iniciar sesión.