Utilidades comerciales de pago para MetaTrader 4 - 6

La Controladora es como un controlador Español, un Asesor Experto simple pero potente que le permite controlar su trading con facilidad y precisión. ¿Desea detener su trade cuando el precio cruza una línea de tendencia? No te preocupes, la Controladora puede hacerlo. ¿Quieres tomar ganancias cuando el precio alcanza la parte superior de un canal? La Controladora puede hacerlo. Calculando la proporción exacta de su cuenta mediante la apertura de un trade, cuyo tamaño representa, en caso de pérdid

The Expert Advisor notifies that a price has crossed a line on the chart. It handles two types of lines - horizontal line and a trendline. The number of lines is unlimited. Parameters: prefix of signal line - prefix of object (line) names processed by the indicator. If the parameter is empty, it handles all object types: horizontal lines and trendlines. price Mode - price type (bid or ask). timeout - crossing alert timeout. number of repeats - the limit of crossing alert repeats. number of comme

La mejor forma de aumentar la claridad y por tanto, facilidad para leer tus gráficos es simplemente eliminar los niveles de fibonacci que ya no usas en tu gráfica, como aquellos niveles donde ya se probó que no funcionaron como niveles de soporte o resistencia, pero hacer esto con Metatrader era toda una monserga… hasta ahora. Con Fibo pro tu podrás activar o desactivar de una lista preconfigurada, por ti mismo, de niveles simplemente haciendo un par de clics, sin la necesidad de abrir el panel

Auto Trade Driver es una potente herramienta automática (trabaja como Asesor Experto) que le ayudará a gestionar los riesgos y controlar las órdenes para maximizar los beneficios con las reglas de multiprotección y Trailing Stop. Esta herramienta va a ser muy útil tanto para los scalpers, como para los traders que operan siguiendo la tendencia. No sólo calcula con precisión el riesgo de trading, sino también protege y aumenta el beneficio en tiempo real. Lo único que necesita hacer a la hora de

Description Impulse Smart is an indicator impulse trading system based on Moving Average and MACD Classic Smart with sound notification . The idea of the impulse system based on Moving Average and MACD Histogram was first offered by Dr. Alexander Elder in his book "Come Into My Trading Room" . The system allows users to choose the calculation method ( Moving Average and MACD Classic Smart ) based on a single, double or triple moving average with identification of primary signal of pr

Description Fibo Levels Custom is a color multicurrency/multi-symbol indicator that automatically plots Fibonacci levels on the Market Mood Oscillator in a separate window below the chart of the main financial instrument. It can be used with any broker, regardless of the name of a financial instrument used because the symbol name must be entered manually as an input parameter. If you enter a non-existent or invalid name of a financial instrument, you will receive an error message sayin

This is a semi-automatic Expert Advisor. A user draws a support or a resistance line in the form of a horizontal line or a trendline on a chart. A command in the format of UP|DN_xxxx:yyyy is specified in the line name; the Expert Advisor understands it as a signal to buy or sell setting a stop loss and a take profit. EA settings include a parameter with a lot size and a value for moving stop loss to breakeven. If stop loss = 0, the EA does not use breakeven. If this parameter is greater than zer

Este asesor proporciona las siguientes características: Abra una posición: cuando el precio cruce la línea de tendencia, abra una orden larga o corta. Cierre: cuando el precio cruce la línea de tendencia, cierre su posición larga o corta. Trailing Stop Loss: el EA continuará aumentando el stop loss para órdenes largas o reduciendo el stop loss para órdenes cortas a lo largo de la línea de tendencia. La línea puede ser una línea de tendencia o una línea horizontal, Las líneas de tendencia p

Description Fibo Retracement is an indicator that automatically plots Fibonacci levels in the main chart based on Close prices , which distinguishes it from the Fibo Levels indicator that plots levels based on High/Low prices. Thus, using both indicators provides the trader with the opportunity of determining support and resistance zones by Fibonacci! The levels are calculated and plotted over a certain interval using the number of bars specified by the user. The user can display Fibonacci l
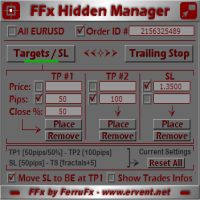
El panel del Administrador oculto del FFx le ayudará a gestionar fácilmente sus órdenes directamente en el gráfico. A continuación descripción de todas las características: TP, SL y TrailingStop están ocultos Cada orden tiene sus propias líneas en gráfico Arrastrar y soltar cualquier línea para cambiar el TP/SL según su necesidad Opción para mover automáticamente la línea SL en equilibrio cuando se alcanza el TP Nº 1 Opción de elegir el tipo TP/SL (por pips o precio) Opción de elegir el tipo de

Description Strongest Level is an indicator that automatically plots the nearest levels of strongest resistance and support in the main chart based on prices of the current timeframe. Repeated usage of the indicator with various number of bars creates a system of support and resistance! The indicator calculates and plots levels based on number of bars set by the user. It is recommended to set numbers from a golden ratio according to Fibonacci (13, 21, 34, 55, 89, 144, 233, 377, 610 etc.). Users

Description Strongest Higher Level is an indicator that automatically plots the nearest level of strongest resistance and support in the main chart based on prices of the higher timeframe that differs it from Strongest Level indicator. Repeated usage of the indicator with various number of bars creates a system of support and resistance! The indicator calculates and plots levels based on number of bars set by the user. It is recommended to set numbers from a golden ratio according to Fibonacci

I like trading manually, so I created this tool to make my trade more easier and faster.
Features Money management. Click for place order ( Buy/Sell/BuyStop/BuyLimit/SellStop/SellLimit). Many buttons for control your account (Close All, Remove Pendings, Breakeven, Hedging). Auto hide if not use for 2 minutes. See profit on current symbol. Free to move panel to where you want. Save your settings for using on next time. Special: It's work on backtest mode! You can use this for training yourself.
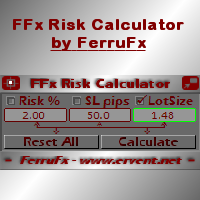
FFx Risk Calculator panel will help you to calculate very easily your trades size, SL or the risk directly on the chart. All features are described below: Option to select which parameter to calculate: Risk, Stop Loss or Lot Size The panel will show if the lot size is allowed according to the current account free margin Button to maximize/minimize the panel Drag and Drop the panel anywhere on the chart How to use it? Select the parameter you want to be calculated. It will be based on the 2 other

El BreakEven es un indicador que te muestra el precio promedio de las ordenes de un par considerando tanto el precio como el volumen de cada una de las operaciones abiertas y activas bajo el par desplegado en la gráfica a la que agregas el indicador. El indicador es de gran ayuda para los que manejan múltiples operaciones a la vez como para los que tradean con una sola orden por par debido a que te puede mostrar el desempeño de la operación(es) abiertos bajo el par, así como el efecto que tendrá
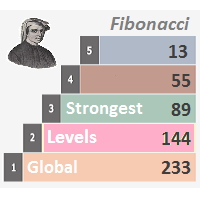
Description Strongest Levels Global is a colored multicurrency/multisymbols indicator that automatically plots a system of the nearest levels of strongest resistance and support in the separate window on one of nine different indicators of the current timeframe in accordance with user's choice. Repeated usage of the indicator with various number of bars creates an extended and confirmed system of support and resistance! The indicator calculates and plots levels based on the number of bars set b

Description DealsCopyMaster opens additional positions on a single symbol in the appropriate amount and tracks them automatically. Opening additional positions may be necessary in case a subscriber starts to lag behind the provider dramatically in the volumes of the currently opened positions and in the volumes difference when provider's balance was at some moment of time equal to the current subscriber's one. In multicurrency/multisymbol mode, the EA is attached to the chart of each financial i

Trades Viewer is a trading helper app for a serious trader. It offers several important data like day range, 22 days average range and predefined PL. It draws trades history and current open positions on a chart. It has a detail panel for viewing a particular trade with just a click on that trade. All these make it very convenient and straightforward to view your entry/exit positions and thus improve your trading system.
Features Profit/loss of the current symbol, counting all trades of the sy

Attention: Demo version for review and testing can be downloaded here . It does not allow trading and can only be run on one chart.
Active Lines - a powerful professional tool for operations with lines on charts. Active Lines provides a wide range of actions for events when the price crosses lines. For example: notify, open/modify/close a position, place/remove pending orders. With Active Lines you can assign several tasks to one line, for each of which you can set individual trigger condi

Es un sistema consistente de 2 componentes: RepliTrades Source: Manda las órdenes de una a más terminales dentro de la misma computadora y RepliTrades Trader: Opera las órdenes enviadas por RepliTrades Source Por favor vea el video para aprender cómo funciona y se utiliza Características: Maneja hasta 300 órdenes al mismo tiempo en cada terminal Trabaja con cualquier broker sin importar si agrega prefijos o sufijos a los distintos pares Replica ordenes pendientes u operaciones directas y sus mod

Es un indicador que te ayuda colocando una referencia visual en el gráfico que te permitirá fácil y rápidamente determinar si un trade de scalping o intradiario tiene buenas posibilidades de resultar en tu favor. Uno de los problemas más comunes para los operadores de intradiario, es la pérdida de referencia para saber si un movimiento es grande o pequeño debido al auto escalado del gráfico (en dias de gran acción las velas parecen chicas cuando en realidad involucran muchos pips y viceversa p

Este indicador muestra un cursor de cruz en todas las gráficas visibles de la plataforma, en la posición relativa al cursor de la gráfica activa. Para activar el Pointer Sync solo presione el botón que aparecerá en una de las 4 esquinas del gráfico cuando se agrega el indicador. Para desactivar el Pointer Sync solo presione el botón nuevamente. Una vez desactivado el Pointer Sync, las lineas de cruz de los otros gráficos desaparecerán también. El color y tamaño del botón del pointer puede ser ca
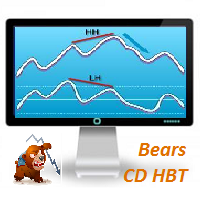
Description Bears CD HBT (Bears Convergence/Divergence High Bottom Top) is a universal analytical bears convergence/divergence indicator between a financial instrument and any of the twenty two standard indicators included in МT4 package. The indicator is the first out of the two possible versions (HBT and HTB) of the bearish convergence/divergence origins. Due to its multiple use feature, the indicator allows you to find convergences/divergences between the price and various standard indicators

Overview A One-Cancels-the-Other Order (OCO) is a pair of orders stipulating that if one order is executed, then the other order is automatically cancelled. Verdure OCO EA brings this functionality to MT4. This EA is a robust implementation of the popular One-Cancels-the-Other Order (OCO) but with added benefits, features and options. It is an EA that helps with trade management and especially useful for traders who use stop and reverse trading systems, traders who look for opportunities around
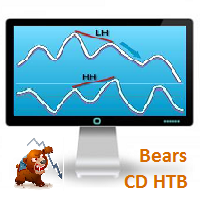
Bears CD HTB (Bears Convergence/Divergence High Top Bottom) is a universal analytical bears convergence/divergence indicator between a financial instrument and any of the twenty two standard indicators included in МetaTrader 4 package. The indicator is the second out of the two possible versions (HBT and HTB) of the bearish convergence/divergence origins. Due to its multiple use feature, the indicator allows you to find convergences/divergences between the price and various standard indicators
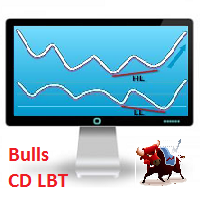
Description Bulls CD LBT (Bulls Convergence/Divergence Low Bottom Top) is a universal analytical bulls convergence/divergence indicator between a financial instrument and any of the twenty two standard indicators included in МT4 package. The indicator is the first out of the two possible versions (LBT and LTB) of the bullish convergence/divergence origins. Due to its multiple use feature, the indicator allows you to find convergences/divergences between the price and various standard indicators
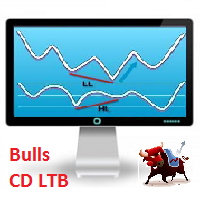
Description Bulls CD LTB (Bulls Convergence/Divergence Low Top Bottom) is a universal analytical bulls convergence/divergence indicator between a financial instrument and any of the twenty two standard indicators included in МT4 package. The indicator is the second out of the two possible versions (LBT and LTB) of the bullish convergence/divergence origins. Due to its multiple use feature, the indicator allows you to find convergences/divergences between the price and various standard indicators

Tener un trade a punto de tocar el Take Profit y de pronto ver que el precio se regresó y se fue justo a romper el Stop Loss es una de las pocas cosas que me hacen maldecir (y mucho). Bueno pues pensando en eso es que programé el AntiCursing (significa Anti-Maldecir). Solo agrega este expert adviser a una gráfica vacía, establece el nivel gatillo y el % de protección y tendrás una razón menos para maldecir. Deja explicar la configuración del AntiCursing: "Activar al %" aquí podrás definir el
Description Price CD HBT (Price Convergence/Divergence High Bottom Top) is a innovative universal analytical bears indicator of convergence/divergence between financial instruments. The indicator is the first out of the two possible versions (HBT and HTB) of the bearish convergence/divergence origins. Due to its multiple use feature, the indicator allows you to find convergences/divergences between the price of main financial instrument and other financial instruments simultaneously. Users can s
Description Price CD HTB (Price Convergence/Divergence High Top Bottom) is a innovative universal analytical bears indicator of convergence/divergence between financial instruments. The indicator is the first out of the two possible versions (HBT and HTB) of the bearish convergence/divergence origins. Due to its multiple use feature, the indicator allows you to find convergences/divergences between the price of main financial instrument and other financial instruments simultaneously. Users can s
Description Price CD LBT (Price Convergence/Divergence Low Bottom Top) is a innovative universal analytical bulls indicator of convergence/divergence between financial instruments. The indicator is the first out of the two possible versions (LBT and LTB) of the bullish convergence/divergence origins. Due to its multiple use feature, the indicator allows you to find convergences/divergences between the price of main financial instrument and other financial instruments simultaneously. Users can se
Description Price CD LTB (Price Convergence/Divergence Low Top Bottom) is a innovative universal analytical bulls indicator of convergence/divergence between financial instruments. The indicator is the second out of the two possible versions (LBT and LTB) of the bullish convergence/divergence origins. Due to its multiple use feature, the indicator allows you to find convergences/divergences between the price of main financial instrument and other financial instruments simultaneously. Users can s

Description Strongest Levels Multicurrency is a colored multicurrency/multisymbols indicator that automatically plots a system of the nearest levels of strongest resistance and support in the separate window on a chart of financial instrument in accordance with user's choice. The indicator calculates and plots levels based on the number of bars set by the user. It is recommended to set numbers from a golden ratio according to Fibonacci (13, 21, 34, 55, 89, 144, 233, 377, 610 etc.). The indicator
Tick Chart — full-featured chart for MetaTrader 4. A utility for creating and working with a tick chart in the MetaTrader 4 terminal. You can create a tick chart that works exactly the same as a regular chart. You can apply indicators, Expert Advisors and scripts to the tick chart. You get a fully functional tick chart on which you can work just as well as on a regular chart. You can enable the output of the Ask price data. The data are generated in the form of the upper shadow of a tick bar. Fr

Al dibujar una línea de tendencia u otros objetos, hay una desviación natural cuando se coloca el objeto a partir de un marco de tiempo más alto y luego lo miras en marco de tiempo más bajo. Perfect Line es un indicador técnico que resuelve este problema. Una vez que toque una línea después de dibujarlo, Perfect Line encontrará el lugar exacto en el marco de tiempo más bajo disponible para su posición y luego rectificará donde debe estar. PerfectLine utiliza una tolerancia preestablecida de 5 pí

La herramienta está diseñada para medir la distancia entre dos puntos en un gráfico y mucho más.
Lista de medidas:
Distancia en puntos Beneficio (con y sin spread) Diferencia de tiempo Cambio porcentual en el precio Ángulo de inclinación Cantidad de barras (varias opciones) Relación de distancia en puntos con valor de referencia Funciones:
Anclaje a precios OHLC Configuración automática del perfil de color basado en el color de fondo del gráfico Varios tipos de punteros para ele

My Money Manager como un controlador de riesgo, que pone sus trades con el volumen exacto que cumple con su riesgo de stop loss deseado. También puede ayudarle a escuchar sus niveles EP/SL/TP antes de poner una orden arrastrando estos niveles directamente en un gráfico y mantener información acerca de ellos durante la posición de apertura. Con esta herramienta, usted se sentirá más cómodo cuando decida abrir órdenes, así como previsión de sus beneficios/pérdidas con sus órdenes. La colocación de

Trade Controller provides multiple methods to protect and maximize your profits. This powerful weapon helps you to set the protect and trailing-stop rules on your trade automatically in many effective methods. Once it is set and turned on, you don't need to monitor your orders anymore, the software will keep watching and control your orders with your predefined rules. It's designed to support multi-protection and trailing strategy: Protect by break-even, protect by percentage, protect by pip, pr

News Loader Pro es una herramienta que actualiza automáticamente cada noticia económica en tiempo real utilizando la información detallada de varias fuentes de noticias. Este producto utiliza la tecnología única para cargar los datos detallados desde las web Forex conocidas. Usted recibirá una alerta a su dispositivo móvil/email antes de cada publicación de noticias que va a salir. Además, este producto marca las ediciones de noticias en el gráfico para el trabajo posterior. Las noticias es uno

Lo que no se mide no se puede mejorar. AdvancedTradeLog es un sistema que ayuda a complementar el estado de tu cuenta de operación con ilustraciones de cada paso de tus trades. Lo que hace básicamente es tomar una foto de la gráfica donde has producido una entrada , modificado el tamaño de la órden, o la distancia del stop loss y take profit. Pero no solo eso, sino que te da la oportunidad de agregar más información como las razones para haber realizado dicha operación o por qué la has modifica

The script controls the display of order tracing. Deletes/sets the icons of closed and market orders.
The Days of history to show parameter is the number of full days of trading history to be displayed on the chart. If the value is 0, only the current day is displayed, less than 0 - only market orders are displayed.
The Check all windows or current only parameter is a switch; the script actions apply to all windows or only to the current window.

MultiCrossAlert es un indicador técnico que te da alertas sobre cruces de líneas de indicadores técnicos u osciladores. Por default viene preparado para ofrecerte señales sobre cruces de: Promedios Móviles (del tipo simple, exponencial, suavizado o Wells Wilder, o lineal sopesado -linear weighted) Ichimoku Alligator Adicionalmente incluye la opción "Custom" que lo hace capaz de reconocer cruces de líneas de prácticamente cualquier indicador. MultiCrossAlert puede comparar el nivel para verifica
Overview Money management is an all-important aspect of trading that many traders often overlook. It is very possible that even with a winning strategy, bad money management can often result in huge loses. Verdure Lot Calculator aims to help traders minimize risk and exposure in the Forex market. Verdure Forex Calculators implements Lot (Trade or Contract Size) Calculator as an indicator on MT4 platform.
Lot Calculator (trade or contract size) A lot refers to a bundle of units in trade. In For

Overview Money management is an all-important aspect of trading that many traders often overlook. It is very possible that even with a winning strategy, bad money management can often result in huge loses. Verdure Forex Calculators aims to help traders minimize risk and exposure in the Forex market. Verdure Forex Calculators implements 4 calculators in one single indicator. It is the first of it's kind on MT4 platform. Calculators implemented are: Lot (Trade or Contract Size) Calculator. Margin
Tick Volume Chart — fixed volume bars for MetaTrader 4. The utility creates charts on which each candle has a fixed tick volume. Data sampling is carried out not by time but by the tick volume. Each bar contains a given (fixed) tick volume. Tick volume can be adjusted by changing the value of the Volume parameter. You can apply indicators, Expert Advisors and scripts to the tick chart. You get a fully functional chart, on which you can work just as well as on a regular chart. In the process of w

Information is a subject of the market mood. Information is objective when it comes from different sources. If information is identical then we may speak about its convergence. Otherwise, we may speak about its conflict (divergence). Indicators and oscillators are the s ources of information of the technical analysis. Bearish CD HBT Osc (Bearish Convergence/Divergence High Bottom Top Oscillator) is a universal analytical bears convergence/divergence indicator between any of the twenty three st

Information is a subject of the market mood. Information is objective when it comes from different sources. If information is identical then we may speak about its convergence. Otherwise, we may speak about its conflict (divergence). Indicators and oscillators are the sources of information of the technical analysis. Bearish CD HTB Osc (Bears Convergence/Divergence High Top Bottom Oscillator) is a universal analytical bears convergence/divergence indicator between any of the twenty three sta
Information is a subject of the market mood. Information is objective when it comes from different sources. If information is identical then we may speak about its convergence. Otherwise, we may speak about its conflict (divergence). Indicators and oscillators are the sources of information of the technical analysis. Bullish CD LBT Osc (Bullish Convergence/Divergence Low Bottom Top Oscillator) is a universal analytical bulls convergence/divergence indicator between any of the twenty three sta
Information is a subject of the market mood. Information is objective when it comes from different sources. If information is identical then we may speak about its convergence. Otherwise, we may speak about its conflict (divergence). Indicators and oscillators are the sources of information for technical analysis. Bullish CD LTB Osc (Bullish Convergence/Divergence Low Top Bottom Oscillator) is a universal analytical bulls convergence/divergence indicator between any of the twenty three stand

This is our newer and improved tool to assist you in the Elliott Wave counting, which represents an improved version of the ElliottWaveTool7pasos idea. How to Use It Start counting a new wave Start by clicking the "<>" button to indicate you want to deselect any previous wave (if applied). Set the pattern's type that you want to count (if you do not have our free Elliott Wave Font, you will see the letters instead of the pattern's icons in the Type's Section buttons: I=Impulse, D=Diagonal, Z=Zig

Este indicador mejora las capacidades de zoom (ampliación) de las velas de tu gráfico en MetaTrader 4 de 3 modos diferentes: 1) Fijado de niveles y zoom para el time frame Puedes fijar niveles de escala de precios y zoom para cada timeframe seleccionando el primer modo de Zoomer en las propiedades del indicador. Luego en el gráfico, fija los niveles de precio que deseas visualizar, arrastrando el mouse en la zona de escala de precios y el nivel de zoom usando los botones Zoom in o Zooom out en
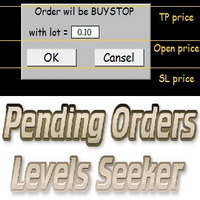
This script is designed for quick and precise placement of pending orders. Just drag and drop it on the chart. Select the position for Open price, TP price and/or SL price. Pending Orders Levels Seeker understands what kind of pending orders you want to place. It warns you if there are incorrect values in Open price, TP price or SL price. Lot can be changed from the panel of the script only at the first launch or if you want to set a new value for it. The script remembers the lot size of the las
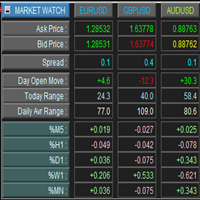
This is a panel for market review and evaluation of multicurrency price movements. It shows main parameters for a user defined group of symbols in the form of a table. The following values are displayed: Symbol name; Ask price value; Bid price value; Spread size in pips; Stop level in pips - may be hidden by a user; Change of price in pips comparing to the day start; Current daily range (High - Low) in pips; Average daily range in pips for user defined number of days; Price change percentage dur

Description One of the Dow theory tenets states: "Trends are confirmed by volume". This product is a multicurrency/multisymbol indicator that has been designed to define large and/or small tick volumes according to the mentioned tenet. The indicator may be used with any broker, irrespective of the name of the financial instrument since it is necessary to manually enter the name as an input parameter. If you enter a non-existent or incorrect name of a financial instrument, you will receive an err

PositionSizer es un indicador que le ayudará a saber cuantos lotes necesita abrir para tener una posición que arriesgue un porcentaje establecido de su cuenta. Para usarlo solo agrege el indicador al gráfico y cuando desee saber el tamaño de la posición, si desea hacer los calculos para una compra pulse Shift B (de Buy) y si desea hacer los cálculos para una venta pulse shift S (de Sell) 3 arrows de precio aparecerán en su gráfico, una azul que representa el punto donde desearía entrar al merc

Description The Panel is designed to select top signals from the terminal database and the MQL5.community website. To allow web requests for the program, you need to enable the "Allow WebRequest for the following URL" option in the terminal settings and explicitly manually specify URL https://www.mql5.com/ .
Parameters The terminal tab — selecting signals form the terminal data base. sorting — choose a sorting field to select the best signals from the data base: NONE RATING DATESTART DRAWDOWN

This is a simple but functional Moving Average Cross Alert, just set the parameters for both moving averages and when they cross or are equal you will get an alert. If you configure your terminal to send emails or notifications, the indicator will send you an alert by mail or notification. You can set the number of iterations for your alerts on the platform and the interval between the alerts. You can use Simple, Exponential, Smoothed or Linear Weighted moving averages. You can apply any type of

The analyzer allows you to visually evaluate the margin level change when changing the price and position volume. The product shows the price level at which Stop Out, is activated, as well as the total buy and/or sell position level. The calculations are made only for the orders opened for the current chart's symbol. Impact of other orders is not considered. The panel allows you to quickly increase or decrease position volume in the most efficient way.

Description Pivot Lines is a universal color multicurrency/multisymbol indicator of the Pivot Points levels systems. You can select one of its three versions: Standard Old , Standard New and Fibo . It plots pivot levels for financial instruments in both windows simultaneously. The system will automatically calculate the Pivot Point on the basis of market data for the previous day ( PERIOD_D1 ) or week ( PERIOD_W1 ) and the system of support and resistance levels, three in each. It can also displ

The script allows to close all opened positions for a given currency pair (EURUSD by default, but it can be change to any existing currency pair). Input parameters sSymbol = "EURUSD"; PendingOrders = false; which will appear in the Inputs tab where you can change a working symbol and set PendingOrders to true to delete all pending orders for a given currency pair. This script will close and delete all positions for a given currency pair only. Keep in mind that you have to "Allow automated tradin

This script is designed and used to move StopLoss for all EURUSD positions (or any other available currency pairs) at once. The Stop Loss will be moved to a level: Bid - StopLevel (for Long position) Ask + StopLevel (for Short position). STOPLEVEL applies to distance between entry price and SL. Of course, this script will move the StopLoss only if: Bid > OrderOpenPrice() + StopLevel (for Long) and Ask < OrderOpenPrice() - StopLevel (for Short). When you put the script on the chart the Input Box

The script allows you to close all opened positions for a given currency pair ( EURUSD by default, but it can be changed to any existing currency pair) when Sum of Profit from all opened positions (by chosen currency pair) is equal or greater than value of the input parameter: SumProfit .
Input Parameters sSymbol = EURUSD SumProfit = 100 Slippage = 2 You can change SumProfit to any positive value ( in dollars , not in points!). This script closes all positions for a given currency pair only.

BuyStop_SellStop_Grid script opens BuyStop and SellStop pending orders. You just need to drop this script on the chart with a desired currency pair. Before placing all pending orders, the input window is opened allowing you to modify all input parameters: LongPos - if TRUE, BuyStop orderi is opened. ShortPos - if TRUE, SellStop order is opened. InitLot - initial lot. LotCoeff - if 1, all pending orders will have the same lot size. InitStep - difference between two consecutive orders in points.

BuyLimit_SellLimit_Grid script opens BuyLimit and SellLimit pending orders. You just need to drop this script on the chart with a desired currency pair. Before placing all pending orders, the input window is opened allowing you to modify all input parameters: LongPos - if TRUE, BuyLimit order is opened. ShortPos - if TRUE, SellLimit order is opened. InitLot - initial lot. LotCoeff - if 1, all pending orders will have the same lot size. InitStep - difference between two consecutive orders in poi

Complete Pending Orders Grid System opens any combinations of Buy Stop, Sell Stop, Buy Limit and Sell Limit pending orders and closes all existing pending orders. You just need to drop this script on the chart of a desired currency pair. Before placing all pending orders, the input window is opened allowing you to modify all input parameters: DeleteAllPendings – if true , then all pending orders (for current currency) will be deleted. BuyStop – if true , BuyStop order is opened. SellStop – if tr

Description Trend Trading is an innovative analyzer designed for trend following trading. The analyzer consists of a trend line, colored bars, arrow pointers and reference information. After completion of the current bar, the trend line, the color of the bar and the arrow pointers are not redrawn. Change of market sentiment can be calculated based on one of the fourteen basic indicators included in the standard package of MT4, it affects the color of the trend line. Optionally colored bars, arro

Indicador que te da una alerta sonora, email y notificación de Metatrader (push notification) cuando una línea de tendencia es cruzada. Se puede definir el nombre de las líneas de tendencia que se desean observar, separandolas con una coma en las propiedades del indicador. Trabaja en 2 modos diferentes: Con cruce de velas cerradas Bajo este modo, solo si una vela rompe la línea de tendencia y permanece así hasta que termine de formarse (es decir que se abra una nueva vela) se dará la notificació

Description Stoploss Master Expert Advisor helps you to manage the virtual Stop Loss. It replaces the real Stop Loss levels by virtual ones with further trailing according to its own strategy of preserving a reached profit level. This EA is used when following the trend. In multicurrency/multisymbol mode, the EA is attached to the chart of each financial instrument separately and tracks positions only of a certain financial instrument. Management is performed only by market orders. The EA starts

The analyzer panel allows traders to add the pending order grid (Buy Limit, Sell Limit, Buy Stop, Sell Stop) quickly and efficiently. Parameters stop mode - select stop setting mode every order - stop levels are set for each order separately position as - common stop levels for all orders order type - select pending order type Buy Limit Sell Limit Buy Stop Sell Stop magic - set a magic number for open orders if necessary. If position as mode is enabled, stop levels are corrected for all orders

This script searches for all positions for the current currency pair and calculates the sum of all lots for those positions with negative profit and offers to open a hedge (opposite) position with a lot size equal to the calculated sum of lots multiplied by LotCoeff. You just need to drop this script on the chart with a desired currency pair. Before placing opposite orders, the input window is opened allowing you to modify all the input parameters: LotCoeff = 1.5; BuySearch = true; SellSearch =
¿Sabe usted por qué MetaTrader Market es el mejor lugar para vender estrategias comerciales e indicadores técnicos? Con nosotros, el desarrollador no tiene que perder tiempo y fuerzas en publicidad, protección del programa y ajustes de cuentas con los compradores. Todo eso ya está hecho.
Está perdiendo oportunidades comerciales:
- Aplicaciones de trading gratuitas
- 8 000+ señales para copiar
- Noticias económicas para analizar los mercados financieros
Registro
Entrada
Si no tiene cuenta de usuario, regístrese
Para iniciar sesión y usar el sitio web MQL5.com es necesario permitir el uso de Сookies.
Por favor, active este ajuste en su navegador, de lo contrario, no podrá iniciar sesión.