Nuevos robots comerciales e indicadores para MetaTrader 4 - 298
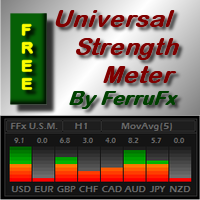
PRO version is available here: https://www.mql5.com/en/market/product/12648 FFx Universal Strength Meter is more than a basic strength meter. Instead of limiting the calculation to price, it can be based on any of the 19 integrated strength modes + 9 timeframes. With the FFx USM, you are able to define any period for any timeframe. For example, you can set the dashboard for the last 10 candles for M15… Full flexibility! Very easy to interpret... It gives a great idea about which currency is weak
FREE
This indicator is an interpretation of the Average Directional Movement Index (ADX), which helps to determine the presence of a price trend. It was developed and described in detail in the book "New Concepts in Technical Trading Systems" by Welles Wilder. The presented indicator displays signals on the price chart when +DI and -DI cross and signals when the ADX value falls or rises in relation to the mutual arrangement of +DI and -DI. The indicator's buy signals also work as a support level, whi
FREE
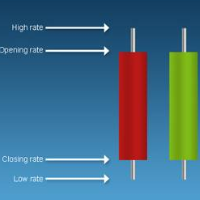
'Info body and shadow candles' indicator colors the candle bodies and shadows according to the settings. For example, if the 'Size body candles' parameter is 10, the indicator looks for the candles having a body size of 10 or more. Candle shadows are calculated the same way. Detected candles can be colored (body color, shadow color). The indicator can be adjusted for both four- and five-digit quotes. МetaТrader 5 version: https://www.mql5.com/en/market/product/12977 Parameters Use candle search

This indicator is a perfect tool able to compare which brokers have the lower latency. It shows us immediately which brokers are slower or faster. When you see the dot icon on the line, it means this broker is the faster one and the red line (Broker_A) is the slower one. See the example on the screenshot.
How It Works? This indicator shares the prices information to and from the "shared" common data folder. It compares all the prices. The price is based on average by (Ask + Bid) / 2. There are
FREE

This indicator is used to determine the trend. Standard Three Moving Average and ADX indicators are used. It has the indicator warning system (audio, e-mail) and three types of alerts, including messages to mobile phone. It shows the best performance on M5. When the trend value reaches the value set, the warning system is activated. This indicator works only with Forex symbols.
Inputs SoundAlarm = true - Sound Alert Sendmail=true - Send an e-mail in case of a buy or sell signal Sendnotification
This is a purely Price Action indicator that tracks the open and close prices of all 28 major Forex currency pairs and calculates a volatility value based on every tick in real time. It only tracks raw price data and not data from another indicator and it does not use any complicated formula or algorithm in calculating volatility. This version shows volatility for all 28 major currency pairs
Benefits Accurate and real time update of volatility Volatility across all 28 major Forex currency pairs
This is a purely Price Action indicator that tracks the open and close prices of all 28 major Forex currency pairs and calculates a volatility value based on every tick in real time. It only tracks raw price data and not data from another indicator and it does not use any complicated formula or algorithm in calculating volatility. This version only shows volatility for a single currency pair
Benefits Accurate and real time update of volatility Volatility across all 28 major Forex currency pairs

Gerente de Riesgos TPSpro es un sistema único de control de riesgos profesional para comerciantes de cualquier formación y capital. Le permite evitar pérdidas en el comercio y errores graves en las transacciones.
TPSpro Risk Manager es necesario para la gestión de riesgos, principalmente para revendedores y traders intradía, pero lo utilizan con éxito traders de cualquier estilo comercial. El panel tiene 3 columnas, cada una de las cuales contiene información útil.
La primera columna mue

The idea of the indicator stems from the necessity to clearly define the borders of support and resistance levels, which helps to plan the opening and closing of positions in the areas that most appropriately determine the process. Look at the breakdowns of the resistance level that confirm the intention of the price to continue the upward movement, after it passed the support level and entered the channel formed by the two levels. The same is for the case when the price enters the channel downw

Wave Hunter uses pending orders for trading. It is a scalping strategy for trading breakthroughs. The EA is based on a breakthrough of a channel formed on a specified interval. Wave Hunter uses trailing and breakeven after reaching a few points of profit, thus cutting a possible loss. Wave Hunter always has a fixed stop loss. At the same time, the take profit is unlimited, deals are closed based on a different principle. Trading strategy of the Expert Advisor is the use of the regularity in the
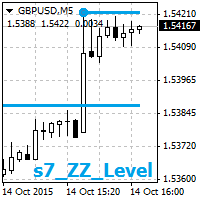
The indicator displays two nearest levels in real time. The one above the current BID price is a resistance level. The one below the current BID price is a support level. The levels are calculated by the standard ZigZag indicator.
Application The indicator can be used as an assistant in manual trading to obtain data on the nearest support/resistance levels. The indicator can be used on any timeframe. When a displayed level is touched or broken through, an audio alert is triggered (specified in

The Expert Advisor oriented to work on 5-digit ECN account with low spread. The EA is uses the price level breakthrough strategy. The default settings are optimized for trading on EURUSD.
Recomendations ECN broker with a low spread and accurate order execution; Deposit from 50 USD on a standard account or 10 USD on a cent account; Virtual private server. After installation please set the risk parameter or fixed lot depending on your trading style. I prefer a fixed volume.
Features The EA does

You can fins our other products from link : https://www.mql5.com/en/users/drbastem/seller Also, you can ask all your questins from email : haskayafx@gmail.com or mobile : +90 530 867 5076 or @MehmetBastem on telegram application This indicator is used to determine the trend. Standard MACD indicator is used. It has the indicator warning system: beep, e-mail and has three types of alerts, including messages to mobile phone. It shows the best performance on the chart of 5 minutes. When the

This indicator shows the market entry and exit points. It is good for both beginners and professional traders. The product works on any timeframe and financial instrument. The indicator is designed for scalping. It does not redraw. It is based on the divergence between two moving averages, which have a special smoothing algorithm. The first moving average is colored in Magenta . It indicates the general movement of the trend. The second moving average is colored in LawnGreen . It appears on the

MagicSignals EA is a fully automated Expert Advisor . It uses smart algorithms to open any trade.Also this system come with very smart Money Management code and not like other Expert Advisor with this ea you will cant use fixed lot to trade. You must use the very smart Money Management system inside this ea to open any trade, you will need only to put your risk and the system will do all other job for you. And if you put zero in the risk setting the system will open the small lot that can make t
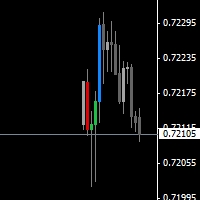
The indicator shows the higher timeframe candles on the current chart. Candle colors are selected according to four different calculation methods.
Parameters Time frame - larger timeframe period Candles mode - calculation method affecting candle colors Normal - standard bars, candlesticks and candle bodies Heiken Ashi - Heiken Ashi bars, candlesticks and candle bodies Emini PVA - PVA (Price-Volume Analysis) bars, candlesticks and candle bodies, as well as standard bars Sonic PVA - PVA (Price-Vo
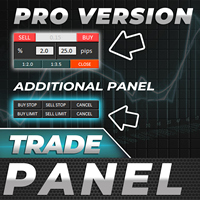
Esta versión PRO del panel de operaciones simplifica las operaciones para quienes cumplen con la administración del dinero en función del tamaño del límite de pérdidas y la carga del depósito. Una herramienta conveniente para quienes necesitan abrir órdenes sin perder tiempo en cálculos de lotes. Los valores de riesgo y los tamaños de stop loss se pueden configurar en los campos del propio panel, lo que reduce el tiempo para configurar el lote deseado. El tipo de MM seleccionado visualmente en l

This indicator will draw Support and Resistance lines calculated on the nBars distance. The Fibonacci lines will appear between those 2 lines and 3 levels above or under 100%. You may change the value of each level and hide one line inside 0-100% range and all levels above or under 100%.
Input Parameters: nBars = 24; - amount of bars where the calculation of Support and Resistance will be done. Fibo = true; if false then only Support and Resistance will be shown. Level_1 = true; - display of th

The indicator is based on the two-buffer scheme and does not require any additional settings. It can be used on any financial instrument without any restrictions. The indicator is a known ZigZag, but it does not redraw . The indicator allows to easily detect significant levels on the price chart, as well as demonstrates the ability to determine the probable direction of a price movement. The calculations are based on the candles' Close prices, thus improving the reliability of the levels.
Param
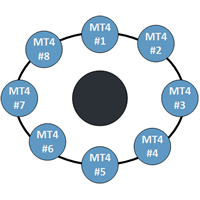
This indicator is a perfect tool able to compare which brokers have the lower latency. It shows us immediately which brokers are the slower one and the faster one. When you see the dot icon on the line it means this broker is the faster one and the red line (Broker_A) is the slower one. See the example on the screenshot.
How it works? This indicator shares the prices information to and from the "shared" common data folder. It compares all the prices. The price is based on average by (Ask + Bid)

VR Ticks es un indicador especial para estrategias basadas en especulación. Gracias a este indicador, el operador puede ver el gráfico de ticks directamente en el gráfico principal del instrumento financiero. Un gráfico de ticks le permite ingresar una posición en el mercado o cerrar una posición en el mercado con la mayor precisión posible. VR Ticks traza los datos de las garrapatas en forma de líneas que cambian de color según la dirección; esto le permite comprender y evaluar visualmente la s
FREE

ADX arrow
Este indicador muestra las señales del indicador ADX (Índice de Movimiento Direccional Promedio) como puntos en el gráfico.
Esto facilita la identificación visual de las señales. El indicador también cuenta con alertas (cuadros de mensajes emergentes) y el envío de señales al correo electrónico.
Parámetros Período -período promedio. Aplicar a-precio utilizado para los cálculos: Cerrar, Abrir, Alto, Bajo, Mediana (alto+bajo) / 2, Típico (alto + bajo + cerca) / 3, Cierre Pond
Pipfinite creates unique, high quality and affordable trading tools. Our tools may or may not work for you, so we strongly suggest to try the Demo Version for MT4 first. Please test the indicator prior to purchasing to determine if it works for you. We want your good reviews, so hurry up and test it for free...we hope you will find it useful.
Attention This trading tool is specifically designed to help grid, martingale, averaging, recovery and hedging strategies. If you are not familiar with th

The Grid Builder MT4 utility is designed for placing a grid of pending orders of any complexity and will be an excellent tool in the hands of a trader who trades grid trading strategies. The tool has numerous settings that allow you to quickly and easily build a grid of orders with the specified parameters. All types of pending orders are supported:
Buy Stop; Buy Limit; Sell Stop; Sell Limit. The script also allows you to delete a previously placed grid of orders in one click. If the "Delete
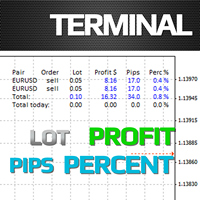
The Terminal indicator is a substitution for the standard Terminal tab. The indicator is displayed as a kind of table consisting of several elements: A row with column descriptions; Open orders; Summary information of open orders; Summary information of current day closed orders. The indicator settings: Graph corner for attachment - the corner of the chart where the table will be positioned Font - font type Fontsize - font size Text color - display settings
Profit color - display settings Loss c
FREE

Announce on 15 May 2018 We need to inform you that nowadays we've already stopped support and the EA isn't updated anymore. The causes came from a couple of reasons as you can see below; Changing in the Forex market conditions. Health problems of software developers. Yours faithfully,
What is Relativity System ? The Expert Advisor has been developed for more than five years according to the Trade for Living concept. Relativity System passed optimization more than 1,000 times to search fo

The indicator has been developed for scalping. The indicator is based on a mathematical calculation that determines the percent range of the price channel, which is generally formed at the time of the accumulation of positions. Once the price moves beyond its borders, a signal is generated in the form of dots. The indicator has a minimum of settings - the frequency of signals. Smaller values produce more signals.
Parameters: Multiplier - the frequency of signals (with lower values signals are m
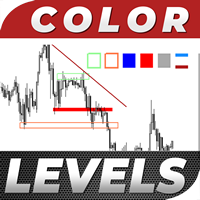
Color Levels is a convenient tool for traders using a Trendline and a Rectangle in their technical analysis. It allows setting two empty rectangles, three filled ones, and two tredlines. The indicator parameters are very simple and divided into numbered blocks: The ones beginning with 1 and 2 - empty rectangle (frame) parameters; 3, 4, and 5 - filled rectangle parameters; 6 and 7 - trendline parameters. Simply click a desired object and it will appear in the upper left corner. Main Adjustable Pa
FREE
Este indicador funciona solo en Brokers de 5 Digitos !!!!
Es imposible hablar del estudio del mercado Forex o de cualquier tipo de mercado sin tener en cuenta las estadisticas del mismo.
En este caso, con el indicador "price statistics" tenemos una nueva forma de estudiar nuestro grafico, dando informacion del precio en un rango de pips que queramos estudiar
por ejemplo: podemos saber cuantas veces cierra o abre el precio en espacios de 10, 20, 30, 50, 100 Pips o mas; y no solo saber eso en

Auto Close & Delete All is an assistant to help you quickly close all trades of a selected symbol or all symbols and delete pending orders. Through its flexible settings, you can set the script to either close only trades, or only pending orders, or both market trades and pending orders. The script can close deals and delete pending orders wither for the current instrument, or for all instruments. This is selected in settings. The settings are displayed on the screen before the script execution,
FREE

Auto SLTP Maker MT4 is an assistant for all those who forget to set StopLoss and/or TakeProfit in deal parameters, or trade on a very fast market and fail to place them in time. This tool automatically tracks trades without StopLoss and/or TakeProfit and checks what level should be set in accordance with the settings. The tool works both with market and pending orders. The type of orders to work with can be set in the parameters. It can track either trades for the instrument it runs on, or all

It is an automatic system that is optimized and ready to use. The EA uses averaging of loss-making positions and the martingale system if the price goes against the direction. The EA opens orders in a particular direction, so that in case of unfavorable development of the situation on the market, it can close a series of deals at the minimum price retracement. The strategy is pretty good. This is a scalper, hence makes a large number of transactions. This is a fully automatic system, but it can

The algorithm based on strict adherence to the price movement (trend) and fixing of any slightest movement. To enter into the market, it uses the instant price movement of an instrument. The EA places Take Profit and Stop Loss to lock in profits and to limit possible losses. The Trailing Stop function allows to fix any sign of market movement. Aggressive scalper can work both with a fixed lot and using percent of deposit. It uses market orders. Does not use such trading elements as Martingale o

Before news release, the EA places two pending orders at a preset distance from the current price – BUYSTOP and SELLSTOP. If the published news does not immediately cause a strong price movement, and the price starts to slowly move in a certain direction, the EA moves one of the order away, and the other one is moved closer following the price, until the price starts moving fast or the orders expire. This makes it possible to place orders as close as possible to the price (20-30 points for the f

The indicator is based on MA with additional processing of all the current prices, as well as all Highs and Lows for an appropriate period. The product efficiently displays trend changes and tracks a trend line and color if conditions remain unchanged. The indicator has only three parameters making it easy to configure.
Parameters PeriodTrend - amount of bars used for a trend calculation PeriodAverage - indicator line averaging period Method - averaging method

The indicator displays volume profiles based on the nesting principle. Profiles periods are pre-set so that each subsequent profile has a length twice as long as the length of the previous profile. In addition to profiles, the indicator displays volume clusters sorted by color, depending on the volume they contain.
Indicator operation features The indicator works on typical timeframes from M5 to MN, but for calculations uses historical data from smaller timeframes: M1 - for timeframes from M5
FREE

Volume Delta is a very powerful indicator that reads the supply on the Market. It calculates the Delta from movement of the price and the difference of BUY and SELL Tick volumes. Its special structure allows you to get all timeframe values available on the MT4 platform. A good observation of this instrument can suggest great entry points and possible reversal. We are confident that this tool will help you to improve your trading timing. See also for MT5: https://www.mql5.com/en/market/product/5

Volume DeltaPanel is a very powerful indicator that read the supply on Market. It calculates the Delta from movement of the price and the difference of BUY volumes and SELL volumes. The Volumes are added to price and normalized to symbol points.
Its special structure allows you to get all Time Frames values available on the platform MT4. Panel can show 28 instruments simultaneously all customizable according to the offer of the Broker. A good observation of this instrument can suggest great ent

Price Trend Light indicator is a beautiful indicator that shows purchasing areas and sales areas. This indicator is designed to follow the movement of the price which rounds on the opening price. It also provides information of trend follow on the break of the minimum and maximum. The indicator has a very simple graphic but effective, above the opening price you will have a light green color and under the opening price there is a red light. On every Break Out of the minimum or maximum sets in in

Swing Fibo Marker is adaptive advanced indicator that automatically detects price swings. After swing detection, it draws five profit targets, entry level and stop loss level. Levels are calculated base on price swing size, according to Fibonacci levels specified as entry points. When price touch the level indicator create alerts. List of supported alert types: Popup alerts Email alerts Push notification On screen output Suggested timeframe to trade: H1 or higher. The higher timeframe is used to
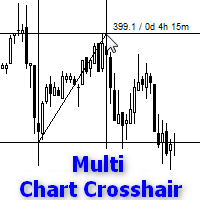
Indicator works like script and shows crosshair on all charts of any symbol. It can be used for comparison price levels and time periods on all charts of the same currency pair or for comparison candles according to time periods on charts of any symbols. You can also compare different types of charts, for instance standard chart with tick or range bar charts. Indicator can be easily attached to chart from navigator menu or using hotkey Ctrl + F, which you need to set manually. Moreover you can a

The script draws levels based on the weekly options reports published on the ftp server of CME Group ftp://ftp.cmegroup.com/bulletin/. On the server, select the report for the day preceding the one you want to draw the levels on (to draw levels on 02.10.2015 download a report of 01.10.2015, most reports are published at 10:00 Moscow time the day after the reporting date, this is exactly what we need). Select the required option from the downloaded ZIP file, for example for EURUSD you need Sectio

This is a grid Expert Advisor using EMA to filter a trend and CCi to enter the market. It allows you to manually filter flat and trend parts of the market or traded symbols. The lot is calculated based on the smart algorithm depending on the order location. The EA features the filter of the minimum distance between unidirectional orders calculated based on the specified percentage of the average daily candle for 21 days allowing the EA to avoid excessive load on the deposit. The profit is fixed
Reversal Breakout is a real breakout strategy. It is based on Moving Average indicator to define market trend and breakout points. Try to entry when price reverse is not good, because there are many false reversal signal, so that it is better to trade breakout at reverse point. This EA will work for all Timeframe, but I prefer to use it on H1 or above. Should use it on major pairs which are lowest Spread, and lowest Slippage: EURUSD,GBPUSD,USDJPY,GOLD,... No martingale No Grid Always use Stoplos

BG Rebate is a new Expert Advisor for trading EURUSD. Timeframe - М1. It uses signals of built-in indicators to enter the market. The indicators determine the best parameters for entry basing on the price chart analysis. Open orders form a basket of orders that close by the indicator signal. A stop loss working only during very strong impulse price movements is assigned to each order. Such movements do not occur during a morning flat, which is the time when the EA is active. The minimum deposit

This indicator based on Alpha Trend Spotter, Moving Average, and RSI Indicators. Its Customized for H4 (Four Hour) Timeframe where the price do real swing. This indicator doesn't have setting value, just plug and play in H4 Timeframe. Best performance with pairs: EURUSD GBPUSD EURJPY GBPJPY
Entry conditions: LINE CROSS ATS < 30, HOLD and then line TOUCHING BACK TO 30 = LONG ENTRY LINE CROSS ATS > 70, HOLD and then line TOUCHING BACK TO 70 = SHORT ENTRY
Exit conditions: LONG CLOSE IF CROSS ATS

This tool serves two purposes. It enables you to place a live trade on a live chart . It allows you to place trades in the strategy tester as it runs. On a live chart you can place a trade by: Clicking a Buy, Sell or Pending Lines button. Scheduling a Buy, Sell, or Pending using the scheduler. In the included screenshots you can see four panels labeled: Manual Trading. Order Lines (pendings). Trade Status. Scheduler. Across the top we can: Hide Panels. Fix the scale. Zoom the chart in/out. Chang
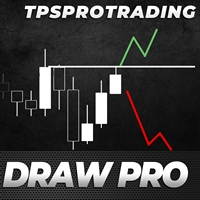
The TPSproDraW indicator allows to draw continuous zigzag lines on the chart. This handy tool will strike fancy of those traders who trade using technical analysis and need visual expression to forecast the price movement.
A drawn continuous zigzag line can be removed as easily as it is drawn - just aim a mouse cursor to the zigzag line and press the Shift key. How it helps:
The Z key - double press to enable the mode of drawing patterns, press one time to disable the mode, Esc - cancel drawn ob
FREE

This indicator calculates the volume profile and places labels that correspond to the VAH, VAL and POC levels, for each candle individually.
Indicator operation features The indicator works on the timeframes from M5 to MN, but it uses the history data of smaller periods: M1 - for periods from M5 to H1, M5 - for the H4 period, M30 - for the D1 period, H4 - for the W1 period, D1 - for the MN period. The color and location of the VAL, VAH and POC labels on the current candle are considered to be c
FREE
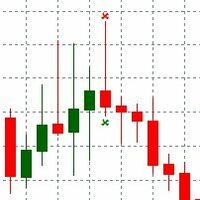
PinBar indicator is an Indicator identifies price reversal, pattern and timely identifies that price trend is changed. The Trend change is immediately identified over the chart. Alert is send over the Chart and Email address. Indicator generated Signal Price is displayed over the chart near the PinBar. Please make sure to use on Higher time frames if you are swing trader. for day traders who want to use M30 or M15 time frames, Take profit should be kept minimal. Lower than M15 is not recommende

[EA] MECHANIC is a MetaTrader (MT4) Expert Advisor designed for use with three basic currency pairs EURUSD, GBPUSD and AUDUSD. With individual settings, it can work very well on any currency pair as well. The EA implements complete, fully functional and exact mechanical trading strategy, with no place for emotions. It is based on standard MT4 indicators "Bollinger Bands" and "Parabolic SAR". The strategy is working on Timeframe M5 only. It is very easy to set up and supervise.
Features It can b
The indicator uses 2 Moving Average: 1 fast EMA and 1 slow EMA to define trend, reversal signal and breakout point. Reversal Signal comes on open time, it can be used as scalping signal for short time, but be careful with this signal because it may be an anti-trend signal, the indicator tries to catch reverse point. Breakout signal is where support or resistance was broken out, the reversal signal has failed. Breakout signal is stronger than the Reversal Signal. We can use support/resistance lev

Este indicador de información será útil para quienes quieran estar siempre al tanto de la situación actual de la cuenta. El indicador muestra datos como ganancias en puntos, porcentaje y moneda, así como el diferencial del par actual y el tiempo hasta que la barra se cierra en el período de tiempo actual. VERSIÓN MT5 - Indicadores más útiles
Hay varias opciones para colocar la línea de información en el gráfico: A la derecha del precio (corre detrás del precio); Como comentario (en la esquina
FREE

The market is unfair if only because 10% of participants manage 90% of funds. An ordinary trader has slim changes to stand against these "vultures". This problem can be solved. You just need to be among these 10%, learn to predict their intentions and move with them. Volume is the only preemptive factor that faultlessly works on any timeframe and symbol. First, the volume appears and is accumulated, and only then the price moves. The price moves from one volume to another. Areas of volume accumu

The indicator is based on Moving Average to define the trend, then it finds a good entry point and follows the trend. We will keep open on a new signal until the trend is changed, and all trades exit on an opposite signal. The exit point is a bit late relative to the highest profitable point (at top/bottom), but it is the best point to exit your trades. Keep the trades, which are moving the right direction to get a high profit, and stop wrong trades as soon as possible when the trend is changed
Vanesa RSI Reverse provides an amazing trading strategy. Use optimization function of Strategy Tester in MetaTrader 4 to find out many high potential parameter sets in very long term of history data (more than 2 years). The EA works well with XAUUSD in M15 but it also give similar results in others symbols and time frame. It just takes some minutes to try it out in your own history data to see the very good performance. We will continue to improve the strategy to get better performance in next v
FREE

BigPanel is a plug-in indicator that works exclusively with Control adora Expert Advisor. Its main functions are as follows: Select two types of button arrangement (horizontal or vertical) Change the buttons' size (from small to big; there are five different sizes in total) Move the buttons' panel around the chart. The arrangement and size can be settled in the indicators properties. To move the buttons' panel, click once over the hand button and move your mouse, the panel will follow it. To sto
FREE

The indicator Net Change is a very useful tool able to extrapolate a percentage in order to have a real reference on the performance of the instrument. This indicator is designed to show the main values: you could monitor the Daily, Weekly, Monthly, Quarterly, Semi-annual and Annual percentages. A necessary tool for those who want to really explore the quantitative logic of the market.
Input values SYMBOLS SETTINGS Use_Only_Current_Symbol (true/false): Permits to manage only current symbol on p

The Best and Worst indicator (similar to Net Change Indicator) has the peculiarity of being a dynamic indicator. It seems a very Stock Exchange Indicator. This means that it is able to draw up a list and put in order the best and worst instruments in descending order. You can choose to show the percentage of any Time Frame: 1M, 5M, 15M, 30M, H1, H4 etc ... This instrument could really give great suggestions on your trading in order to center the right time and to have a total view of the markets
BuyLimit and SellLimit Buttons opens any combination of Buy Limit and Sell Limit pending orders and closes all existing pending orders. If boolSL = true, then the EA will add a Stop Loss value to all pending orders. If boolTP = true, then the EA will add a Take Profit value to all pending orders.
Inputs Before placing all pending orders, the input window is opened allowing you to modify all input parameters: DeleteAllPendings: if true , then all pending orders (for the current currency) can be

The EA distinguishes a sideways trend from a directional one and changes its trading tactics. When an opposite signal appears, an opposite order is opened, covering the opposite ones. And changes the parameters opposite to close. The Expert Advisor is intended for trading only on foreign exchange market FOREX. Does not work on stock and commodity instruments. Recommended for use on variable periods M5, M15 and H1.
ADVISOR PARAMETERS: ID Expert Advisor - Magic number of the advisor. period FAST

The indicator compares Fractal and Zigzag indicators to define hard Support and Resistance. The arrow signal appears when a new support or resistance emerges or when the price breaks through Support and Resistance zone. This indicator is efficient in conjunction with a rebound and breakout strategy. It works well on H4 and D1 for all pairs.
Settings BarCounts = 200; FastPeriod = 7 - fast period SlowPeriod = 14 - slow period Show_SR = true - show support/resistance Show_Arrows = true - show up/d

Using high-volatility channel breakout-style trading systems has historically worked well across major currency pairs, show promise in determining the opportune time to trade the channel breakout trading strategy. This Breakout Strategy may look simple, but it is good follow trade trader strategy.
Setting: Channel Periods: default 20 BarsCount: bars count in history Alert_Settings = "+++++++++++++++++++++++" SendMailMode = true - Send email SendNotificationMode = true - Send notification to you

Piramida Grid Piramida Grid: para ingresar al mercado, el asesor analiza las lecturas del indicador de la línea de dirección de la pendiente. Cambiar la cuadrícula de órdenes cuando el mercado se mueve a la inversa. Trabajar en órdenes pendientes BUYSTOP y SELLSTOP. Utiliza un sistema de promedio de pérdidas con control del saldo de las operaciones abiertas y su salida sin pérdidas. Detección automática de 6 y 5 dígitos.
Configuración del asesor: período = 32; - período del indicador de l
Martin Pristine Martin Pristine es un robot comercial, un asesor que utiliza el análisis de las lecturas del indicador Price Channel Central como señales para tomar decisiones comerciales. No se requiere la instalación adicional del indicador en el gráfico, el indicador está integrado en el interior del Asesor Experto. Después de cada operación perdedora, el volumen se multiplica por 2. El Asesor Experto detecta automáticamente 5 y 6 dígitos en las cotizaciones de pares de divisas. Solo pu
The utility copies trades from the signal provider accounts (master accounts, one or multiple providers) to unlimited number of receiver accounts (slave accounts). Attention! Y ou need to use identifiers (Provider number) of the same length if you use several master copiers. For example. 1, 2, 3 or 11, 13, 22. The copying can be set in the opposite direction. The comments with all the recently performed actions are displayed on the screen to monitor the utility actions in slave mode. To avoid p

YF-Meter indicator help you to find the fastest speed up currency pairs.
While the US news are released, non-US currencies rising up or dropping down at the moment.
It is important to consider "the opportunity cost" of opening the positions.
If we can find the fastest rising up or dropping down currency pairs, that would improve our trading. This idea comes up with "Newton's laws of motion", different from the traditional volatility measurement.
After adjustment by the unique filter(the digital

The Expert Advisor is a risk manager helping users to control their trading. In the settings, it is possible to specify the parameters at which the risk manager force closes the opened trades and closes the terminal as well, if it is needed to prevent opening trades on emotions, which do not correspond to the trading strategy. Risk Manager settings Check limit to close - check the equity limit Limit to close (account currency) - equity limit that is checked when Check limit to close is act

Trend Trade indicator is based on ADX indicator to define long/medium/short trend and good entry signals. The product supports virtual trade on chart to show where/when should we make an entry/exit. It works very well on D1 or above. The indicator is efficient on GOLD and CFDs. Alert_Settings = "+++++++++++++++++++++++" SendMailMode = true - Send email SendNotificationMode = true - Send notification to your phone AlertMode = true - Sound alert Show_Virtual_Trades = true - Show virtual trades Sin

i-Regression Channel generates regression channel: Linear regression channel consists of two parallel lines located at the equal distance from the linear regression trend line. The distance between the channel borders and the regression line is equal to the value of the highest close price deviation from the regression line. degree - degree of regression, changes from 1 to 61; kstd - regression channel width; bars - the number of bars for the channel calculation; shift - the channel horizontal s
MetaTrader Market es el mejor lugar para vender los robots comerciales e indicadores técnicos.
Sólo necesita escribir un programa demandado para la plataforma MetaTrader, presentarlo de forma bonita y poner una buena descripción. Le ayudaremos publicar su producto en el Servicio Market donde millones de usuarios de MetaTrader podrán comprarlo. Así que, encárguese sólo de sus asuntos profesionales- escribir los programas para el trading automático.
Está perdiendo oportunidades comerciales:
- Aplicaciones de trading gratuitas
- 8 000+ señales para copiar
- Noticias económicas para analizar los mercados financieros
Registro
Entrada
Si no tiene cuenta de usuario, regístrese
Para iniciar sesión y usar el sitio web MQL5.com es necesario permitir el uso de Сookies.
Por favor, active este ajuste en su navegador, de lo contrario, no podrá iniciar sesión.