Nuevos robots comerciales e indicadores para MetaTrader 4 - 293

Description Impulse Pro is an indicator's impulse trading system based on Moving Average and MACD Line . The idea of the impulse system based on Moving Average and MACD Histogram was first offered by Dr. Alexander Elder in his book "Come Into My Trading Room". The system allows users to choose the calculation method (Moving Average and MACD Line) based on a single, double or triple moving average. You can color bullish and bearish moods.
Inputs Calc_Method - Moving Average and MACD Line calcul

Fibonacci Ratio is useful to measure the target of a wave's move within an Elliott Wave structure. Different waves in an Elliott Wave structure relates to one another with Fibonacci Ratio. For example, in impulse wave: • Wave 2 is typically 50%, 61.8%, 76.4%, or 85.4% of wave 1. Fibonacci Waves could be used by traders to determine areas where they will wish to take profits in the next leg of an Up or Down trend.

FFx Engulfing Setup Alerter gives trade suggestions with Entry, Target 1, Target 2 and StopLoss. Below are the different options available: Entry suggestion - pips to be added over the break for the entry 3 different options to calculate the SL - by pips, by ATR multiplier or at the pattern High/Low 3 different options to calculate the 2 TPs - by pips, by ATR multiplier or at Risk/Reward Offset the dashboard - any place on the chart Remove the suggestion once the price reached the SL line Lines

FFx InsideBar Setup Alerter gives trade suggestions with Entry, Target 1, Target 2 and StopLoss. Below are the different options available: Entry suggestion - pips to be added over the break for the entry Minimum candle size - to avoid too close buy/sell entry suggestions 3 different options to calculate the SL - by pips, by ATR multiplier or at the pattern High/Low 3 different options to calculate the 2 TPs - by pips, by ATR multiplier or at Risk/Reward Offset the dashboard - any place on the c

FFx OutsideBar Setup Alerter gives trade suggestions with Entry, Target 1, Target 2 and StopLoss. Below are the different options available: Entry suggestion - pips to be added over the break for the entry. 3 different options to calculate the SL - by pips, by ATR multiplier or at the pattern High/Low. 3 different options to calculate the 2 TPs - by pips, by ATR multiplier or at Risk/Reward. Offset the dashboard - any place on the chart. Remove the suggestion once the price reached the SL line.

This Expert Advisor checks the Price before Start_Hour (input parameter) and opens Buy or Sell position if the conditions are right. You have PipsLevelOpen and PipsLevelClose input parameters to optimize the EA for each and every currency pair and timeframe. You can switch TrailingStop off by setting this input parameters to 0 (zero). If UseMM (input parameter) = true, then Money Management system will be switched on with PercentMM (input parameter) as a percent from Account Free Margin .
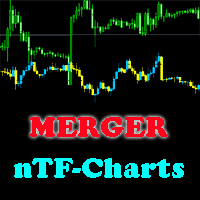
This indicator will help you merge two (or more than two) charts to view multi-symbols in just 1 chart (see the screenshots). You can choose any symbols to add with any timeframe you want. You can choose bull/bear color for bars. You can mirror the chart that will be added. If you want to add many charts, just run the indicator many times with each symbol and each timeframe.

El indicador Four Moving Averages ( ver descripción, vídeo ), es análogo al Four Moving Averages Message , muestra simultáneamente en la ventana principal del gráfico cuatro líneas Medias móviles con los ajustes por defecto: La Verde y la Roja representan la tendencia a corto plazo, la Roja y la Azul, el la tendencia a medio plazo, la Azul y la Amarilla, la tendencia a largo plazo. Es posible cambiar los ajustes de las medias móviles, así como el color. Sin embargo, debo observar que los parám

MACD Color ( véase la descripción y el vídeo ) es un indicador parecido a MACD Message , que se utiliza para la plataforma MetaTrader 4. A diferencia de un indicador estándar, éste cambia el color del borde de las barras cuando se cambia la situación del mercado -se cambia la fuerza de la tendencia o el ángulo de inclinación de la EMA principal que representa el nivel cero- cambia el color del nivel cero (se puede desactivar este parámetro en los ajustes). Este indicador puede utilizarse en una

The indicator is based on pair trading methods. It is not redrawn unlike similar indicators. Shows correlation between two selected instruments in percent for a predetermined period, and the positions of the instruments relative to each other. Has a function for reverse display of any of the analyzed symbols - for instruments with negative correlation. Can be drawn as a line or as a histogram. Settings: Symb1 - first symbol name. Revers1 - reverse display of the first symbol. Symb2 - second symb

The Four Moving Averages Message indicator ( please see the description and video ), a version of Four Moving Averages , concurrently displays four Moving Averages with default settings in the main chart window: Green and Red ones represent a short-term trend, Red and Blue ones - mid-term trend, while Blue and Yellow ones - long-term trend. You can change the moving average settings and colors. However, these parameters have been configured so that to allow trading on all time frames. The built-

Description Fibo Levels is a color multicurrency/multi-symbol indicator that automatically plots Fibonacci levels on a candlestick chart in a separate window below the chart of the main financial instrument. It can be used with any broker, regardless of the name of a financial instrument used because the symbol name must be entered manually as an input parameter. If you enter a non-existent or invalid name of a financial instrument, you will receive an error message saying that the specified f

Description Fibo Levels is a color multicurrency/multi-symbol indicator that automatically plots Fibonacci levels on any of the following six standard indicators ( AD, OBV, MA, Momentum, ATR and StdDev ) in a separate window below the chart of the main financial instrument. It can be used with any broker, regardless of the name of a financial instrument used because the symbol name must be entered manually as an input parameter. If you enter a non-existent or invalid name of a financial ins

Description Fibo Levels is a color multicurrency/multi-symbol indicator that automatically plots Fibonacci levels on a Heiken Ashi chart in a separate window below the chart of the main financial instrument. It can be used with any broker, regardless of the name of a financial instrument used because the symbol name must be entered manually as an input parameter. If you enter a non-existent or invalid name of a financial instrument, you will receive an error message saying that the specified

Overview With Account details info script you will get the following account info: Account Number Account Name Account Currency Company (Broker) of the Account Server you are using Account Leverage Stop Out Level Account Balance Account Equity Account Margin Account Free Margin Symbol of the chart you dropped the script on Lot Size Min Lot allowed Lot Step Max Lot allowed Tick Value Tick Size Spread Stop Loss Level Swap Long Swap Short Initial Margin Maint Margin Required Margin is the Trading A
FREE

This indicator is based on the classical Alligator indicator. The proposed indicator has the ability to increase a smooth-effect in Alligator Indicator. This indicator could play an important role in determining support and resistance lines. Support occurs when falling prices stop, change direction, and begin to rise. Support is often viewed as a “floor” which is supporting , or holding up, prices. Resistance is a price level where rising prices stop, change direction, and begin to fall.

An indicator of patterns #45 and #46 (Three Falling Peaks and Three Rising Valleys) from Encyclopedia of Chart Patterns by Thomas N. Bulkowski. Parameters: Alerts - show alert when an arrow appears Push - send a push notification when an arrow appears (requires configuration in the terminal) PeriodBars - indicator period K - an additional parameter that influences the accuracy of pattern shape recognition. The smaller the value is, the smoother the row of peaks/valleys should be, so fewer patt

This is an indicator that helps you to see what symbols have the best SCORE of SWAP and SPREAD. The SCORE is calculated as follows: SWAP/SPREAD. So, the higher SCORE/SPREAD symbols have, the better (because everyone wants their orders to have positive swap, while keeping spread small). This indicator will help traders have an advantage in swap when choosing symbols and type (buy or sell) to make an order. You can see (in the picture) that this indicator shows a list of symbols with their score b
El indicador único IceFX VelocityMeter para la plataforma MetaTrader 4 mide la velocidad del mercado fórex. No se trata de un indicador corriente de volúmenes y otras magnitudes, ya que IceFX VelocityMeter es capaz de comprender la velocidad de los movimientos del mercado ocultos en los tics, y esto constituye una información valiosa que no está disponible en la velas comunes, por eso no puede ser obtenida por un indicador normal. Este indicador controla la llegada de los tics (frecuencia y magn
FREE

Indicador de la plataforma comercial MetaTrader 4. Un indicador agradable, pequeño, que no ocupa mucho espacio en la ventana del gráfico, pero representa la información necesaria: los volúmenes de las posiciones abiertas y el beneficio total según ellas. Es posible cambiar a su gusto el tamaño de la fuente, el ángulo y el color. Por defecto, las posiciones en positivo son de color verde, y las posiciones en negativo, de color rojo. ¡Que tenga usted buen comercio!

The Expert Advisor for increasing (or opening) market positions. Allows specifying the desired risk, target and searching for the best open price and trade volume.
Configurable Parameters: lots - directly the volume of the position increase.
% equity - the amount of growth as a percentage of the amount of funds.
stop loss - directly the level of the stop loss order.
loss - the level of the stop loss order depending on the allowable loss.
take profit - directly the take profit level of

Auto ZZ SR Indicator
This indicator automatically draws trend lines using ZigZag top and bottom points. The more ZigZag tops/bottoms that are used, the greater the number of possible combinations. Therefore, the more possible trend lines can be drawn. And vice versa too. The fewer ZigZag tops/bottoms that are used, the lower the number of possible combinations. And therefore, the fewer the possible trend lines can be drawn. The indicator constantly updates the trend lines on the chart as the ma
FREE

Unlike the standard indicator, Stochastic Oscillator Message ( please see the description and video ) features an alert system that informs you of changes in the market situation using twenty signals: the Main line and Signal line cross in the area above/below the levels of extremum (below 20%; above 80%); the Main line and Signal line cross within the range of 20% to 80%; the Main line crosses the levels of extremum; the Main line crosses the 50-level; divergence on the last bar. Parameters of

RSI TrendLine Divergency Message is an indicator for the MetaTrader 4 trading platform. Unlike the original indicator, this three in one version has a system of alerts that inform on market situation changes. It consists of the following signals: when the Main line crosses the levels of extreme zones and 50% level; when the Main line crosses the Trend line in the indicator window; divergence on the last bar. Parameters of levels of extremum, 50-level and divergence are adjustable.
Parameters L
The Expert Advisor trades in the direction of the current trend, the algorithm is based on calculating the width of the trading range for a given interval and assessing price movements on short time intervals. If the impulse value exceeds a specified percentage of the trading range, a position is opened in the direction of the trend. The impulses are also additionally filtered using a special technique. When evaluating impulses, the tick history inside the bar is not used . The algorithm uses
Some trading strategies are suitable for the quiet market with less volatility, while others are suitable for the volatile and violent market. Either way, traders should have a clear measure of how hot or cold the market is. This product is convenient for traders to compare the degree of cold heat of different trading varieties, or the trading heat of the same trading variety in different time periods. You can put it on different charts to get the intuition. It's easy to see which is more hot an

MACD Message is an analogue of the MACD Alert for the MetaTrader 4 terminal with more advanced functionality: Parameters 'Averaging Method' and 'Price Type' ( MA method and Apply to ) are displayed in the settings window. It gives an advantage of monitoring convergence/divergence of all types of Moving Average (Simple Averaging, Exponential, Smoothed and Linear Weighted) and by any price (Closing Price, Opening Price, the Maximum Price for the Period, the Minimum Price for the Period, Median Pri

Awesome oscillator with overbought and oversold zones. A series of OBS indicators (overbought and oversold) - these are indicators enhanced with overbought and oversold zones. This makes it possible to determine when the instrument is trending, as well as when it is flat. Works on all timeframes, all currency pairs, metals and cryptocurrencies. Can be used with binary options. Settings
OBS Period - period of overbought and oversold calculation
This product is used to check the foreign exchange market history datas. Good quality historical datas is important for traders to perform market analysis or back testing. But the quality of historical datas provided by various foreign exchange brokers is uneven. Sometimes we notice missing k-line sequences, but sometimes it is not easy to detect them. This product helps users locate these missing locations.If there are many gaps in a given period of time on a chart, you need to be careful about

CMI - Profit from trending and ranging markets. The CMI indicator is a two-part system used to trigger both trend and counter-trend trades, that has been introduced by Daniel Fernandez in an article published in Currency Trading Magazine (August 2011 issue). It is a simple, yet effective indicator, which gauges whether the market has behaved in a choppy (non-directional) manner or trending (directional) manner. CMI calculates the difference between the most recent bar's close and the close n bar

The indicator draws trend lines based on Thomas Demark algorithm. It draws lines from different timeframes on one chart. The timeframes can be higher than or equal to the timeframe of the chart, on which the indicator is used. The indicator considers breakthrough qualifiers (if the conditions are met, an additional symbol appears in the place of the breakthrough) and draws approximate targets (target line above/below the current prices) according to Demark algorithm. Recommended timeframes for t
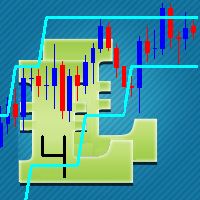
This indicator is based on the classical Envelopes indicator. The proposed indicator has the ability to increase a smooth-effect in the Envelopes Indicator. This indicator could play an important role in determining support and resistance. nPeriod input parameter determines the number of Bars for Moving Above Envelopes calculation.
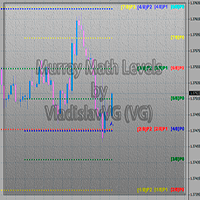
This indicator calculates and displays Murrey Math Lines on the chart. The differences from the free version: It allows you to plot up to 4 octaves, inclusive (this restriction has to do with the limit imposed on the number of indicator buffers in МТ4), using data from different time frames, which enables you to assess the correlation between trends and investment horizons of different lengths. It produces the results on historical data. A publicly available free version with modifications intr

Smart Trend Line Alert es un indicador profesional de las líneas de tendencia, así como de las líneas de soporte/resistencia con la función de la alerta.
Características: El modo Auto y Click para convertir la nueva línea dibujada en la línea de alerta («Línea de tendencia» o «Línea horizontal»); La división entre las líneas de diferentes períodos de tiempo mediante la ocultación de las líneas de los períodos menores en los períodos mayores para no confundirse en la gran cantidad de líneas de
FREE
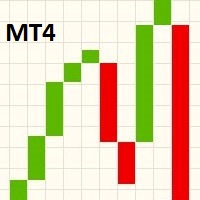
Este indicador muestra el gráfico de ruptura de línea en la ventana principal del gráfico. Para ver el gráfico de ruptura de línea separadamente, cambie la vista del gráfico principal para la muestra en forma de la línea, luego cambie el color de la línea por «None» (no hay) en las propiedades del gráfico que se abren con el botón F8. Al usar el scrolling, escalamiento o al cambiar el símbolo/período del gráfico, el indicador cambiará el tamaño de los bloques en el siguiente tick para que quepan
FREE

The indicator calculates critical price levels. If the level is red, the price has passed it downwards; if the level is blue, the price has passed it upwards. If the price is approaching the blue level from below, that level will most probably be broken through. If the price is approaching it from above, there will most probably be a rollback. Similarly, if the price is approaching the red level from above, the level will most probably be broken through. If the price is approaching it from below

The EA performs trade operations of closing position groups. Positions are grouped by type. It is possible to select orders by the profit (loss) value. It is possible to form the closure groups manually. You can set a value for automatic closure of a positions group after reaching a certain profit/loss level or price level. The additional functions of the EA are called using the hot keys: SHIFT+A - show/hide Auto exit options. SHIFT+S - show/hide Settings panel. SHIFT+V - sound ON/OFF. SHIFT+I -
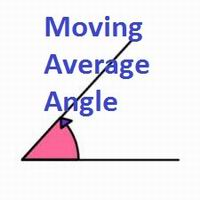
This indicator shows you the angle of the moving average according to your settings in a separate window. It also shows the angle written on the chart, which can also be adjusted. The main features and input variables provided include: MAPeriod: This is the period for your moving average. The default MAPeriod is 5. LookBack: This is a very important variable. It allows you to set the look back bar, from which the angle will be measured. For example, if your LookBack is 5, then indicator will cal

Accelerator indicator with overbought and oversold zones. A series of OBS indicators (overbought and oversold) - these are indicators enhanced with overbought and oversold zones. This is the standard indicator, but it provides additional possibilities for the analysis of any market. Thanks to a special algorithm, this indicator has overbought zones =70 and =100, as well as oversold zones -70 and -100, which allows you to use it to determine the possible reversal or pullback of the price, as well
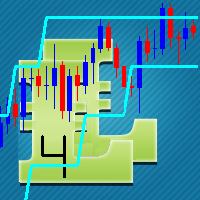
The concept of bands, or two lines that surround price, is that you will see overbought and oversold conditions. The proposed indicator has the ability to increase a smooth-effect in the bands Indicator. This indicator could play an important role in determining support and resistance. nPeriod input parameter determines number of Bars for Moving Above Bands calculation.

This indicator is suitable for seeing trends and determining the time to open a position. It is equipped with a Stop Loss position. Easy to use. Just watch the arrows provided.
Indicator parameters Shift - the number of bars used for the indicator shift to Right." Step Point per Period - the number of pips for down or Up trend lines" Time Frame - Calculate @ this Time Frame." Max_Bar - the number of bars used for calcuulate indicators (if '0' then All bars to calcuulate)." Alert_On - On or Off

El nuevo indicador AccountInfo de IceFX es capaz de abrir para usted las posibilidades más avanzadas de MetaTrader 4 (del build 600 en adelante). Este indicador puede representar de manera gráfica los datos básicos de la cuenta actual (saldo, equidad, recursos libres, beneficios/pérdidas actuales, beneficios/pérdidas en total, cantidad y tamaño de las posiciones abiertas, etc) de una manera elegante. El indicador AccountInfo representa gráficamente el saldo de la cuenta de los últimos días en el
FREE
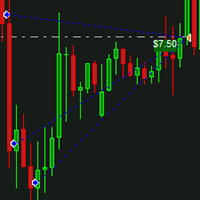
El indicador IceFX DrawProfit puede ayudar con eficacia a los traders que quieren ver en el gráfico el resultado para todas las posiciones cerradas: beneficios y pérdidas. Si coloca DrawProfit en el gráfico con un Asesor Experto activo, podrá avaluar fácilmente su trabajo en cuanto a los beneficios y las pérdidas. Particularidades principales: Dibuja las líneas de órdenes cerradas Dibuja beneficio/pérdida para las órdenes cerradas en una divisa determinada Suma las órdenes por las velas Filtro p
FREE
Summary of the Expert Advisor This EA will trade using standard MT4 indicators such as Moving Averages, MACD, RSI, Bollinger Bands, and so on. The EA was made so that these indicators can be mixed or matched so a number of possibilities can be traded with. Each indicator can be enabled or disabled and many settings are adjustable for each indicator. There are also other features included like multiple time frame capability and money management. As a result, many different trading strategies can
FREE
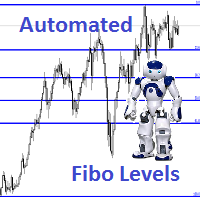
Description Fibo Levels is an indicator that automatically plots Fibonacci levels. The levels are calculated and plotted over a certain interval using the number of bars specified by the user . When the price achieve one of the target levels (23.6%, 38.2%, 50% or 61.8%) the indicator at the request of the user gives a sound signal and/or sends the message by e-mail. Example of the e-mail notification: Subject: Fibo Up Signal Message: Signal,H1 - Correction of EURUSD reached 23.6% - 2014

Features Supports the creation of Monthly, Weekly, Daily, 4 Hours, 1 Hours and 30 Minutes Market Profile. Daily Profile can have custom start time. Merge and Split of Market Profile Market Profile References Point can be exported to CSV format for any further analysis.
Indicator Parameters Indicator Update Interval - Choose indicator calculation period from 250 milliseconds to 2.5 seconds Indicator Setting ID - An ID for this particular indicator setting. Profile Number - The Number of Market

Cycles Predictor Indicator This indicator uses past market cycles to predict future price movements. The indicator scans through past data and considers combinations of cycles. When cycles coincide at the same future date/time then it is considered a valid future prediction. The predictions are drawn as vertical lines on the right side of the chart in the future. A prediction will often result in type of candle (ex. bull or bear) and/or a reversal point (ex. bottom or top) forming at this ex

The Bears indicator with overbought and oversold zones. Two display options - as a line and as a histogram. A series of OBS indicators (overbought and oversold) - these are indicators enhanced with overbought and oversold zones. This is the standard indicator, but it provides additional possibilities for the analysis of any market. Thanks to a special algorithm, this indicator has overbought zones =70 and =100, as well as oversold zones -70 and -100, which allows you to use it to determine the

Alex Profis is a fully automated Expert Advisor for Forex trading. The EA uses the strategy based on price levels' breakout. The main rule of the EA is to preserve and increase the account balance without large risks. Therefore, the EA is in the market for mere minutes, sometimes seconds per day. The best results are achieved on GBP/USD, EUR/USD, USD/JPY. The EA works on H1. The product requires a low-spread broker with accurate order execution. Real account monitoring: https://www.mql5.com/en/u

The script creates account summary report in a separate window. The report can be created for all deals and for deals on selected financial instruments.
It is possible to specify a time interval of calculation and save report to an htm file.
Script inputs
report starting date - initial report generation date. symbols selection for report - select a method of choosing tools for a report generation. allSymbol - report is generated for deals performed on all symbols. onlyCurrentSymbol - report

Smart Trend Line Alert is a unique professional Trend Line, Support Line and Resistance Line Touch and Break out Alert with awesome Alert History feature, designed to help traders easily manage many charts and symbols without staring at the monitor.
Features Candle Break Out Alert, Price Touch Alert and Time Line Alert; 1 click for converting any drawn line into an alert line (Trend line and Horizontal line or Trend Line By Angle); Alerts History able to re-open closed charts or re-draw delete

This indicator evaluates the market sentiment using raw price action measurements, and it is an amazing trading confirmation. It can be used to take a trend-trade approach or a contrarian approach using reversal patterns. [ Installation Guide | Update Guide | Troubleshooting | FAQ | All Products ] Find early reversals Confirm short-term trades Detect indecision on the market Take contrarian trades near support and resistance levels Trade inside bars confirmed by overall direction of the market T
FREE

The indicator identifies the direction and strength of the trend. Bearish trend areas are marked with red color, bullish areas are marked with blue color. A thin blue line indicates that a bearish trend is about to end, and it is necessary to prepare for a bullish one. The strongest signals are at the points when the filled areas start expanding. The indicator has only two parameters: period - period; offset - offset. The greater the period, the more accurate the trend identification, but with a

A moving average is commonly used with time series data to smooth out short-term fluctuations and determine longer-term trends. The proposed indicator has an ability to increasing a smooth-effect. This indicator could play an important role in determining support and resistance. An input parameter nPeriod determines number of Bars for Moving AboveAverage calculation.
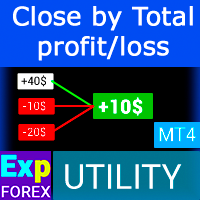
Cerrar posiciones en MetaTrader 4 al alcanzar la ganancia / pérdida total con la función de seguimiento de ganancias. Puede habilitar las paradas virtuales (orden separada) , Cálculo y cierre para posiciones de COMPRA y VENTA por separado (COMPRA VENTA separada) , Cerrar y calcular todos los símbolos o solo el símbolo actual (Todos los símbolos) , Habilitar trailing con fines de lucro ( Trailing Profit) Cierre sobre las pérdidas y ganancias totales en la moneda de depósito, punt

Panel de comercio para operar en 1 clic. ¡Trabajando con posiciones y pedidos! Operar desde el gráfico o desde el teclado.
Con nuestro panel de operaciones, puede operar con un clic del gráfico y realizar operaciones comerciales 30 veces más rápido que el control estándar de MetaTrader. Cálculos automáticos de parámetros y funciones que facilitan la vida de un comerciante y lo ayudan a realizar sus actividades comerciales de manera mucho más rápida y conveniente. Consejos gráficos e informaci

El EA modifica el nivel de Stop Loss de la posición abierta (en el instrumento actual). El SAR Parabólico , NRTR (Nick Rypock arrastre reversa) , se utilizan indicadores de MA o la regresión lineal del canal . Modos conmutables: Trailing stop sólo cuando se obtienen ganancias; Trailing stop solamente al precio; Trabajar en cada tick o en barras (formadas) completadas; Trailing para cada orden o la posición acumulativa.

El indicador representa dos medias móviles sencillas según los precios High y Low. La línea MA_High se representa cuando la media móvil está dirigida hacia abajo. Puede ser usada para establecer una orden stop para una posición de venta. La línea MA_Low se representa cuando la media móvil está dirigida hacia arriba. Puede ser usada para establecer una orden stop para una posición de compra. El indicador se usa en el experto TrailingStop . Parámetros Period - periodo de cálculo de la media móvil
FREE

Fibonacci SR Indicator Este indicador dibuja las líneas de soporte y resistencia. El producto se basa en los niveles de retroceso y expansión de Fibonacci (Fibonacci Retracement and Extension levels). El indicador toma en consideración múltiples combinaciones de los niveles de Fibonacci y dibuja las líneas de soporte/resistencia. En sus cálculos el indicador utiliza los valores de las crestas y los valles construidos por el indicador ZigZag. Si hace falta, también se puede mostrar el ZigZag en e
FREE

It predicts the most likely short-term price movement based on advanced mathematical calculations.
Features Estimation of immediate price movement; Calculation of the real market trend; Calculation of the most important support and resistance levels; Algorithms optimized for making complex mathematical calculations with a minimal drain of system resources; Self-adjusting for better performance, so it’s able to work properly at any symbol (no matter how exotic it is) and any timeframe; Compatib
FREE

The indicator gives signals on trend reversal or the possible direction of price movement when leaving the flat movement.
Features and settings: Sensitivity = 3 - sensitivity from 1 to 5; the higher the value, the more signals (example displayed in the screenshot below). DeepBars = 3000 - indicator display depth.
ZeroBarCalc = false - use a zero bar in the calculations; if yes, the signal will appear earlier, but it may disappear before the current candlestick is closed.
UseAlert = false - e

Este indicador implementa una forma del análisis técnico basada sobre la idea de que el mercado tiene una naturaleza cíclica. El Abanico de Gann (Gann Fan) se compone de los grupos de las líneas diagonales (llamados ángulos de Gann) que son nueve. Estos ángulos se colocan sobre el gráfico de precios formando las líneas de soporte y resistencia. La imagen obtenida permite predecir la futura dirección del movimiento del precio. Si antes el abanico de Gann se dibujaba a mano, ahora se puede refleja

Bulls indicator with overbought and oversold zones. Two display options - as a line and as a histogram. OBS (overbought and oversold) indicator series - are indicators that have been provided with overbought and oversold zones. This is the standard indicator, but it provides additional possibilities for the analysis of any market. Thanks to a special algorithm, this indicator has overbought zones =70 and =100, as well as oversold zones -70 and -100, which allows you to use it to determine the p

Logarithmic Network - cm-hourglass Expert Advisor The Expert Advisor places orders with a decreasing lot and step in the direction of the trend and with an increasing lot and step in the counter-trend direction. It sets Take Profit for every direction to avoid breakeven of the entire series. The farthest order in the direction of the trend is closed with a farthest counter-order so as to get the positive total, thus pulling the entire network to the price without letting it expand. Parameters Lo

Description Indicator for MT5 is here. It displays alternative (mathematically calculated) support and resistance levels, as well as the levels the price is most likely to achieve in the near future. The calculation is based on history data, and the quality of quotes is critical when generating lines. The lines built by Magneto Pro and Magneto Weekly Pro do not change on the entire calculation period.
Application Magneto Pro can be used both in conjunction with an existing strategy and as a se
The Synchronized Charts script allows comparing bars of different symbols or different periods of the same symbol. Attach the script to a chart and move bars or change the scale, all opened chart will move synchronously with the current one. The bars on different charts aligned to the border according to their open time. Please be sure the relevant history datas have been downloaded before synchronize charts. 。。。。。。。。。。。。。。。。。。。。。。。。。。。。。。。。。。。。。。。。。。。。。。。。。。

Индикатор Magneto Weekly Pro отображает: Недельные важные линии поддержки и сопротивления (выделены желтым, красным и синим цветами). Основные недельные цели (выделены белым цветом). Недельные паттерны возврата цены (обозначаются красными флажками). Применение индикатора Magneto Pro можно использовать и как дополнение к существующей стратегии, и как самодостаточную торговую стратегию. Данный продукт состоит из двух индикаторов, работающих на разных временных промежутках, и предназначен для скаль

EA puede cerrar posiciones no rentables buscando y cerrando posiciones rentables .
Este asistente busca , entre todas las posiciones, la posición menos rentable del terminal. Además, al buscar las posiciones rentables restantes, calcula una serie de posiciones que pueden cubrir la pérdida cuando la ganancia de una o más posiciones es mayor que la pérdida de otra posición. Si se encuentra un conjunto de dichas posiciones, el asesor las cierra. Una serie de puestos puede consistir
FREE

¡La versión gratuita de la estrategia «cuadrícula»! Es totalmente idéntica a la versión completa a excepto de que tiene una cantidad limitada de posiciones. Su objetivo consiste en sacar de la tendencia el máximo del beneficio (en modo automático) aprovechando de las correcciones tendenciales. Además, este Asesor Experto (EA) puede ser utilizado por los traders experimentados que operan manualmente. Está estrategia la utilizan muchos traders sociales de éxito que tienen más de 500 suscriptores d
FREE
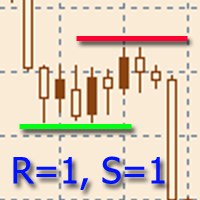
The indicator is designed to build horizontal support and resistance levels. The level search algorithm is based on the grouping of extremes. It is possible to display statistical information for each level, filter the display of levels by a number of properties, adjust the color scheme depending on the type of level (support or resistance). Features:
The indicator is ready to work and in most cases does not require special settings Manual or automatic selection of the range of extrema grouping
MetaTrader Market - robots comerciales e indicadores técnicos para los trádres, disponibles directamente en el terminal.
El sistema de pago MQL5.community ha sido desarrollado para los Servicios de la plataforma MetaTrader y está disponible automáticamente para todos los usuarios registrados en el sitio web MQL5.com. Puede depositar y retirar el dinero a través de WebMoney, PayPal y tarjetas bancarias.
Está perdiendo oportunidades comerciales:
- Aplicaciones de trading gratuitas
- 8 000+ señales para copiar
- Noticias económicas para analizar los mercados financieros
Registro
Entrada
Si no tiene cuenta de usuario, regístrese
Para iniciar sesión y usar el sitio web MQL5.com es necesario permitir el uso de Сookies.
Por favor, active este ajuste en su navegador, de lo contrario, no podrá iniciar sesión.