Nuevos robots comerciales e indicadores para MetaTrader 4 - 132

Achieving success in the foreign exchange (forex) marketplace can be challenging. Nonetheless, traders from around the globe, both experienced and novice, attempt to do exactly that on a daily basis. Given the above-average failure rate of new entrants to the market, one has to wonder how long-run profitability may be attained via forex trading. Among the many ways that forex participants approach the market is through the application of technical analysis. By definition, technical analysis is

Success comes from knowledge – this is true for most things in life and especially Forex trading. To become successful, a trader needs to learn technical analysis. Technical indicators are a big part of technical analysis. The problem is that, at first sight, names of technical indicators can sound unpleasantly complicated, for example, MACD, RSI or Stochastic. However, we recommend you not to judge a book by its cover. We will provide you with a fair and simple explanation of the most popular t

A forex robot is a type of computer program that’s designed to trade forex automatically. Forex robots follow a specific set of trade signals and settings in determining the best prices at which you can buy or sell a currency pair. They use complex mathematical algorithms to monitor the markets and follow price action. Forex robots can help both beginners and experienced foreign exchange traders maximize their return on investment. They eliminate emotional and psychological biases when trading a

Do you want to have a fully automated trading bot that trades instead of you to make profits all the time?
Get your unlimited account license copy for only £49.99 one time payment!
Features:
Forex Golden Moon EA Automated Forex Trading System For MetaTrader 4 Setup Instructions | Quick & Easy 5 Minute Setup | Set & Forget Unlimited Licenses For All Your MT4 Accounts No Trading Experience Required US Brokers | Non-US Brokers No Trading Account Limitations Optimised SET files included
Here’s

This EA can predict early trend on market, scan early trend from M5 to W1, This EA not martingale, not a hedging, not averaging and not grid. And this EA only open/close position once (only 1 opened order) every 8 hours. EA parameters : Trade_Set_AUTO , Default is ## AUTO Trade Setting ## , Mean Note for below parameter. LOT_SIZE_AUTO_TRADE , Default is 0.01 , Mean Lot Size to be traded is 0.01 Lot, Can be changed depend your account balance, (0.01 Lot Per 200 usd initial balance). A
This tool will assist all those who trade the forex market manually. It will help them in a sense that it will calculate the required margin in order to initiate a trade. This calculator is so simple to use that a that the user only inputs only 2 pieces of information. which are Price and Lot size the trader wishes to take. All other information needed to calculate the calculator will work it out by itself. It will run or calculate on the current opened chart. As the name suggest it's

EA always track the momentum and reversal of signal trading. Best for multi pair using in portfolio with low drawdown. Recommended pairs : GBPUSD,EURUSD,EURAUD,AUDCAD,EURNZD,EURCAD,NZDCAD Recommended TF : H1
This EA is partial martingale. So that it is balancing of Risk & Return. Start balance recommend 1000USD as well. Full setup able The strategy was Back-tested Stable from 2016 to 2021 using every tick based on real ticks

simple RSI EA bot. This EA Uses simple RSI and good Amount of risk and reward. And uses multiframe RSI Which is current and daily. Uses daily chart for find trend and not to trade in range market or low volume market You can change values as you want like : *take profit *stop loss *RSI indication levels *slippage *lot I have few sets that worked so well on some pairs like eurusd

Binary GURU es un indicador con más del 75 % de precisión para el comercio de opciones binarias y el comercio intradía a las 18:02 p. m. (+3 GMT). El indicador no se vuelve a dibujar y no cambia sus lecturas. Binary GURU está diseñado para determinar los lugares donde el precio hará una reversión. El indicador captura tanto los cambios de tendencia como los retrocesos, lo que le permite aumentar la eficiencia de su uso. Cuando se usa el indicador, las posibilidades de análisis se amplían signifi

The indicator is a polyline (ZigZag segment) that tracks and connects the extreme points of the chart price that are at least a specified size apart from each other in points on the price scale.
The one and only setting is the minimum size (in points) of a ZigZag segment. The indicator displays levels to determine a possible trend reversal:
level "LevelForUp" - the breaking of this level determines the possible reversal of the trend up (to buy);
level " LevelForDown " - the breaking o

Indicador único que implementa un enfoque profesional y cuantitativo para el comercio de reversión a la media. Aprovecha el hecho de que el precio se desvía y vuelve a la media de manera predecible y medible, lo que permite reglas claras de entrada y salida que superan ampliamente las estrategias comerciales no cuantitativas. [ Installation Guide | Update Guide | Troubleshooting | FAQ | All Products ]
Señales comerciales claras Sorprendentemente fácil de operar Colores y tamaños personalizables

Martingala. Parabolicum es un asesor experto multidivisa. Probado en 9 pares de divisas tanto por separado como simultáneamente:
Resultados de la prueba de monedas múltiples (Bróker: "Roboforex"): versión de "ParabolicumMT5" Símbolos de trabajo: EURUSD, GBPUSD, USDCAD, EURCAD, CADCHF, USDCHF, AUDCAD, AUDCHF, EURCHF Marco de tiempo H1 Depósito mínimo: $1000 (lote mínimo 0.01) Paso de lote recomendado 0.01 Tipo de cuenta de cobertura Funciones de expertos: Sensible a la " Spread ". Al
FREE

Realiza la exportación del historial de transacciones de la cuenta comercial actual. El archivo se guarda en la carpeta del terminal MQL4/Files ( que se puede abrir a través del menú principal del terminal: Archivo -> Abrir directorio de datos (Ctrl+Shift+D) e ir a la carpeta MQL5/Archivos) o en la carpeta Common/Files del terminal. El nombre del archivo se genera automáticamente o se configura manualmente a través de los parámetros del script. El archivo de his
FREE

EA Atom es un asesor experto con un algoritmo comercial único. El EA trabaja sobre el desglose de los niveles altos o bajos del día anterior Las estrategias exitosas y probadas se integran en el algoritmo del asesor, lo que le permite obtener ganancias en la fijación de precios de los activos con todas las sutilezas del análisis técnico e informático. ¡Contácteme inmediatamente después de la compra para recibir instrucciones, así como acceso a un chat privado de Telegram! Los ajustes están disp

EA Cyclone es un asesor experto con un algoritmo comercial único. El EA determina las zonas de reversión usando niveles de Fractal.
¡Contácteme inmediatamente después de la compra para recibir instrucciones, así como acceso a un chat privado de Telegram!
Al desarrollar este robot, se automatizó la popular estrategia comercial Fractal, lo que brinda un punto de entrada razonable para cada operación. Para un ajuste más fino del robot, participaron operadores experimentados de un fondo de invers

El filtro de Kolmogorov-Zhurbenko se puede considerar como una función de ventana especial diseñada para eliminar la fuga espectral. Este filtro es óptimo para suavizar series temporales estocásticas (incluidas las financieras). El indicador basado en este filtro contiene los siguientes parámetros: iLength: el período de la ventana rectangular original utilizada para construir el filtro. El valor válido es 2 - 255. iDegree - orden de filtrado. Si iDegree=0, entonces se obtendrá un promedio móvi

Neonys tiene un algoritmo complejo basado en inteligencia artificial. Su estrategia incluye el comercio seguro clásico utilizando patrones de ruptura y rebote de niveles. En su interior hay una arquitectura compleja de árboles de decisión, que contiene decenas de miles de patrones comerciales, promediados y ponderados para determinar las decisiones óptimas para entrar y salir de una operación. Se presta especial atención a las transacciones que salen: una red neuronal asíncrona separada es resp
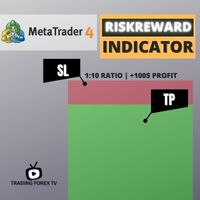
Si estás buscando un indicador de trading al más puro estilo Tradingview para dibujar en el gráfico tus operaciones con Take Profit (TP) y Stop Loss (SL) así como el punto de entrada, Risk Reward Indicator es tu indicador para Metatrader 4.
Este indicador, entre otras muchas funciones, te permite dibujar y simular operaciones , así como el ratio de riesgo (RB) beneficio y los pips que puedes gana o perder en esa operación.
Además, este indicador incluye una calculadora en donde podrás indicar

El robot de trading ORB-Williams FPO es el resultado de combinar diferentes estrategias de ruptura del rango de apertura (ORB) incluyendo la de Toby Crabel, junto con indicadores de tendencia adicionales para una mejor señal de entrada, con la estrategia salida de la primera apertura rentable (FPO) de Larry Williams. Puedes ver resultado de mi operativa real automatizada en señales: https://www.mql5.com/es/signals/1481106?source=Site +Signals+Favorites El Opening Range Breakout (ORB) es un rang

The "Easy Ichimoku Wave Meter" indicator is a basic tool to automatically determine Waves according to Ichimoku!
The indicator gives the possibility to simultaneously apply the Wave Theory, Time Theory and Target Price Theory according to the "Little Ichimoku" strategy developed by Sense Hosoda on the MT4 platform. The use of this tool allows not only novice traders to instantly (fully automatic) determine the waves and their rapid interpretation, it also allows to automatically measure the pr

Attention!!! Do not try to test the EA in the MT4 Tester, it is simply impossible, because the EA opens positions on 27 different instruments and 8 timeframe . The tester is able to test only one pair. Multi-currency tester is possible only in MT5. Instructions for launching a multi-currency tester in MT5: https://youtu.be/WrQQwMQclrY How EA works: 1. The main strategy for the breakdown of local extremes is used. 2. An additional algorithm is used to control losing trades and redistribute

Terminator - NAS100 is a scalper with push-back order system.
The robot collects a position from the order cloud, consistently fixing profits by trailing. A vulnerability on the NAS100 tool is used as a signal. And high volatility allows you to make a profit on short sessions.
For correct operation, you need to download the settings file and select the correct account!
Parameters have been optimized for NAS100 with !!!!(7 digits) !!! and spread 0.7 Works for a broker - https://www.vantag

Battle of the Somme - it is a Secure Automated Software for trade Forex market and indices.
This EA uses the trench logic, looking for the strong and weak points of the market to initiate trades in favor of the market that we will call "offensive trades" or looking for strong points to make a "trench" and prepare to defend ourselves from the market attack. Logically, as in any market, the same as in trench warfare, most of the market is carried out with minor operations that look for market we

The Strategy Tester product is an indicator where you can both test and run strategies. There are 64 strategies in total in this indicator. It uses 3 indicators. You can test tens of thousands of strategies by changing the parameter settings of these indicators. You can run 6 strategies at the same time. With this product, you will now create your own signals.
Recommendations and Features Used indicators: Macd, Bulls power, Bears power It works on all time frame Recommended time fram

The Strategy Tester product is an indicator where you can both test and run strategies. There are 64 strategies in total in this indicator. It uses 3 indicators. You can test tens of thousands of strategies by changing the parameter settings of these indicators. You can run 6 strategies at the same time. With this product, you will now create your own signals.
Recommendations and Features Used indicators: Osma, Money Flow index, Stochastic It works on all time frame Recommended time

The Strategy Tester product is an indicator where you can both test and run strategies. There are 64 strategies in total in this indicator. It uses 3 indicators. You can test tens of thousands of strategies by changing the parameter settings of these indicators. You can run 6 strategies at the same time. With this product, you will now create your own signals.
Recommendations and Features Used indicators: Rsi, Bears power, Stochastic It works on all time frame Recommended time frame

The Strategy Tester product is an indicator where you can both test and run strategies. There are 64 strategies in total in this indicator. It uses 3 indicators. You can test tens of thousands of strategies by changing the parameter settings of these indicators. You can run 6 strategies at the same time. With this product, you will now create your own signals.
Recommendations and Features Used indicators: Rsi, Osma, DeMarker It works on all time frame Recommended time frame H1 You

The Strategy Tester product is an indicator where you can both test and run strategies. There are 64 strategies in total in this indicator. It uses 3 indicators. You can test tens of thousands of strategies by changing the parameter settings of these indicators. You can run 6 strategies at the same time. With this product, you will now create your own signals.
Recommendations and Features Used indicators: Stochastic, Macd, Williams Percent Range It works on all time frame Recommended time fr
Индикатор Strong Reversal Points H1 показывает стрелками сильные разворотные точки на таймфрейме H1. Индикатор не перерисовывает! Для максимального винрейта торгуйте только на таймфрейме H1 и только 3 (три) основные валютные пары: EURUSD, GBPUSD, USDCAD! Обязательно! Перед торговлей или тестом (прогоном в тестере) убедитесь в том, что в вашем терминале MT4 установлен правильный час открытия торгов в Нью-Йорке (параметр Terminal_NewYork_Open_Hour). Нужен час открытия Нью-Йорка именно по времени в

Tomando como base el Indicador Diamond Trend , el cual ha demostrado buenos resultados hasta ahora detectando Tendencias , aqui llega un nuevo Asesor Experto que toma ventaja de su potencial para abrir posiciones. Es recomendable usar una cuenta con apalancamiento de 1:500 o superior para mitigar el tipico riesgo de fallo por falta de margen para operar. Fundiona en cualquier periodo de tiempo para Forex, Criptomonedas, GOLD/AUXUSD, BRENT,... (no testado con Indices) DTT EA controla sus propia
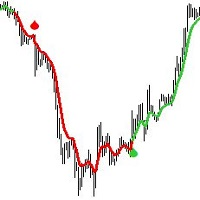
Introducing the Tear Drop Indicator: Your Gateway to Confident Forex Trading.
The Tear Drop Indicator is a powerful MetaTrader 4 tool designed to simplify trend identification and streamline entry point selection. Built upon customized Moving Average principles, this intuitive indicator offers traders an unparalleled advantage in navigating the forex market.
Key Features: 1. Customized Moving Average: The Tear Drop Indicator harnesses the power of customized Moving Averages, providing traders
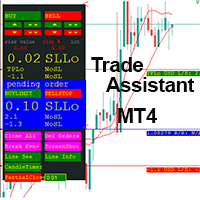
This EA is a trade management tool for Mt4 and Mt5. Mt5 version will find the Mt5 section here: https://www.mql5.com/en/market/product/80399?source=Site +Market+MT5+Utility+New+Rating006. It was to make a way for the trader to make the initial decision of when and which direction to enter. The trader decides in advance whether he wants the robot to take or stop an order. He also decides what new lot size, percent size or money size to use on each trade. On a live chart you can place a t

The system is designed for trading on currency pairs AUDCAD,EURAUD, EURCAD and EURCHF M5 trades at 23 and 0 hours. The EA has an adaptive order tracking system that always adapts to the market, where there is no fixed take profit and stop loss, which allows you to adapt to different market situations. For some reason, the update version 1.9 indicates the added EURUSD pair in English, there is no such error in Russian, there is a EURCAD pair added there. Therefore, once again, the ADVISER trades

This trading expert advisors trades best on XAUUSD minute 5 timeframe. Maintains a constant account growth and runs best on low spread and commission based accounts. Uses Martingale & perfect hedging to recover unprofitable positions ensuring no loss. Its consistent perfomance curves proves the record for itself in reliability and consistency plus its unique market analysis ensures quick extraction of profits by scalping the markets. Advising to be used as it is to reduce risk and for healthy t

A multi-currency scalping robot at night. In the second version, only EURCHF is traded. Signal version 1.0 (Multiplier = 1) Night Zen - the night scalper uses low-volatility areas on the chart to search for a potential price reversal. The Expert Advisor enters the market with only one transaction if all conditions are met. To protect trades, the EA sets a fixed Stop Loss. The adviser can close a deal both on Take Profit and on the strategy embedded in it. The Expert Advisor trades on the m15 tim
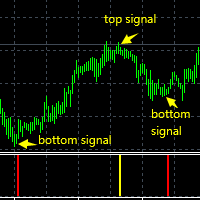
The super trade signals channel index system automatically calculates the supporting lower track and resistance upper track according to the fluctuation amplitude of K-line at this stage and the position of space.
The super trade signals channel indicator system will automatically calculate and detect the supporting lower rail line and resistance upper rail line at the position of K line in real time. When the price of K line touches the supporting lower rail line, it will automatically prompt

This trading expert advisors trades best on GBPNZD minute 5 timeframe. Maintains a constant account growth and runs best on low spread and commission based accounts. Uses Martingale & perfect hedging to recover unprofitable positions ensuring no loss. Its consistent profit curves proves the record for itself in reliability and consistency plus its unique market analysis ensures quick extraction of profits by scalping the markets. Advising to be used as it is to reduce risk and for healthy tradi

BUILD YOUR GRID
The expert is a system to help any trader to make a grid of orders (without martingale, lite martingale, or full martingale) easy and simple. Please make your test to find your settings. Default settings are just to take an idea of how the expert works. The expert can make according or contrary grid of orders. You can set the expert to work in hedge mode if the losses are huge. The system uses a high-risk strategy. It's better to test it first in a demo account.
Version for MT5
FREE
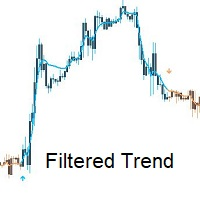
Introducing Filtered Trend: Your Reliable Companion in Forex Trading.
Filtered Trend is a powerful MetaTrader 4 indicator that revolutionizes trend identification and entry point selection in the forex market. Built upon customized Moving Average principles, this intuitive indicator offers traders a simple yet effective tool for navigating the complexities of currency trading.
Key Features: 1. Customized Moving Average: Filtered Trend leverages customized Moving Averages to provide traders wit

A complete Session Timer that shows the current time, session information with remaining time, chart display of range (high-low) and open price, of current and previous sessions for major markets, and option to add an additional city. A friendly user interface with clickable icons, customizable panel location and format, selection of colors and text. It automatically handles the DST (daylight saving) settings. It also shows the GMT/UTC and server (broker) time. And includes a Candle timer option
FREE

This indicator is very useful for day traders or short term traders. No need to calculate the number of pips manually, just look at the chart and you will see the Virtual Take Profit / Virtual Stop Loss target line and evaluate whether the entry point is feasible to reach the intended target or not.
Enter the intended Take Profit / Stop Loss pips for your trade. The indicator will display Virtual Take Profit / Virtual Stop Loss lines for you to easily see if the target is feasible or not.
FREE
http://onlineskoleniakurzywebinareburza.cheapindex.com/happy77-system-3-robot-2-in-1-en/
See new video Nasdaq100 from 25K TO 80K IN 3 MONTH,UK100,Forex reults https://youtu.be/z4A0i-EJDuE System3 use Move average+own indicators,+Our Science Reseach rules +special functions for save+reduce drawdown We trade it success 20 yrs.
Contact us on mesenger -Profitable setting set files from us free you need know buy or sell for product from chance for more profits
Aviable profitable setting tested ab

https://youtu.be/I46sDVz9tSo
to use it correctly you need to change lots to 0.01 Recommend pair EURUSD Time Frame H1 ,best leverage for this EA is 1:1000 and above (FBS broker serve this leverage) This EA Cut Switch Martin open position based on OsMA indicators, if the transaction hit stop loss then EA will switch to a new transaction with double lots so that once profit can cover losses many times before it becomes profit Has passed 5 years bactest whit good result ,first backtest capital $
[ MT5 Version ]
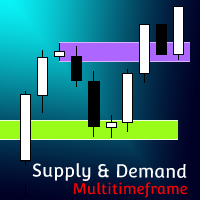
Supply and Demand Multitimeframe Supply and Demand Multitimeframe is the first indicator in the market that combines multiple aspects like trading volume, price structure and momentum to identify Supply and Demand zones for every asset. The Supply and Demand indicator analyzes simultaneously up to 4 different TFs and represents their information in the current graph. Its interactive UI highlights everytime the price enters a Supply or Demand zone even if the zones are not visibl
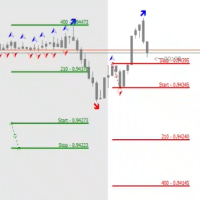
The STP Trade Manager is a utility tailored to the ST Patterns strategy by Vladimir Poltoratskiy ( www.stpatterns.com )
While specifically made for this strategy, it can also be used for other trade management. Especially when you have a need for quickly making trades and risk management.
It is a huge time saver and helps in quickly drawing the different ST Patterns corridors.
People familiar with the ST Patterns strategy will recognize and above all; appreciate the functions of this EA.
This

Cross Perfect Trend Signal is an indicator that generates trade arrows. It generates trade arrows with its own algorithm. These arrows give buying and selling signals. The indicator certainly does not repaint. Can be used in all pairs. Sends a signal to the user with the alert feature.
Trade rules Enter the signal when the buy signal arrives. In order to exit from the transaction, an opposite signal must be received. It is absolutely necessary to close the operation when an opposite signal is r

** All Symbols x All Time frames scan just by pressing scanner button ** *** Contact me to send you instruction and add you in "Divergence group" for sharing or seeing experiences with other users. Introduction MACD divergence is a main technique used to determine trend reversing when it’s time to sell or buy because prices are likely to drop or pick in the charts. The MACD Divergence indicator can help you locate the top and bottom of the market. This indicator finds Regular divergence for pul
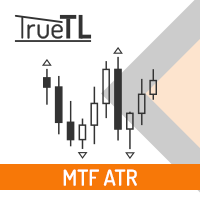
Highly configurable Average True Range (ATR) indicator.
Features: Highly customizable alert functions (at levels, crosses, direction changes via email, push, sound, popup) Multi timeframe ability Color customization (at levels, crosses, direction changes) Linear interpolation and histogram mode options Works on strategy tester in multi timeframe mode (at weekend without ticks also) Adjustable Levels Parameters:
ATR Timeframe: You can set the lower/higher timeframes for ATR. ATR Bar Shift: you
FREE

Trend easy простой трендовый индикатор в виде гистограмы. окно индикатора разделено на две части верхняя гистограма движение в бай, нижняя гистограма движениие в сел. Кроме гистограмы, сигнал индикатора дублируется на графике стрелками. В меню индикатора имеется количество баров в истории индикатора
значения периода для определения тренда разрешение рисования стрелок на графике код и цвета стрелок алерты и отступ стрелок
FREE
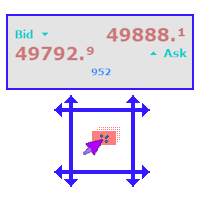
A simple and functional Current Price Panel, which shows magnified Bid, Ask and spread price and can be moved by using the mouse, to any location of the chart window. The functionality included are: Customize Current Price Panel Contents shown on Panel Width and Height, Row and Column gap. Background color, background transparency and border color. Font, its size and color. Move the panel to any location of chart window. Option to show current spread as pips or points. Highlight spread in diffe
FREE

Торговая стратегия. Советник применяет в торговле 4 трендово-сеточные стратегии с различными параметрами. Тем самым обеспечивается распределение рисков по торговым объемам в рынке. Авторская система определения тренда и учет волатильности торгуемой пары позволяют автоматически подстраиваться советнику под настроения рынка. Используется автоматическая фиксация убытка при достижении заданной в настройках просадки. Доступно широкое количество фильтров сигналов, которые позволяют минимизировать лож

EA has live track records with low drawdown: Live signal - Best Pairs
Live signal - All Pairs Evening Scalper Pro is the state-of-the-art mean-reversion trading system that operates during the American trading session. It's very different from most other scalping systems, since it uses a unique trading logic on cross pairs that have a strong mean-reverting tendency with high profit targets. EA enters the market with market orders from 19 to 23h, it does not open trades during rollover (0:00-1:

Sistema de trading automático adaptado a la volatilidad de la sesión de New York. Se basa en la ruptura de un rango de baja volatilidad con el objetivo de aprovechar diariamente el movimiento fuerte de la sesión americana. El sistema cuenta con parámetros de manejo de riesgo por porcentaje, parámetros de Stop Loss, Take Profit, Break Even, Tambien cuenta con parametro para cantidad de operaciones diarias y validación de entrada por cierre de vela o ruptura de precio.
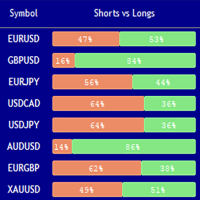
Market Sentiment Indicator Market Sentiment is a Trading Tool which allows you to see the positions of other currency traders. Until now, only institutional traders had access to such data which gave them a serious advantage over retail traders because of obvious reasons. With Market Sentiment, you too will finally know what other traders are doing which makes it easy to beat them on the forex battlefield.
Data comes from MyFxbook Community Outlook data feed and is based on up to 100 000 live

Benefits of the Surfboard indicator :
Entry signals without repainting If a signal appears and is confirmed, it does NOT disappear anymore, unlike indicators with repainting, which lead to major financial losses because they can show a signal and then remove it. perfect opening of trades The indicator algorithms allow you to find the Peak and floor position to enter a deal (buy or sell an asset), which increases the success rate for each and every trader using it. Surfboard works with any asset

Tra le tecniche alternative di trading più utilizzate dagli investitori, uno spazio interessante va dato alla strategia Ichimoku cloud che si basasulle nuvole (kumo).
Queste ultime sono il vero fulcro del sistema di trading Hichimoku Kinko Hyo. Molti erroneamente pensano che l’Ichimoku Kinko Hyo sia un semplice indicatore trend following, mentre invece è un vero e proprio sistema di trading completo .
Infatti grazie a UN SOLO grafico (sia pure molto complesso) ci dà una visione completa

Time frame: M1
Leverage : Higher the better
Spread: Lower the better
Account type : All types
(EA may enter hedge positions, if you want to disable this feature deactivate either Buy, or Sell from the setting)
Please please do not take unnecessary risks. (Trading is risky, and there are no guarantees for winning)
We wish you successful trading. (Trading is risky, and there are no guarantees for winning
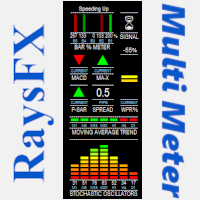
Questo indicatore è studiato per analizzare:
Lo Stochastic Oscillators , la Moving Averages , il MACD , il crossover MA , e per finire i Parabolic SAR. Il tutto viene racchiuso in un grafico che indicherà con frecce e spettri il momento ideale per aprire un trade. "La precisione dei segnali dipende sempre dai valori impostati, con i valori stock si ha un ottima affidabilità "
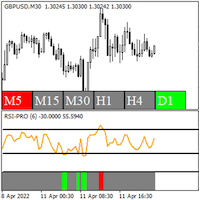
RSI Pro Indicator - Shows accurate RSI signals with modifiable price applications - Shows accurate RSI overbought and oversold levels - Shows multiple timeframe RSI overbought and oversold conditions on a single chart - 3 green bar sections in a row is an uptrend pattern - 3 red bar sections in a row is a downtrend pattern
The RSI Pro Indicator is a highly useful tool for determining overbought and oversold conditions and spotting RSI patterns, as well as spotting overbought and oversold condi

Esse indicador mede o 1º Canal de referencia e a 1º Zona Neutra * configurar o canal macro para verificar a frequencia MAIOR H1 H4 1D * configurar o canal micro para verificar a frequencia Menor 1M 5M 15M Como instalar o Indicador fimathe. E uma pré mentoria tem uma estrategia Secreta bonus nesse video . assitao o video para enteder as logicas que podemos iniciar com esse indicador.
https://www.youtube.com/playlist?list=PLxg54MWVGlJzzKuaEntFbyI4ospQi3Kw2
FREE
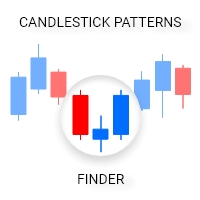
Candlestick Patterns Finder is a great tool to analyze candlestick charts. Indicator contains an advanced search algoritm and friendly graphic interface based on modified EasyAndFastGUI library. Has the ability to recognize 24 candlestick patterns. It was designed with the idea of simple and more efficient use of the indicator. It supports decision-making by automatically identifying candlestick patterns on the chart. The indicator has the ability to run in mode with and without a graphic

Simple Order Panel for calculating actual lot size with fixed risk amount. Working on both Market orders and pending orders. Notify Line Application when an order is opened or closed. Automatic set up Stoploss and Takeprofit with Risk Reward Ratio. Open one order with the risk(amount) per trade or separate the bet into three orders in one click. Involuntary modification Stopsloss to Breakeven when the Market takes the first or second-order profit. Filter button Buy or Sell when Moving Averate C

This is a fully FIFO compliant EA that performs money management as well as risk management. It is ideal for American residents who deal with FIFO limitations and low 1:50 leverage. The EA entry point is fully customizable and traders can conveniently modify the inputs to serve their own risk apatite. Here is the signal I created to track the progress of this EA live: https://www.mql5.com/en/signals/1491511 Since it uses martingale strategy, a gradual delay strategy is defined in the EA that clo

Les presento un robot útil que yo mismo llevo usando desde hace varios años. Es posible utilizarlo tanto en el modo semiautomático como en el totalmente automático. El programa contiene configuraciones flexibles de comercio para operar con las noticias del calendario económico. No se puede comprobar en el probador de estrategias. Únicamente el trabajo real. En la configuración del terminal, es necesario agregar a la lista de las URL permitidas una página WEB de noticias. Haga clic en Servicio >
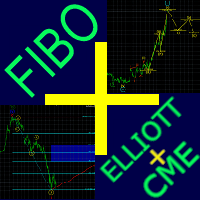
Fibo + Elliott + CME El Asesor Experto está diseñado como un asistente para el comercio manual. Sistema de comercio basado en ondas de Elliott y niveles de Fibonacci . Una solución simple y asequible. Visualización de marcación de ondas de Elliott (principal o alternativa) en el gráfico. Formación de niveles horizontales, líneas de soporte y resistencia, canal. Superposición de los niveles de Fibonacci en las ondas 1, 3, 5, A Visualización de datos CME (CME - Chicago Mercantile Exchange Chicag
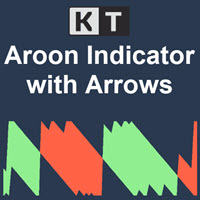
KT Aroon Oscillator es una versión modificada del oscilador Aroon original, desarrollado por Tushar Chande en 1995. Mide el intervalo de tiempo entre los máximos y mínimos recientes y utiliza esta información para calcular la dirección y fuerza de la tendencia del mercado. Funciona bajo la premisa de que, durante una tendencia alcista, el precio establecerá nuevos máximos consecutivos, y durante una tendencia bajista, se formarán nuevos mínimos. Señal de compra: Cuando la línea de Aroon Up cruz
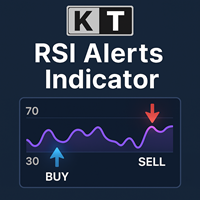
KT RSI Alerts es una implementación personalizada del oscilador RSI (Índice de Fuerza Relativa) que proporciona señales y alertas en base a cuatro eventos personalizados: Cuando el RSI entra en una zona de sobrecompra. Cuando el RSI sale de una zona de sobrecompra. Cuando el RSI entra en una zona de sobreventa. Cuando el RSI sale de una zona de sobreventa.
Características Una opción ideal para los traders que analizan el comportamiento del RSI dentro de zonas de sobrecompra y sobreventa. Indica

Master Scalping M1 es un indicador innovador que utiliza un algoritmo para determinar la tendencia de forma rápida y precisa. El indicador calcula el tiempo de apertura y cierre de posiciones, los algoritmos del indicador le permiten encontrar los momentos ideales para ingresar a una operación (comprar o vender un activo), lo que aumenta el éxito de las transacciones para la mayoría de los comerciantes. Beneficios del indicador: Fácil de usar, no sobrecarga el gráfico con información innecesari

Indicador de determinación TEMPRANA del comienzo de una nueva tendencia.
Además, el indicador determina la dirección global de la tendencia por el número de puntos:
si hay más puntos verdes (parámetro Cálculo de la tendencia global), la tendencia es alcista; si hay más puntos rojos, la tendencia es a la baja. El indicador no se vuelve a dibujar en la primera vela. El indicador se puede utilizar como un sistema de comercio independiente y como una adición a cualquier otro sistema de comercio.

Estrategia comercial lista. El indicador muestra puntos de inversión de precios en el gráfico. En lugares de una posible reversión de precios, el indicador dibuja una flecha. Si el indicador dibuja una flecha verde, entonces el precio subirá. Si el indicador dibuja una flecha roja, entonces el precio se moverá hacia abajo. El indicador también dibuja una línea promedio en el gráfico. Se muestra en amarillo. Con una probabilidad del 95%, si el indicador dibuja una flecha verde y el precio está p
Compruebe lo fácil y sencillo que es comprar un robot en la MetaTrader AppStore, la tienda de aplicaciones para la plataforma MetaTrader.
El Sistema de pago MQL5.community permite efectuar pagos con ayuda de PayPal, tarjeta bancaria y los sistemas de pago más populares. Además, le recomendamos encarecidamente testar el robot comercial antes de la compra, para así hacerse una idea más completa sobre él.
Está perdiendo oportunidades comerciales:
- Aplicaciones de trading gratuitas
- 8 000+ señales para copiar
- Noticias económicas para analizar los mercados financieros
Registro
Entrada
Si no tiene cuenta de usuario, regístrese
Para iniciar sesión y usar el sitio web MQL5.com es necesario permitir el uso de Сookies.
Por favor, active este ajuste en su navegador, de lo contrario, no podrá iniciar sesión.