Indicadores técnicos gratis para MetaTrader 4 - 7

This indicator uses the Zigzag indicator to identify swing highs and swing lows in the price chart. Once it has identified the swing highs and swing lows, it can use them to determine potential support and resistance levels. A support level is formed when the price drops and bounces back up from a swing low, indicating that there is buying pressure at that level. A resistance level is formed when the price rises and reverses downward from a swing high, suggesting selling pressure at that leve
FREE
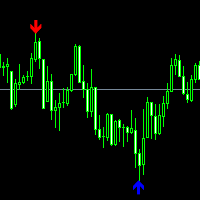
AMS Scalper
An excellent indicator for the entry point into the market; we use indicator signals only according to the trend. Special offer - https://www.mql5.com/en/users/bossik2810/news
Settings:
Range - 50 (range size for signal search.)
Maximum candles Back - 3 (after how many candles to set a signal)
P.S. For the signal to appear on the zero candle, set 0.
We recommend a trend indicator - Quantum Entry PRO
Still have questions? do you need help?, I'm always happy to help, wr
FREE

Based on famous and useful indicator - Super Trend, we add some features to make this Indicator much easier to use and powerful. Ease to identify the trend of any chart. Suitable for both Scalping & Swing Better to use in the trending market be careful in sideway market, it might provide some fake signals Setting: ATR Multiplier ATR Period ATR Max Bars (Max 10.000) Show UP/DOWN node Nodes size Show Pull-back signals Pull-back filter ratio Period of MA1 Mode of MA1 Period of MA2 Mode of MA2 A
FREE

GAP DETECTOR
FVG en trading se refiere a "Fair Value Gap", que en español se traduce como "brecha de valor justo". Es un concepto utilizado en el análisis técnico para identificar áreas en un gráfico de precios donde existe una discrepancia o brecha entre la oferta y la demanda. Estas brechas pueden ocurrir debido a movimientos rápidos en el precio, generalmente como resultado de noticias importantes o eventos económicos, y suelen ser llenadas posteriormente a medida que el mercado se estabili
FREE

Los niveles matemáticos de Murray se basan en las observaciones de Gann y su teoría de la cuadratura de los precios. Según Gann, el precio se mueve en 1/8 del rango. Estos 1/8 nos permiten obtener diferentes niveles de resistencia y soporte para un gráfico dado, los cuales tienen sus propias características. Después de una ruptura de los niveles -2 o +2 o cuando la volatilidad disminuye, se reconstruyen. Puede elegir qué período mostrar (historial actual o completo). Todas las líneas se trazan
FREE

Introduction RSI divergence is a main technique used to determine trend reversing when it’s time to sell or buy because prices are likely to drop or pick in the charts. The RSI Divergence indicator can help you locate the top and bottom of the market. This indicator finds Regular divergence for pullback the market and also finds hidden RSI Divergence to show continuing trend. This indicator shows divergence on the RSI that is a strong hint for an excellent entry point and finds immediately with
FREE

The Trade by levels indicator is designed to automatically determine the formation of a model for entering the market on the chart of the selected instrument.
Definitions: ⦁ BFl is the bar that formed the level. ⦁ BCL1 and BCL2 bars, confirming the level.
The graphical model: ⦁ levels high\low the bars BFL and BCL1 must match the accuracy to the point ⦁ there can be any number of bars between BFL and BCL1. ⦁ between BCL1 and BCL2 intermediate bars
FREE
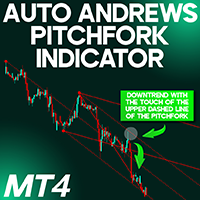
Auto Andrews Pitchfork indicator MT4 The Auto Andrews Pitchfork indicator MT4 is a technical analysis utility developed for MetaTrader 4 that identifies dynamic support and resistance zones based on price swings. This tool integrates well with MACD and determines three recent pivot points to draw a trio of parallel lines forming a pitchfork shape. The central median line of the pitchfork is a crucial level—acting as either a potential reversal points or confirming a trend continuation when breac
FREE

The Supertrend draws a line following the current trend.. Green Line under the candle means a likely bullish trend Red Line above the candle means a likely bearish trend
How to trade with SuperTrend indicator Buy when the Supertrend Green line is below the price, Sell when the Supertrend Red line is above the price. It is strongly suggested to use this indicator in a trending market.
Parameters Multiplier - the lower it is and the more sensitive is the line, meaning it will follow the price mo
FREE
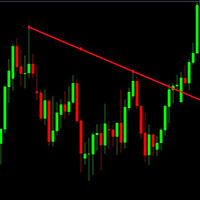
This is just a simple indicator that show Alert when the Current candle Close Above the Trendline. Previous candle do not affect the Alert. The indicator is tied to the Trendline so if the Trendline is accidentally deleted, the Alert will not work. The indicator will draw another Trendline if the current Trendline is deleted. Removing the indicator will removed the Trendline. There are 4 type of Alert to set: Popup Alert, Signal Alert, Push Notification, Comment.
FREE

Use the indicator only in retest zones The newly formed zone should be used for scalping only New zones are repainted or recalculated When supports and resistances are violated, they are deleted as they no longer function. Recommended on M30 and higher timeframes You will see the trading zones and identify the most profitable points to open positions. The indicator marks the supply and demand zones. With this show you will now make profitable trades that will set the trends. Shows all support a
FREE

The Candle Countdown Timer for MetaTrader 4 (also available for MT5) is a vital indicator designed to help you manage your trading time effectively. It keeps you updated about market open and close times by displaying the remaining time before the current candle closes and a new one forms. This powerful tool enables you to make well-informed trading decisions. Key Features: Asia Range: Comes with an option to extend the range. Broker Time, New York, London Time: Displays the current broker time
FREE
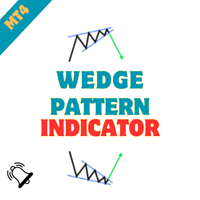
Wedge Chart Pattern Indicator - Unleash the Power of Wedge Patterns in Your Trading Embark on a journey of precision trading with the "Wedge Chart Pattern Indicator." Crafted for MetaTrader, this advanced tool is your ultimate companion for identifying wedge chart patterns, empowering you to make informed and strategic trading decisions. Whether you're a seasoned trader or just starting, this indicator simplifies the process of spotting wedge patterns, providing you with a valuable edge in the m
FREE

CISD and Price Gap Openings Indicator MT4 The CISD CSD + Price Gap Openings Indicator is designed to highlight price gaps while marking the CISD level, providing insights into potential market reversals. This MetaTrader 4 tool, based on ICT principles, utilizes arrow markers to assist traders in recognizing fresh price gaps and possible retracement zones. CISD – CSD + Price Gap Openings Indicator Specifications The following table outlines the features of the CISD – CSD + Price Gap Openings In
FREE

Los niveles de rango de pivote central se forman alrededor de un punto pivote central.
Estos niveles en relación con el pivote central se pueden utilizar para determinar numerosos comportamientos del mercado y posibles resultados.
La distancia desde el pivote central y el precio que forman los nuevos niveles en relación con los niveles del día anterior se pueden utilizar para determinar la dirección y la fuerza de la tendencia del día siguiente.
Los rangos de pivote central pueden actuar como
FREE

Judas Swing ICT Forex With Confirmation Indicator MT4 The Judas Swing ICT Forex with Confirmation Indicator is designed based on the ICT trading approach, leveraging market structure and liquidity analysis within the one-minute chart. This tool assists traders in recognizing key liquidity zones and significant trend reversals. This MetaTrader 4 indicator highlights areas where liquidity builds up and potential false breakouts, commonly referred to as Judas Swings . These zones are distinctly mar
FREE

This indicator uses Bollinger Bands lines to detect markets trend. It's a very useful tool for manual trading. Furthermore it is possible to use the indicator with ATR as a filter , as well as the option to pop up an alert when a reverse trend occurs. The readings are very simple to use and understand. Indicator works best on H1 timeframe.
You can to get source code from here .
Parameters BarsCount - How many bars used to show the line. BBperiod - Period of Bollinger Bands. BBdeviations - Devi
FREE

The ADX Indicator is known to be used to determine the trend direction. Not only that, but it also has deviation (+DI and -DI) that determine the direction of the trend as well. The role of the indicator is to spot the trend and its direction and generate signals accordingly.
Indicator Settings: - ADX period : default is 14 periods (it works best with the timeframe H1). - Signal Width : the size of signals arrows. - Signal Distance : the distance of the signal arrow from the candle. - Signal co
FREE
Этот индикатор является уникальным в своём роде, больше всего подходит для скальпинга на XAUUSD а также для торговли на более старших таймфреймах!
Уведомление сообщит самые важные точки входа, поэтому следует торговать по тренду. Идеален для скальпинга! The Best Trend Signals - трендовый мультивалютный индикатор, может использоваться на любых финансовых инструментах валюта, криптовалюта, металлы, акции, индексы. Рекомендуемый тайм-фрейм M15, M30, H1, H4, D1.
Как торговать с помощью индикатора
FREE

Trend Trading Indicator – Helping You Capture the Best Market Trends Advantages of the Indicator Precise Trend Identification :
The indicator provides clear signals to help you quickly understand market trend changes, making your trading decisions more efficient without the need for complex analysis. Flexible Parameter Selection :
Customize the calculation period, moving average method (e.g., SMA, EMA, LWMA), and applied price type (e.g., Close, Open, High). Whether you're a short-term trader or
FREE
This indicator finds the "Double Bottom" and "Double Top" technical analysis patterns, shows them on the chart of the currency pair and can signal if the pattern was formed recently. These patterns are reversal, often after the emergence of the trend turns back or a correction occurs. In order not to search for them yourself, it is enough to add the indicator to the chart, after that, you can change different timeframes in order to quickly find such figures on one of the timeframes. There are so
FREE
Color Levels - удобный инструмент для тех, кто использует технический анализ с использованием таких инструментов, как Трендовая линия и Прямоугольник. Имеется возможность настройки двух пустых прямоугольников, трех закрашенных и двух трендовых линий. Настройки индикатора крайне просты и делятся на пронумерованные блоки: С цифрами 1 и 2 вначале - настройки пустых прямоугольников (рамок); С цифрами 3, 4 и 5 - настройки закрашенных прямоугольников; С цифрами 6 и 7 - настройки трендовых линий. Объе
FREE
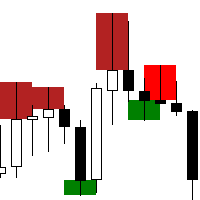
The "Rejection Block" MetaTrader 4 Indicator is a powerful tool designed to assist traders in identifying and visualizing rejection candlestick patterns, commonly referred to as rejection blocks. These patterns play a crucial role in market analysis as they often signify potential reversals or continuations in price movements. Key Features: Rejection Block Detection: The indicator meticulously scans price data to identify instances of rejection candlestick patterns. These patterns typically feat
FREE

Whether trading stocks, futures, options, or FX, traders confront the single most important question: to trade trend or range? This tool helps you identify ranges to either trade within, or, wait for breakouts signaling trend onset.
Free download for a limited time! We hope you enjoy, with our very best wishes during this pandemic!
The issue with identifying ranges is some ranges and patterns are easy to miss, and subject to human error when calculated on the fly. The Automatic Range Identifi
FREE

This is the free version of the Supply&Demand + Trendline + Trend tool. This version works only with EURCHF! You find the full version here: https://www.mql5.com/en/market/product/67274
PAAIOS stands for Price Action All In One Solution. And that is the purpose of the Indicator. It should give you a tool to improve your trading decisively because you get the crucial information at a glance. The indicator simplifies the search for strong signals. It shows trend lines, demand and su
FREE
Configuración del indicador SignalAlert El indicador SignalAlert está diseñado para rastrear señales de compra y venta de otro indicador y enviar alertas de sonido cuando aparecen señales. SignalAlert es útil para trabajar con indicadores como Binary Sixty Scalping , donde se requiere una rápida reacción a las señales. Configuración del indicador IndicatorName – El nombre del indicador desde el cual SignalAlert leerá las señales. Especifique el nombre exacto, por ejemplo, "Binary Sixty Scalping"
FREE

SX Price Action Patterns is a comprehensive indicator which shows various price action patterns on the chart for those who are interested in price action trading. These patterns are as follows: A Pin Bar is a candlestick price bar, which has a long wick on one side and a small body. It is a powerful signal of price reversal in a currency trading strategy. An Inside Bar is characterized by a bar or candle that is entirely ‘inside’ the range of the preceding one and represents the consolidation o
FREE

All traders should know the trend before making their decision when placing the buy or sell orders. The first step always starts with supply and demand , rising and falling channels , trend lines, engulfing candles etc. All the above contribute to what is called “Price Action” and that is the best and most reliable way in trading and catching the trend and making profits, without stress. The Investment Castle Trend Line Indicator will automatically draw the trend lines on the MT4 for you. An
FREE

Introducción del medidor de precisión:
Accuracy Meter es una herramienta poderosa para determinar el% de victorias de las estrategias, para mostrarle todos los puntos de entrada y salida de operaciones como ese probador de estrategia de meta trader, puede tener un probador de estrategia simple como indicador en el gráfico, adjuntarlo en diferentes pares y marcos de tiempo y descubrir el porcentaje de precisión de su estrategia, cambie el stop loss y el riesgo para recompensar el factor y vea có
FREE

O Touch VWAP é um indicador que permite calcular uma Média Ponderada por Volume (VWAP) apenas apertando a tecla 'w' no seu teclado e após clicando no candle do qual deseja realizar o calculo, clicando abaixo do candle é calculada a VWAP baseado na minima dos preços com o volume, clicando sobre o corpo do candle é calculado uma VWAP sobre o preço medio com o volume e clicando acima do candle é calculado uma VWAP baseado na máxima dos preços com o volume, voce tambem tem a opção de remover a VWAP
FREE

The Heikin Ashi indicator is our version of the Heikin Ashi chart. Unlike competitor products, this indicator offers extensive options for calculating Heikin Ashi candles. In addition, it can be displayed as a classic or smoothed version.
The indicator can calculate Heikin Ashi with moving average by four methods: SMA - Simple Moving Average SMMA - Smoothed Moving Average EMA - Exponential Moving Average LWMA - Linear Weighted Moving Average
Main features The indicator shows Heikin As
FREE

El indicador muestra en el gráfico los niveles de pivote clásicos calculados sobre la base del día anterior. Puede elegir a partir de qué hora calcular la fórmula. Operando a niveles de reversión en un piso. En un mercado de tendencias, utilícelos como objetivo. Combine con sus estrategias para operar con éxito. Los niveles se crean utilizando búferes y se muestran en todo el historial de cotizaciones disponible.
Parámetros de entrada.
Start Hour - a partir de qué hora comienza el día. 00 - p
FREE

Pattern Detector can detect the most common 1, 2 and 3 candlestick patterns and send notifications when detected. Demo version working on AUDNZD can be found https://www.mql5.com/en/market/product/29189
How does it work Add the indicator to the chart you want to analyze and select which patterns to detect, the indicator will draw the detected patterns. You can also be notified via alert, app and email when a new pattern is detected.
Parameters Indicator Name - Used to draw the graphical object
FREE

IceFX SpreadMonitor - indicador especial que registra el valor del spread. Muestra el spread actual, el mínimo/máximo y el medio. Estos valores quedan visibles incluso después del reinicio. Además, SpreadMonitor puede guardar los valores necesarios de spread en un archivo CSV para su posterior análisis.
FREE
The Supertrend Indicator is a popular technical analysis tool designed to assist traders in identifying market trends. The indicator combines the average true range (ATR) with a multiplier to calculate its value. This value is then added to or subtracted from the asset’s closing price to plot the supertrend line. The Supertrend Indicator can help identify trends, manage risk, and confirm market tendencies. The indicator is limited by its lagging nature, is not very flexible, and can send up fal
FREE

INFOPad es un panel de información que crea información sobre el par de divisas seleccionado en el terminal MetaTrader 4. Hay 5 funciones de este indicador: Muestra la información principal y principal sobre el símbolo seleccionado: Preguntar BID, Spread, Stop Level, Swap, valor Tick, precios de comisión; Muestra los objetivos futuros del objetivo SL y del objetivo TP (el número de puntos del límite de pérdida y la ganancia establecidos, el monto en dólares); Muestra la ganancia recibida por lo
FREE

The Keltner Channel is a volatility-based technical indicator composed of three separate lines. The middle line is an exponential moving average (EMA) of the price. Additional lines are placed above and below the EMA. The upper band is typically set two times the Average True Range (ATR) above the EMA, and the lower band is typically set two times the ATR below the EMA. The bands expand and contract as volatility (measured by ATR) expands and contracts. Since most price action will be encompasse
FREE
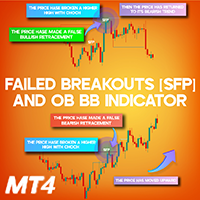
Failed Breakouts SFP and OB BB Indicator MT4
The Advanced Failed Breakout Indicator (SFP) is an essential tool in technical analysis, offering a comprehensive display of key market structures such as Break of Structure (BOS), Change of Character (CHoCH), and False Breakouts (SFP) directly on the chart. This indicator allows traders to detect deceptive breakouts and avoid potential market traps while maintaining a strategic approach to risk management. «Indicator Installation & User Guide»
MT4
FREE
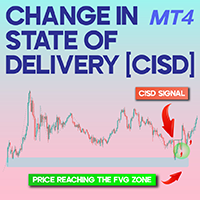
Change in State of Delivery CISD MT4 The Change in State of Delivery (CISD) Indicator is one of the ICT trading tools designed for MetaTrader 4 (MT4) . It assists traders in detecting CISD-level breaks and evaluating trading opportunities based on the signals it provides. Change in State of Delivery (CISD) Indicator Table Below are the key specifications of the CISD indicator: Category ICT - Smart Money - Signal & Forecast Platform MetaTrader 4 Skill Level Beginner Indicator Type Reversal - Brea
FREE

YOU CAN NOW DOWNLOAD FREE VERSIONS OF OUR PAID INDICATORS . IT'S OUR WAY OF GIVING BACK TO THE COMMUNITY ! >>> GO HERE TO DOWNLOAD
The Volatility Ratio was developed by Jack D. Schwager to identify trading range and signal potential breakouts. The volatility ratio is defined as the current day's true range divided by the true range over a certain number of days N (i.e. N periods). The following formula is used to calculate the volatility ratio: Volatility Ratio (VR) = Today's True Range/Tru
FREE
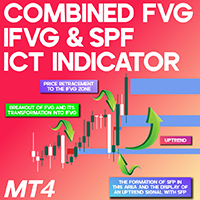
Combined FVG IFVG and SFP ICT Indicator MT4 The FVG-IFVG + SFP Indicator integrates three essential ICT trading elements: Fair Value Gap (FVG), Inverse Fair Value Gap (IFVG), and Swing Failure Pattern (SFP) . This tool is highly effective in identifying liquidity zones that are often manipulated by market makers. By detecting SFP formations within FVG and IFVG areas , the indicator helps traders recognize liquidity absorption points that may lead to potential price reversals. This feature enable
FREE

Idioteca FTU El indicador es para la plataforma MT4, se puede usar solo pero es mejor combinarlo con otros indicadores o estrategias. Combina varios indicadores como macd, adx para dibujar una flecha que sugiere entrada o cambio de tendencia. Vea un breve vídeo de introducción en youtube: https://youtu.be/lCRJ3mFNyOQ Características del indicador: Vender y comprar flechas Alerta visual y sonora. Continuación de la tendencia/señal temprana de cambio de tendencia Nuevas características: Limitar l
FREE

The TMA Centered Bands indicator for MT4 draws bands on the chart and reports the overall price trend, as well as gives arrows signals to buy and sell when the bar closes outside the channel.
Unlike many TMAs, our version uses the calculation part of the algorithm without redrawing, and also adds the ability to select a symbol. The bands are made up of moving averages, and each of them has an MA period. The name TMA comes from triangular moving averages, as the indicator draws triangular bands
FREE

El indicador R Scalper Arrows proporciona flechas de señal de compra y venta fáciles de leer para cualquier par de divisas.
Es adecuado para la predicción de tendencias a corto plazo: Una flecha hacia arriba indica que el par está en una tendencia alcista a corto plazo. Una flecha hacia abajo indica que el par está en una tendencia bajista a corto plazo. Para operaciones largas, coloque el stop loss debajo del pip.
Para operaciones cortas, coloque un stop loss por encima del pip.
pista Puede
FREE
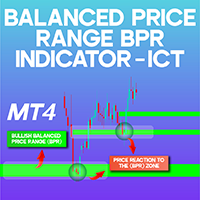
Balanced Price Range BPR Indicator ICT MT4 The Balanced Price Range (BPR) indicator is an ICT-based tool for MetaTrader 4 , designed to pinpoint the intersection of two Fair Value Gap (FVG) zones moving in opposite directions. By analyzing these gaps, the indicator highlights the shared region with colored boxes on the chart. This key area is often seen as a critical point for price movements, liquidity shifts, and possible trend reversals. Balanced Price Range Indicator Specifications Below i
FREE

Gold TL MTF - this is a fine stock technical indicator. The indicator algorithm analyzes the movement of the asset price and reflects trend lines along the fractals of a specific timeframe (TF).
Benefits of the indicator: The indicator produces signals with high accuracy. The confirmed signal of the indicator does not disappear and is not redrawn. You can trade on the MetaTrader 4 trading platform of any broker. You can trade any assets (currencies, metals, cryptocurrencies, stocks, indices e
FREE
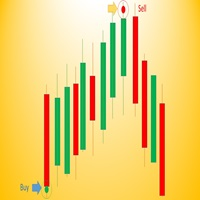
Wave Entry Alerts In Gold is a custom indicator developed by Azad Gorgis for MetaTrader 4. This indicator is designed to provide alerts based on ZigZag patterns, specifically tailored for trading on the Gold (XAU/USD) symbol.
Key Features: - Chart Window Indicator: The indicator is designed to be displayed on the main chart window. - Arrow Signals: The indicator generates arrow signals on the chart, indicating potential reversal points based on ZigZag patterns. - Customizable Parameters: Trade
FREE

Price Channels are also known as Donchian Channels being named after Richard Donchian. They use the highest and lowest price of a set number of periods to create an upper and lower channel or envelope around the price. The upper channel shows the high of the number of periods chosen. The lower channel shows the low of the number of periods chosen. For example, the screenshot shows the Price Channels using 320 periods. The upper channel in the screenshot shows the highest high of the previous 3
FREE

This indicator signals about crossing of the main and the signal lines of stochastic (lower stochastic) in the trend direction which is determined by two stochastics of higher time frames (higher stochastics). It is not a secret that stochastic generates accurate signals in a flat market and a lot of false signals in a protracted trend. A combination of two stochastics of higher time frames performs a good filtration of false signals and shows the main tendency. The indicator is recommended for
FREE
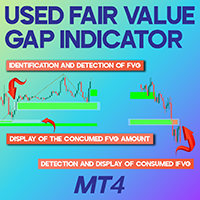
Used FVG (Used FVG-iFVG) indicator is a valuable tool designed for ICT and Smart Money traders, aiding them in detecting price imbalances and Fair Value Gaps (FVG) on the MetaTrader 4 (MT4) platform. This indicator highlights bullish FVG zones in green and bearish FVG areas in brown, allowing traders to pinpoint crucial market levels. As these zones are gradually filled, the rectangular markers shrink and eventually vanish from the chart, providing a clear representation of market shifts and s
FREE

. Simple Trading System Update !!! Follow this link to see our Strategy !!! (With auto trade indicator)
Description This is an indicator Free Version and showing only history signals, Not real time. Binary Deal Trading Indicator is an indicator on MT4 for Binary Option Trading. It forecasts the overbought / oversold level, Reversal and Fractal point. This indicator will help you to decide a reversal price on any time frame (Recommend M1, M5 and M15). The expiry time is 5-15 minutes after rec
FREE
Engulfing Pattern is a free indicator available for MT4/MT5 platforms, its work is to provide "alerts" when a "Bullish" or "Bearish engulfing pattern forms on the timeframe. This indicator comes with alerts options mentioned in the parameter section below. Join our MQL5 group , where we share important news and updates. You are also welcome to join our private channel as well, contact me for the private link. Engulfing Pattern Indicator MT5 Other Products Try our Martini EA with 2 years of liv
FREE

Alan Hull's moving average, more sensitive to the current price activity than the normal MA. Reacts to the trend changes faster, displays the price movement more clearly. Color version of the indicator. Improvement of the original version of the indicator by Sergey <wizardserg@mail.ru>. Suitable for all timeframes.
Parameters Period - smoothing period, recommended values are from 9 to 64. The greater the period, the smoother the indicator. Method - smoothing method, suitable values are 0, 1, 2
FREE

With this easy to set up indicator you can display and set alerts for the following candlestick formations: Bull Breakout, Bear Breakout, Hammer, Pin, Bullish Engulfing, Bearish Engulfing. I'd appreciate if you would review the indicator
Input parameters: ShortArrowColor: The color of the Arrows, displaying a Bearish candle formation LongArrowColor: The color of the Arrows displaying a Bullish candle formation BullishEngulfing: Disabled/Enabled/EnabledwithAlert BearishEngulfing: Disabled/Enab
FREE
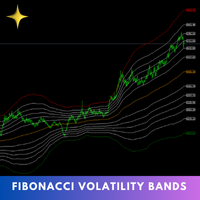
The Fibonacci Volatility Bands indicator is a refined tool designed to enhance your market analysis by integrating Fibonacci retracements with the Bollinger Bands concept. This indicator visually highlights potential areas of support and resistance, providing traders with a clearer understanding of price fluctuations and volatility. MT5 Version - https://www.mql5.com/en/market/product/126422/ The core of the Fibonacci Volatility Bands is built around a Volume Weighted Moving Average (VWMA) that
FREE
This indicator lets you easily mark the daily open levels on a chart with several possibilities of customization. For many trading strategies, the daily open level is an important level to base trading decisions on. That is why I chose to create this indicator that is designed to assist you with trading these strategies, as well as further optimizing them and getting a general understanding of the markets movements. With this tools help, you can easily take a look at the previous price action ar
FREE
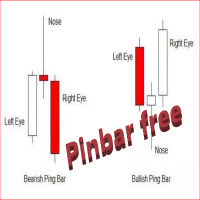
The Free Pin Bar MT4 indicator identifies Pin Bars It will even give you sound or email alerts if want them. If you download it and like it please leave a review! It would be wonderful
Pin Bars are purely based on price action as reflected by the candle formations created by Forex price movements. input Parameters are maximum allowed body/length ratio for the Nose bar. Nose body should be position in top (bottom for bearish pattern) part of the Nose bar. tells the indicator that the Left Ey
FREE

Este asesor experto no realiza ninguna operación, pero escanea todos los símbolos en su reloj de mercado y escanea cada acción una por una en diferentes marcos de tiempo y al final le muestra qué símbolo en qué marco de tiempo tiene una poderosa vela envolvente.
Además, puede definir un período MA y un límite RSI alto y bajo, y le muestra qué símbolos en qué período de tiempo cruzarán el promedio móvil ajustado, y qué símbolo en qué período de tiempo cruzarán el límite alto o bajo del RSI.
FREE
This program will make analysing multiple timeframes more convenient.
It will help to sync all charts in a different Timeframe sync charts to show same symbol, same specific time period and sync drawing objects Show on all charts at the same time
How to use it >> https://youtu.be/NEHUW7v1h1c In this edition there are only 6 object types that can be synced all chart. Drawing Object Type Support : Vertical/Horizontal Line, Trendline, Rectangle, Arrow, Fibo-Retracement
Additional Feature: T
FREE

Pullback Viewer is designed to show valid pullback points in a bearish or bullish trend.
What is considered a valid pullback?
A valid pullback needs to have a body close outside the previous candle high (in a bearish trend ) or previous candle low (in a bullish trend ). If the candle wicks out the previous candle, it's not a valid pullback.
Pullback must liquidate the previous candle with a clean candle body close.
When is this indicator useful?
It's useful to understand and
FREE

This indicator show candle time remaining. The remaining time of the candle is calculated every 200 milliseconds. 1. You can set x (horizontal), y (vertical) of text. 2. You can set font, color, size of text. 3. You can remove the text without having to remove the indicator from the chart. The remaining time of the candle depends on the timeframe of the chart with the indicator.
FREE

El indicador muestra niveles redondos en el gráfico. También se denominan niveles psicológicos , bancarios o de jugadores importantes. En estos niveles, hay una verdadera pelea entre alcistas y bajistas, la acumulación de muchos pedidos, lo que conduce a una mayor volatilidad. El indicador se ajusta automáticamente a cualquier instrumento y período de tiempo. Cuando el nivel 80 se rompe y luego se prueba, compramos . Cuando el nivel 20 se rompe y luego se prueba, vendemos
FREE

The three white soldiers and the three black crows candlestick patterns are reversal patterns that predict a change in the direction of a trend. The pattern consists of three consecutive long-bodied candlesticks that open within the previous candle's real body and a close that exceeds the previous candle's. It's important to note that both formations are only valid when they appear after a strong uptrend or a downtrend, while their efficiency decreases in choppy markets.
Inputs AlertOn - en
FREE

This Weis Wave Volume indicator is a tool to help traders identify the current price trend. Understanding volume can provide insight into a market's behavior to help you determine its overall health. The most important rule is this: volume precedes price. Typically, before a market price moves, volume comes into play. It has 2 main colors histogram which are green and red. – Green indicates an upward wave. The more the price increases, the bigger the green volume gets. – The red color shows a d
FREE
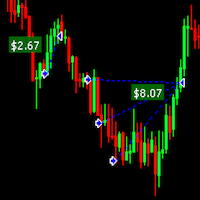
Draw Profit indicator can efficiently help those traders who want to see on the chart all closed positions output: profit or loss. If set DrawProfit on your chart managed by an Expert Advisor (EA) you will see clearly it’s performance by its profits & losses. My other products: https://www.mql5.com/en/users/hoangvudb/seller
Input parameters: Show Profit Labels : show profit of orders with a label (true/false). Profit Mode : available options: Show in currency. Show in pips. Show in currency a
FREE

This indicator calculates and draws lines over the chart. There are two types of trends: Trend A: the line is drawn using local lows for uptrends and local highs for downtrends Trend B: the line is drawn using local highs for uptrends and local lows for downtrends There are a few conditions, which have to be fulfilled and can be changed by the parameters (see also picture 4): MinBarAge : the count of bars to the last base point of a line is called BarAge and has to be greater than the parameter
FREE

Principles of construction of the indicator. The Absolute Bands (AB) indicator is reminiscent of the Bollinger Bands indicator with its appearance and functions, but only more effective for trading due to the significantly smaller number of false signals issued to them. This effectiveness of the Absolute Bands indicator is due to its robust nature. In the Bollinger Bands indicator, on both sides of the moving average - Ma, there are lines spaced from Ma by the standa
FREE

The Pivot Point indicator automatically calculates and displays the pivot point line and support and resistance levels. Pivot can be calculated according to the Classic, Floor, Fibonacci, Woodie, Camarilla or DeMark formula. It is also possible to select the period for calculating the indicator. A trader can choose from daily, weekly, monthly, or user-defined periods.
Types of pivots Classic Floor Fibonacci Woodie Camarilla DeMark
Main features The indicator shows the current and historic
FREE
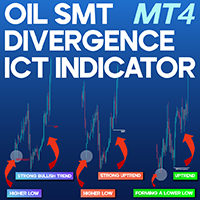
SMT Divergence ICT Oil Indicator MT4 The SMT Divergence Oil Indicator is a specialized MetaTrader 4 tool designed to identify divergence patterns between correlated assets. It assists traders in detecting price discrepancies across Crude Oil (XTIUSD), Brent Crude (XBRUSD), and the USD/CAD pair , offering insights into possible trend shifts or reversals. This indicator visually marks divergence areas on the chart, making it easier to recognize opportunities for buying or selling based on institut
FREE
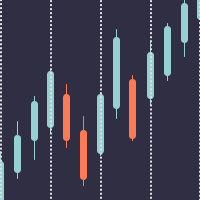
Better Period Separators For MetaTrader 4 The built-in period separators feature doesn’t allow users to specify the time period, so you can use this indicator to create more customizable period separators. On intraday charts, you could place period separators at a specific time, you could also place extra period separators at a specific time on Monday to mark the start of a week. On higher timeframe charts, this indicator works the same as the built-in period separators, On the daily chart, peri
FREE
El Mercado MetaTrader es la única tienda donde se puede descargar la versión demo de un robot comercial y ponerla a prueba, e incluso optimizarla según los datos históricos.
Lea la descripción y los comentarios de los compradores sobre el producto que le interese, descárguelo directamente al terminal y compruebe cómo testar el robot comercial antes de la compra. Sólo con nosotros podrá hacerse una idea sobre el programa, sin pagar por ello.
Está perdiendo oportunidades comerciales:
- Aplicaciones de trading gratuitas
- 8 000+ señales para copiar
- Noticias económicas para analizar los mercados financieros
Registro
Entrada
Si no tiene cuenta de usuario, regístrese
Para iniciar sesión y usar el sitio web MQL5.com es necesario permitir el uso de Сookies.
Por favor, active este ajuste en su navegador, de lo contrario, no podrá iniciar sesión.