Indicadores técnicos gratis para MetaTrader 4 - 2

Si te gusta este proyecto, deja una revisión de 5 estrellas. Seguir en instagram: borelatech Este indicador dibuja los precios abiertos, altos, bajos y finales para los
especificados
período y se puede ajustar para una zona horaria específica. Estos son niveles importantes considerados por muchos institucionales y
profesionales
comerciantes y puede ser útil para que usted sepa los lugares donde podrían ser
más
activo. Los períodos disponibles son: Día previo. Semana anterior. Mes anteri
FREE

Este es un producto gratuito que puede utilizar para sus necesidades.
¡También aprecio mucho sus comentarios positivos! ¡Muchas gracias!
// Hay más asesores expertos e indicadores disponibles aquí: https://www.mql5.com/en/users/def1380/seller
Indicador de Forex: Velas Heiken Ashi para MT4. Sin repintado.
Heiken_Ashi_Candles tiene una gran combinación con el indicador Trend Line MA como se muestra en la imagen. El indicador Heiken_Ashi_Candles es un indicador auxiliar muy útil para hacer
FREE
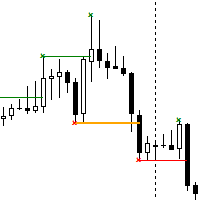
The Break of Structure (BoS) and Change of Character indicator is a powerful tool designed to identify significant turning points in price movements on financial charts within the MetaTrader 4 platform. By analyzing price action, this indicator highlights instances where the market shifts from a trend to a potential reversal or consolidation phase. Utilizing sophisticated algorithms, the indicator identifies breakouts where the structure of price movement undergoes notable changes. These breakou
FREE

YOU CAN NOW DOWNLOAD FREE VERSIONS OF OUR PAID INDICATORS . IT'S OUR WAY OF GIVING BACK TO THE COMMUNITY ! >>> GO HERE TO DOWNLOAD
This system is an Heiken Ashi system based on RSI calculations . The system is a free open source script originally published on TradingView by JayRogers . We have taken the liberty of converting the pine script to Mq4 indicator . We have also added a new feature which enables to filter signals and reduces noise on the arrow signals.
Background
HEIKEN ASHI
FREE
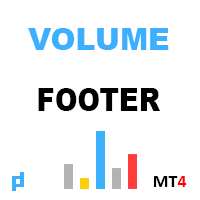
El indicador muestra el volumen vertical. En la configuración, hay 2 coeficientes para determinar alto y extremo, y 1 para determinar bajo volumen. Un algoritmo similar también se usa en el indicador UPD1 Volume Pixel . Cuando se detecta el volumen especificado, el histograma se colorea en el color correspondiente. El ancho del histograma se selecciona automáticamente, dependiendo de la escala. Como regla general, el precio responde al volumen máximo y mínimo. Pero es necesario usar señales de
FREE

Super Trend Pro Its simple. as you see in product picture you can find out how it work. We Use Several MA and use Statistics and Probability inside the code to draw nice, great and pure Trend Detection. Do you like it? Yes me too Here, Super trend pro with 100% non-repainting indicator
Input Parameter is clear and simple.
Inputs Period 1 --------------------------->>>> Use for mathematical calculating
Period 2 --------------------------->>>> MA Period
Indicator Type ------------------->>>>
FREE

El indicador VR Donchian es una versión mejorada del canal Donchian. Las mejoras afectaron a casi todas las funciones del canal, pero se conservaron el algoritmo operativo principal y la construcción del canal. Se ha agregado un cambio en el color de los niveles al indicador de bola dependiendo de la tendencia actual; esto muestra claramente al operador un cambio en la tendencia o un nivel plano. Se ha añadido la posibilidad de informar al operador sobre la ruptura de uno de los dos niveles de c
FREE
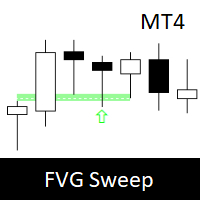
Fair Value Gap Sweep is a unique and powerful indicator that draws fair value gaps on your chart and alerts you when a gap has been swept by the price. A fair value gap is a price gap that occurs when the market opens at a different level than the previous close, creating an imbalance between buyers and sellers. A gap sweep is when the price moves back to fill the gap, indicating a change in market sentiment and a potential trading opportunity.
Fair Value Gap Sweep indicator has the following
FREE
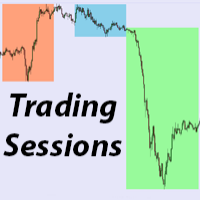
Trading Sessions 3
Description
Display the intra-day trading sessions from ASIA , LONDON and NEW YORK ASIA Session : Most volatile currencies AUD , NZD , JPY LONDON Session : Most volatile currencies GBP , EUR NEW YORK Session : Most volatile currency USD Inputs
Modifiable trading hours as HH:MM format
Custom days to display sessions
Note : GMT+3 = Helsinki Timezone
FREE
Indicador de tiempo hasta el final de la vela. Muestra el tiempo hasta el final de la vela, así como el tiempo del servidor. El texto puede mostrar la tendencia o la dirección de la vela, las notificaciones de sonido están integradas Peculiaridades:
Muestra el tiempo hasta el final de la vela actual, así como otros marcos de tiempo que se pueden ajustar o desactivar si es necesario AW Candle Time puede seleccionar la dirección de la vela o tendencia actual con el indicador AW Super Trend La es
FREE

It identifies the pivot, support, and resistance price levels of the selected timeframe and then draws lines onto the chart. FEATURES: Option to specify the Timeframe Period in the PivotSR calculation. Option to display the PivotSR of the last candle, of every candle, or of the current candle. Options for displaying labels, line thickness, and line color. PivotSR can be interpreted as reversal levels or past price reactions that can be used as the basis for current price analysis. Some traders b
FREE
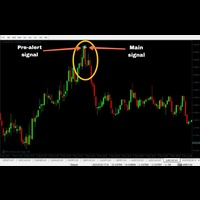
100% non-repaint MT4 indicator with advance pre alert
Recommended candle timeframe M15
Trade expiry 15 minutes
Call buffer 0
Put buffer 1
Intrabar
Pros Neural Network based Advance price action algorithms Advance trend filtering algorithms Advance consolidation filtering algo
Pre-alert (get ready) signals
Non-delay indications
Auto-trading supported
100% Non repaint
100% No lag
No recalculating
Lifetime license
Cons Very few signals
Instructions to use
1 Do not ente
FREE
Para facilitar a los operadores la obtención de datos sobre el desempeño de los mercados y la mejor formulación de estrategias comerciales, hemos desarrollado un indicador de sesión comercial. Los horarios de apertura de varias bolsas afectan las operaciones, ya que afectan la actividad del mercado y los volúmenes de operaciones. Estos factores determinan la volatilidad y las oportunidades comerciales de los diferentes instrumentos. El indicador AW Trading Sessions Time muestra los horarios de
FREE
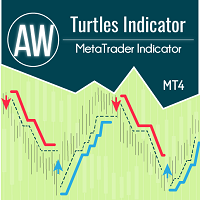
El indicador funciona según el sistema Turtle y clásicamente asume un intervalo de tiempo de 20 y 55 velas. Se monitorea una tendencia durante un intervalo de tiempo determinado. La entrada se realiza en el momento de la ruptura del nivel de soporte o resistencia. La señal de salida es una ruptura del precio en la dirección opuesta a la tendencia del mismo intervalo de tiempo. Ventajas:
Instrumentos: pares de divisas, acciones, materias primas, índices, criptomonedas Plazo: Clásicamente D1, t
FREE

We offer indicators that will meet your needs more.
>> MT Trend Pro <<
>> MT Magical <<
>> MT Merit TLC <<
MT Supply Demand : It is an indicator created to find supply and demand, which will be important support and resistance levels for the price. It can be set pending orders or used in conjunction with other indicators to send buy or sell signals.
PLATFROM: MT4 Only
TRADE: Forex
TIME FRAME: All Time Frame
SYMBOL PAIR: All Symbol
SETTI
FREE

El indicador muestra ganancias (pérdidas) en el símbolo actual. Puede arrastrar y soltar libremente la línea para mostrar la ganancia o pérdida actual.
Parámetros Calculation in money or in points — calcula la ganancia/pérdida en puntos o en dinero. Add pending orders to calculate — tenga en cuenta las órdenes pendientes en los cálculos. Magic Number (0 - all orders on symbol) — número mágico, si es necesario evaluar órdenes específicas. Offset for first drawing (points from the average p
FREE
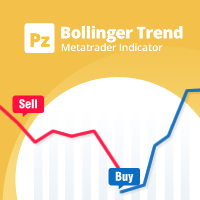
A personal implementation of the famous Bollinger bands indicator as a trend following mechanism, which uses a moving average and the standard deviation to define what a trend is and when it changes. Bollinger bands are usually used as an oversold/overbought indicator only, but in my opinion, the trading approach is more complete using the trend variant as an exit strategy. [ Installation Guide | Update Guide | Troubleshooting | FAQ | All Products ] Easy to trade Customizable colors and sizes It
FREE
Esta VWAP es una VWAP simple, pero hemos incorporado notificaciones que informan cuando el precio alcanza o cruza la línea de la VWAP. Este indicador es un indicador de VWAP tradicional para MetaTrader 4 (MT4). Los parámetros predeterminados son los de la VWAP normal, pero tienes la capacidad de modificar el cálculo de la VWAP y, lo mejor: Cuando el precio toque o cruce la VWAP, lo sabrás a través de alertas, notificaciones en el móvil, correo electrónico o eventos sonoros. indicador de VWAPs an
FREE
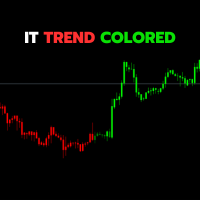
The IT Trend Colored indicator is a powerful tool designed by IT Trading (InfiniteTrades Software Corp) to assist traders in visually and effectively identifying market trends. This version is a custom indicator for the MetaTrader 4 trading platform.
Key Features:
• Trend Identification: The indicator uses a combination of simple moving averages (SMA) to determine the direction of the market trend.
• Intuitive Coloring: Upward trends are represented by bold green histograms, downward tren
FREE

FOLLOW THE LINE GET THE FULL VERSION HERE: https://www.mql5.com/en/market/product/36024 This indicator obeys the popular maxim that: "THE TREND IS YOUR FRIEND" It paints a GREEN line for BUY and also paints a RED line for SELL. It gives alarms and alerts of all kinds. IT DOES NOT REPAINT and can be used for all currency pairs and timeframes. Yes, as easy and simple as that. Even a newbie can use it to make great and reliable trades. NB: For best results, get my other premium indicators for more
FREE
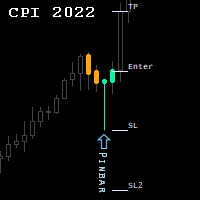
Candlestick Patterns Indicator.
NEW! FREE Candlestick Patterns Expert Advisor > https://www.mql5.com/en/market/product/105634?source=Site +Profile
The Indicator draws colored candlestick patterns, their description and future levels of Stop Loss / Take Profit. Combined with other market analysis, can greatly improve trading results. Indicator can be highly customized by the user including change of colors, fonts, levels, candle sizes etc...
developed, tested and optimized on " VantageM
FREE

FREE Heiken Ashi Smoothed indicator is fully adjustable, easy to use and comes with possibility to access the indicator via iCustom function so you can use it in your own trading software. Indicator can also pop up alerts when signal changes or send push notifications. For Metatrader 5 version click here: https://www.mql5.com/en/market/product/70825 For detailed information click: >>HERE<< Features
Easy to use Accessible via iCustom Fully adjustable Alerts and Push notifications Possi
FREE
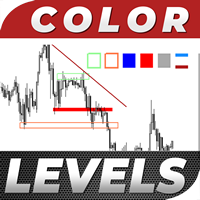
Color Levels is a convenient tool for traders using a Trendline and a Rectangle in their technical analysis. It allows setting two empty rectangles, three filled ones, and two tredlines. The indicator parameters are very simple and divided into numbered blocks: The ones beginning with 1 and 2 - empty rectangle (frame) parameters; 3, 4, and 5 - filled rectangle parameters; 6 and 7 - trendline parameters. Simply click a desired object and it will appear in the upper left corner. Main Adjustable Pa
FREE

It works based on the Stochastic Indicator algorithm. Very useful for trading with high-low or OverSold/Overbought swing strategies. StochSignal will show a buy arrow if the two lines have crossed in the OverSold area and sell arrows if the two lines have crossed in the Overbought area. You can put the Stochastic Indicator on the chart with the same parameters as this StochSignal Indicator to understand more clearly how it works. This indicator is equipped with the following parameters: Inputs d
FREE

Info Plus is a simple tool that displays the current status on an asset class. The information displayed by Info Plus includes: Bid Price The high and low of the day. Candle time left. Current spread. Selected timeframe. Asset class selected (Symbol). Pip value. Open Positions. Total pips booked. Pips per trade. Session times (they may not be accurate and are subject to changes). Date and time.
How it Works When loaded onto any chart, Info Plus automatically gets the following parameters: Bid
FREE

US30 Revolt a Technical indicator that is 100% non-repaint and appears on the current candlestick works on all timeframes (recommended M15,M30,H1) The indicator is made for US30 but it can be used on other pairs as well When a blue arrow appears look for buying opportunities When a orange arrow appears look for selling opportunities Please watch the YouTube video on how to properly set up and use the indicator
FREE

Calculation of Lot Size for many traders is a big challenge.
A case that is very important in money management. What many traders ignore.
Choosing an appropriate Lot Size in trades can improve results and it will ultimately lead to success.
This indicator calculates the authorized Lot Size for your trades.
The indicator uses the following values to get the appropriate Lot Size for positioning:
The distance of Stop Loss.
The Pip Value.
The amount of Risk Allowed For Each Trade.
T
FREE

Comercio dinámico:
1.pp pivote
2. r1 r2 r3, s1 s2 s3 Necessary for traders: tools and indicators Waves automatically calculate indicators, channel trend trading Perfect trend-wave automatic calculation channel calculation , MT4 Perfect trend-wave automatic calculation channel calculation , MT5 Local Trading copying Easy And Fast Copy , MT4 Easy And Fast Copy , MT5 Local Trading copying For DEMO Easy And Fast Copy , MT4 DEMO Easy And Fast Copy , MT5 DEMO
Recomendamos encarecidamente indica
FREE
PLEASE NOTE You can customize the settings of K_period value, the oversold and the overbought value is customizable. You can change it as per your requirement. The accuracy will change as per your settings.
100% Non repaint indicator
Pre-alert (get ready) signals
Non-delay indications
24/7 signals
100% No lag
No recalculating The arrows wont repaint even if the signal fails, or you refresh or restart the mt4 Indicator is based on simple crossover strategy of main line and signal line
FREE
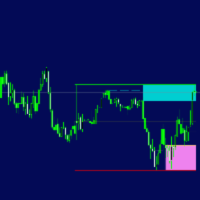
1. Updated usage instructions in blog below: Smart Market Structure Trading System and Automatic Scanner - Trading Systems - 13 October 2023 - Traders' Blogs (mql5.com) https://www.mql5.com/en/blogs/post/754495 2.1 YouTube video link for updated Panel control and new features: https://youtu.be/LM699E7JS3E 2.2 YouTube video link for feature introduction: https://youtu.be/tMU04wo0bc8 3. Smart Money Concepts, Support and Resistance, Buy Side Liquidity, Sell Side Liquidity, Monthly Highs/Lows, W
FREE

The Market Structures MT4 indicator finds and shows the Break Of Structures (BoS) pattern on the chart. The pattern is an important part of the Smart Money Concepts (SMC) system.
The appearance of a pattern means that the price breaks the last peak of an uptrend, or the last bottom of a downtrend. This indicates a change in the existing trend structure and the beginning of a new movement.
BOS is a technical analysis tool used to identify trend reversals.
The set of input parameters is simple
FREE
READ THE DESCRIPTION ITS IMPORTANT - ONLY TAKES 2 MINUTES - THIS IS A TOOL NOT A TRADING STRATEGY
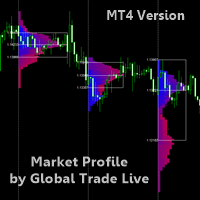
Market Profile By Global Trade Live A Market Profile is a graphical representation that combines price and time information in the form of a distribution. A Market Profile is used to determine elapsed time, number of ticks and volumes traded at specific prices, or over a price interval, over a given period. A Market Profile also makes it possible to identify prices accepted or rejected by the ma
FREE

MACD Intraday Trend es un indicador desarrollado a través de una adaptación del MACD original creado por Gerald Appel en la década de 1960.
A lo largo de años de negociación, se observó que al cambiar los parámetros del MACD con proporciones de Fibonacci logramos una mejor presentación de la continuidad de los movimientos de la tendencia, haciendo que sea posible detectar de manera más eficiente el inicio y el final de una tendencia de precios.
Debido a su eficiencia en la detección de tend
FREE
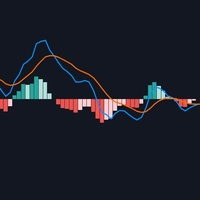
Moving average convergence divergence (MACD) is a trend-following momentum indicator that shows the relationship between two moving averages of a security’s price. The result of that calculation is the MACD line. A nine-day EMA of the MACD called the "signal line," is then plotted on top of the MACD line, which can function as a trigger for buy and sell signals. Traders may buy the security when the MACD crosses above its signal line and sell—or short—the security when the MACD crosse
FREE

El indicador Identificar tendencia (" Identify Trend "), que utiliza métodos de filtrado bastante simples pero robustos (según la mediana móvil - el algoritmo XM ) y algoritmos más complejos desarrollados por el autor (XC, XF, XS, cuatro tipos de promedios móviles no retardados SMAWL, EMAWL, SSMAWL, LWMAWL ) , permite establecer el comienzo de un verdadero movimiento de tendencia con mucha precisión y, lo que es más importante, con un pequeño retraso, y identificar el plana. Es
FREE

RSI divergence indicator is a multi-timeframe and multi-symbol indicator that help us find divergences between price chart and RSI indicator. Always use the divergence indicators with other technical assets like support resistance zones, candlestick patterns and price action to have a higher possibility to find trend reversals. This indicator will identify the peaks and troughs of both price and the RSI indicator. You can adjust the parameters to adjust the strength and weakness of these peaks a
FREE
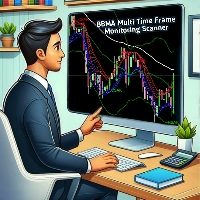
I created BBMA Multi Time Frame Trend Monitoring to make it easier for friends to monitor trend movements on one monitor screen without having to go back and forth between time frames. Prioritize waiting for the complete BBMA Full Setup to occur before we follow and focus on the goal of the trend flow For Entry, continue to use Oma Aly's BBMA SOP Don't forget to prioritize R:R when entering
BBMA Multi Time Frame Tren Monitoring ini saya buat untuk mempermudah kawan kawan untuk memantau perg
FREE

Double top and bottom indicator is a pattern scanning indicator which scans the tops and bottoms using zig zag pattern. When it find price bouncing back from the same point twice after a long trend then it generate arrow signals whenever the last resistance points is broken for double bottom and last support price broken for double top. Unlike other top bottom scanner it does not give only 1 signal. it alerts user when ever the last support /resistance is broker from double top/bottom pattern un
FREE

The Omega Trend Indicator is an advanced tool that has been specifically designed to detect market trends early, and follow them efficiently. The indicator draws two lines. The main (thicker) Trend Line represents the presumed lower or upper volatility limits of the current market trend. A break in the main Trend Line indicates a potential reversal or shift in the movement of the trend. The Trend Line also indicates the best point to place a stop loss order. In Omega Trend Indicator, the Trend L
FREE

Este indicador le dibujará los siguientes niveles:
Línea abierta diaria: abajo está el mercado bajista, arriba está el mercado alcista. Rango diario promedio alto y bajo Altos y bajos del mercado asiático Los altos y bajos de ayer Estos niveles son fuertes niveles de soporte y resistencia a los que todos deben prestar atención.
¡Si no aprovechaste el tiempo para empezar! ¡Debes prestar atención cuando el precio se acerque a estos niveles!
¡Disfrute del comercio de forma más fácil!
FREE

A simple indicator that automatically highlights all FVGs (Fair Value Gaps) formed on the chart, as well as FVGs on history. It is possible to select colors for FVGs of different directions (long or short), select the time interval, select the color of middle point and you can also choose whether to delete filled FVGs or leave them on the chart (the option is beneficial for backtesting). The indicator can be very useful for those, who trade according to the concept of smart money, ICT, or simply
FREE

El indicador muestra el volumen horizontal máximo en el marco de tiempo seleccionado. Basado en el indicador UPD1 Volume Box . Las líneas se pueden conectar o dividir. En la configuración, puede activar la alerta de toque inteligente. Este indicador será útil para aquellos que negocian utilizando el perfil del mercado y el concepto de Smart Money.
Parámetros de entrada.
Ajustes básicos. Bars Count - especifica el número de barras en las que se dibujará el TF POC. Data Source - el marco de t
FREE
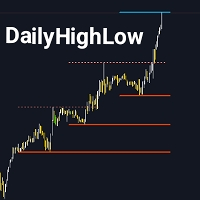
El indicador DailyHighLow está diseñado específicamente para la plataforma MetaTrader 4 (MT4) y tiene como objetivo ayudar a los traders a seguir las fluctuaciones diarias de precios. Este indicador traza automáticamente líneas de tendencia basadas en los precios más altos y más bajos de un período personalizado, proporcionando una asistencia visual clara para los traders que necesitan información precisa del mercado. Características Principales: Personalización de Líneas de Tendencia: Ajusta el
FREE
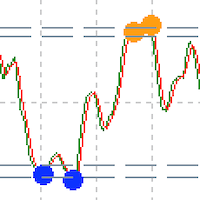
Custom Relative Strength Indicator with multiple timeframe selection About RSI The relative strength index is a technical indicator used in the analysis of financial markets. It is intended to chart the current and historical strength or weakness of a stock or market based on the closing prices of a recent trading period. Features
Indicator gives alert when reached oversold or overbought levels Gives dot indication while reaching levels. Can set indicator bar alert intervals for alerts Can choo
FREE
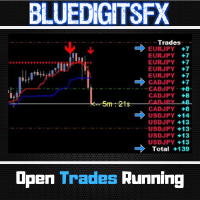
MT5 Version Available Here: https://www.mql5.com/en/market/product/62376
Telegram Channel & Group : https://t.me/bluedigitsfx
V.I.P Group Access: Send Payment Proof of any of our Paid Products to our Inbox
Recommended Broker: https://eb4.app/BDFXOsprey * The Most Sought After Pip Counter for Metatrader ! Features
Will show Currency Symbol in BLUE for Buy positions. Will show Currency Symbol in RED for Sell positions. Will Show pips in BLUE Color for Positive Pips Will Show pips in
FREE

The indicator analyzes the volume scale and splits it into two components - seller volumes and buyer volumes, and also calculates the delta and cumulative delta. The indicator does not flicker or redraw, its calculation and plotting are performed fairly quickly, while using the data from the smaller (relative to the current) periods. The indicator operation modes can be switched using the Mode input variable: Buy - display only the buyer volumes. Sell - display only the seller volumes. BuySell -
FREE
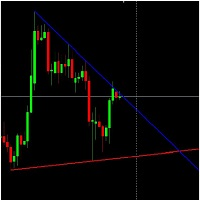
Standard Trend Lines (Automatic).
This indicator draws highly accurate trend lines.
It draws Trend Lines automatically.
This Trend Lines indicator was made by observing lot of discussions made about Trend Lines in forum.
The Trend Lines can also be used to create Expert Advisor.
Latest valid Trend Lines are drawn on Chart.
Trend Lines Work on basis of OHLC price data.
FREE

Pivot Point Fibo RSJ es un indicador que rastrea las líneas de soporte y resistencia del día utilizando las tasas de Fibonacci.
Este espectacular indicador crea hasta 7 niveles de soporte y resistencia a través del Pivot Point utilizando las tasas de Fibonacci. Es fantástico cómo los precios respetan cada nivel de este soporte y resistencia, donde es posible percibir posibles puntos de entrada / salida de una operación.
Características Hasta 7 niveles de soporte y 7 niveles de resistencia
FREE

Si estás utilizando Inside Bar en TradingView, donde detectar inside bars es fácil y reconfortante, pero no lo encuentras en el mercado MQL, tu búsqueda termina aquí. ¿Por qué InsideBar Highlight? Tan fácil como el ABC: Inside bars hecho simple. Nuestra herramienta se centra en el cuerpo de la vela, para que veas lo que importa sin complicaciones. Tu estilo, tu elección: ¿Te gusta colorido o todo igual? Tú decides. Descubre movimientos hacia arriba o hacia abajo sin esfuerzo. Ajusta como un guan
FREE

YOU CAN NOW DOWNLOAD FREE VERSIONS OF OUR PAID INDICATORS . IT'S OUR WAY OF GIVING BACK TO THE COMMUNITY ! >>> GO HERE TO DOWNLOAD
V1 Scalper is an easy to use tool designed for trend scalping. It tries to spot good entry points in a major trend by using swing high and lows formed along the trend . This tool can be used on Fx Pairs , Indices , Commodities and stocks. Not often but in some signals , the arrow might repaint on the current candle so extra confirmation tools are advised for t
FREE

Индикатор строит блоки заказов (БЗ) по торговой системе (ТС) Романа. Поиск блоков осуществляется одновременно на двух таймфремах: текущем и старшем (определяемым в настройках). Для оптимизации и игнорирования устаревших блоков в настройках задается ограничение количества дней в пределах которых осуществляется поиск блоков. Блоки строятся по правилам ТС состоящем из трех шагов: какую свечу вынесли (что?); какой свечой вынесли (чем?); правило отрисовки (как?).
FREE
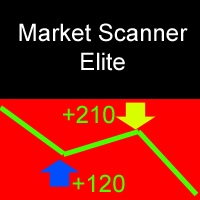
Market Scanner Elite is a new generation of indicators of the Market Scanner series. The Elite version features an improved market analysis algorithm, with a better identification of the entry points and filtering of the false signals. The logic of market analysis and calculation of effective entry points applied in this product are significantly different from those applied in Market Scanner . This indicator cannot be called a big brother, as it is a completely new product with innovative analy
FREE

This is an indicator for Quasimodo or Over and Under pattern. It automatically finds the swing points and can even place virtual trades with stop loss and take profit. Press the "Optimize" button to automatically find the most effective settings. The pattern consists of four legs A,B,C,D as shown in the pictures. Open and close prices of the virtual trades are Bid price but the statistics in Display Panel take current spread into account. Its parameters are explained below. Buffer - Pips distanc
FREE
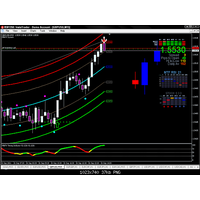
Gravity Timing Indicator -GTI-
El indicador GTI es el indicador más fácil y preciso hasta el momento. Utiliza soporte y resistencia de forma gravitacional. Trabajar en él es muy fácil, consta de 7 líneas, las más poderosas de las cuales son las líneas más baja y más alta, así que cuando el indicador rebota, es el mejor momento para entrar.
funciona en todos los pares sin excepción
para el marco de tiempo, prefiero marcos de tiempo pequeños como 5 minutos y 15 minutos para reventa.
FREE

Este indicador personalizado lo diseñé para Metatrader 4 para poder identificar fácilmente la hora estándar del este (hora local de Nueva York) desde cualquier servidor de metatrader 4. Pero puede usar esto para identificar su hora local cambiando la zona horaria en el menú desplegable. Le permite agregar una línea vertical de cualquier color a cualquier hora en particular en la zona horaria seleccionada de su elección. Le permite agregar líneas horizontales de cálculo automático de apertura,
FREE
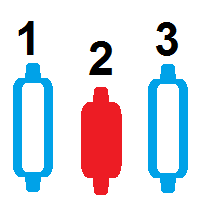
indicador de contador de velas este indicador cuenta las velas que están en el gráfico de cualquier período de tiempo una barra de barra gratis para descargar en mt4 el contador de barras cuenta cuántas velas hay dentro de un gráfico más grande con este contador de candles puedes hacer el conteo automático de velas Indicador de conteo de velas gratis para que descargues y cuentes las barras automáticamente bar counter to count the bars count candle counter indicator mt4 count candle contador de
FREE

This tool gives you the opportunity to display pivot point support and resistance levels as well as the daily open, weekly close and monthly close levels on your chart with high levels of customization.
Pivot points are important horizontal support and resistance levels that get calculated using the high, low and closing price of the previous period (for example D1). With this indicator, you can choose between hourly to monthly timeframes to base your pivot point calculation on.
There is a
FREE
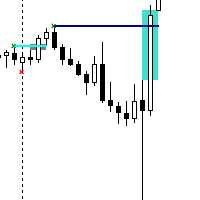
The Contraction/Expansion Breakout Indicator for MetaTrader 4 (MT4) is a powerful tool crafted to identify and signal the breakout of bullish and bearish contraction or expansion formations within financial markets. Utilizing advanced algorithmic calculations, this indicator assists traders in recognizing significant price movements that frequently accompany these formations, providing valuable insights for strategic trading decisions. Key Features: Contraction and Expansion Identification: The
FREE

Platone Breakout SMC - Advanced Trading Indicator Overview The Platone Breakout SMC is an innovative and powerful MetaTrader 4 (MT4) indicator designed for traders who seek to capitalize on smart money concepts (SMC) and breakout trading strategies. This indicator provides precision in identifying breakout levels, session times, and profit targets, ensuring that traders can execute well-informed trades with confidence. Trading Logic The core of the Platone Breakout SMC is its ability to identif
FREE

Trend arrow Indicator is an arrow Indicator used as an assistant tool for your trading strategy. The indicator analyzes the standard deviation of bar close for a given period and generates a buy or sell signals if the deviation increases. It good to combo with Martingale EA to follow Trend and Sellect Buy Only/Sell Only for EA work Semi-Automatic.
You can use this Indicator with any EAs in my Products.
FREE
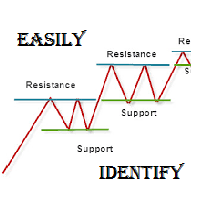
As per name Easily Identify, This Indicator is a affordable trading tool because with the help of Popular Developers & Support of M Q L Platform I have programmed this strategy. I tried to input 4 types and 3 periods of Calculation regarding Support Resistance, Furthermore, I have also care about Trend lines that Trader can easily get in touch with market in another way also. What is in for Trader?
Trading Modes: This selection is for activate whole strategy "Easily Identify" Support_
FREE

Este indicador puede enviar alertas cuando se produce un cambio de color Heiken Ashi Smoothed. Combinado con sus propias reglas y técnicas, este indicador le permitirá crear (o mejorar) su propio sistema poderoso. Características Puede enviar todo tipo de alertas. Opción de retrasar la alerta una barra para confirmar el cambio de color (tendencia). Parámetros de entrada Espere a que se cierre la vela: 'verdadero o falso'. Establecerlo en 'verdadero' retrasará la alerta hasta la apertura de
FREE
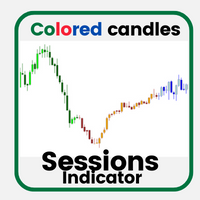
This indicator shows trading sessions using colored candles. It's made for volume profile and supply/demand traders to quickly see when specific candles are formed during different times or trading sessions.
Take a look at the screenshots for a usage example.
Core Features: Different colors for bullish and bearish candles, allowing users to distinguish between bullish/bearish candles.
FREE
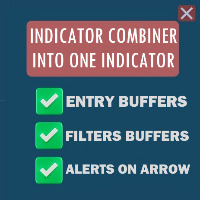
Optimize your trading strategy of your custom indicators with the "Indicator Combiner Into One Indicator". This advanced tool combines multiple indicators, including your custom indicators, into a single, user-friendly interface. It generates an arrow signal based on your custom indicators, simplifying your decision-making process. Ideal for traders of all levels, this indicator offers:
Arrow Signals : Get a clear, single arrow signal that combines insights from your custom indicators, m
FREE

Este indicador está basado en el famoso indicador fractal pero con mucha personalización y flexibilidad.
Esta es una herramienta poderosa para identificar cambios de tendencias y maximizar su potencial de ganancias.
Con sus funciones avanzadas y su interfaz fácil de usar, es la mejor opción para operadores de todos los niveles. Versión MT5: Ultimate Fractals MT5 Características :
Recuento de velas fractales personalizable. Líneas de inversión. Configuraciones personalizables. Interfaz a
FREE

This Indicator is a affordable trading tool because with the help of Popular Developers & Support of M Q L Platform I have programmed this strategy. I tried to combine logic of Moving Averages, Parabolic Stop And Reverse, Trend Strength, Oversold, Overbought . Furthermore, I have also care about Support Resistance that Trader can easily get in touch with market by selecting one indicator only. What is in for Trader?
Trading Modes: This selection is for activate whole strategy "Power
FREE
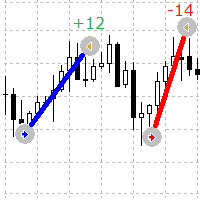
Un indicador simple pero útil para ver visualmente los puntos de entrada y salida de órdenes en el gráfico
Este indicador muestra las órdenes abiertas actuales y las órdenes completadas en el símbolo
Parámetros del indicador
Lines Buy color: especifica el color de las líneas para las órdenes de compra. Lines Sell color : especifica el color de las líneas para las órdenes de venta Lines Width : establece el ancho de línea, funciona para tipos de estilo sólido Lines style : establece el est
FREE
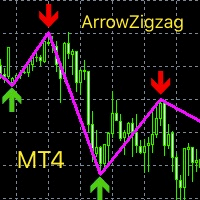
This index is based on the secondary development of zigzag, adding high and low point arrow indication, thickening the line and changing the color. Can be a good display of the current admission trading signals, current long or short. It can be combined with other indicators to determine the trading point, which has great reference value. Compared with the general trend index or oscillation batch standard, the accurate determination is higher from the perspective of historical data research and
FREE

Trend Master Chart es el indicador de tendencia que necesita. Se superpone al gráfico y utiliza códigos de colores para definir diferentes tendencias/movimientos del mercado. Utiliza un algoritmo que combina dos medias móviles y diferentes osciladores. Los periodos de estos tres elementos son modificables. Funciona en cualquier período de tiempo y en cualquier par.
De un vistazo podrás identificar una tendencia alcista o bajista y los diferentes puntos de entrada a esta tendencia. Por ejemplo
FREE

FVG Fair Value Gap is an indicator that plot rectangle for last found fair value gap. There will be a total of eight fair value gaps. Four is bullish fair value gaps and another four is bearish fair value gaps. Bullish Fair Value Gaps Top Bullish/Bearish Fair Value Gap is the gap that will obey the "Recent candles" and "Nearby Size In Pips" parameters. This fair value gap will be above current price. Bottom Bullish/Bearish Fair Value Gap is the gap that will obey the "Recent candles" and "Nearb
FREE
El Mercado MetaTrader es la única tienda donde se puede descargar la versión demo de un robot comercial y ponerla a prueba, e incluso optimizarla según los datos históricos.
Lea la descripción y los comentarios de los compradores sobre el producto que le interese, descárguelo directamente al terminal y compruebe cómo testar el robot comercial antes de la compra. Sólo con nosotros podrá hacerse una idea sobre el programa, sin pagar por ello.
Está perdiendo oportunidades comerciales:
- Aplicaciones de trading gratuitas
- 8 000+ señales para copiar
- Noticias económicas para analizar los mercados financieros
Registro
Entrada
Si no tiene cuenta de usuario, regístrese
Para iniciar sesión y usar el sitio web MQL5.com es necesario permitir el uso de Сookies.
Por favor, active este ajuste en su navegador, de lo contrario, no podrá iniciar sesión.