This is an indicator based on wave fibs possibly identified using a zigzag + a diagonal trendline with fibs, requested as follows.
Imagine a simplified Elliott wave, where there are only ever 3 waves, 1,2,3.
So this can be inceptive impulsive 1,2,3
Or it can refer to 3 impulsive 3,4,5
Or it can refer to corrective ABC
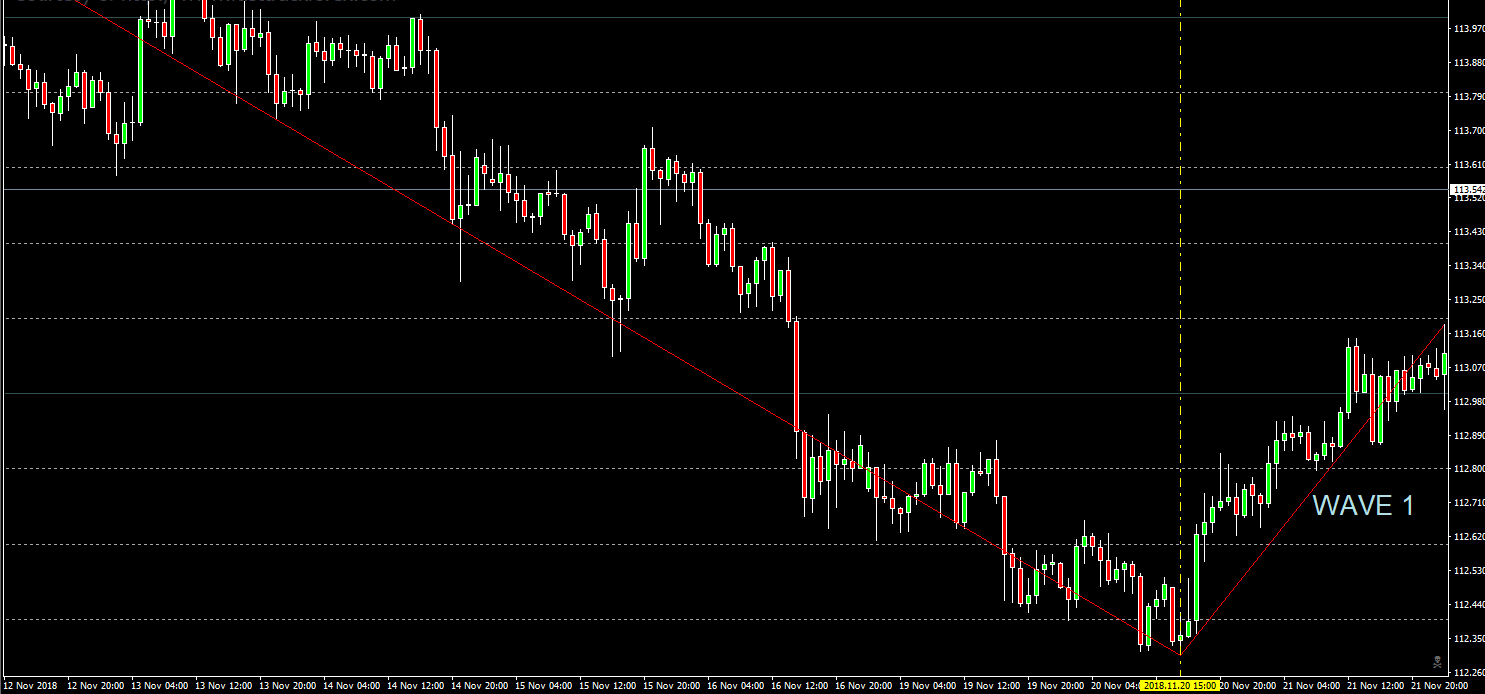
(1) Allows zigzag to be drawn based on number of pips, or number of pips relative to ATR
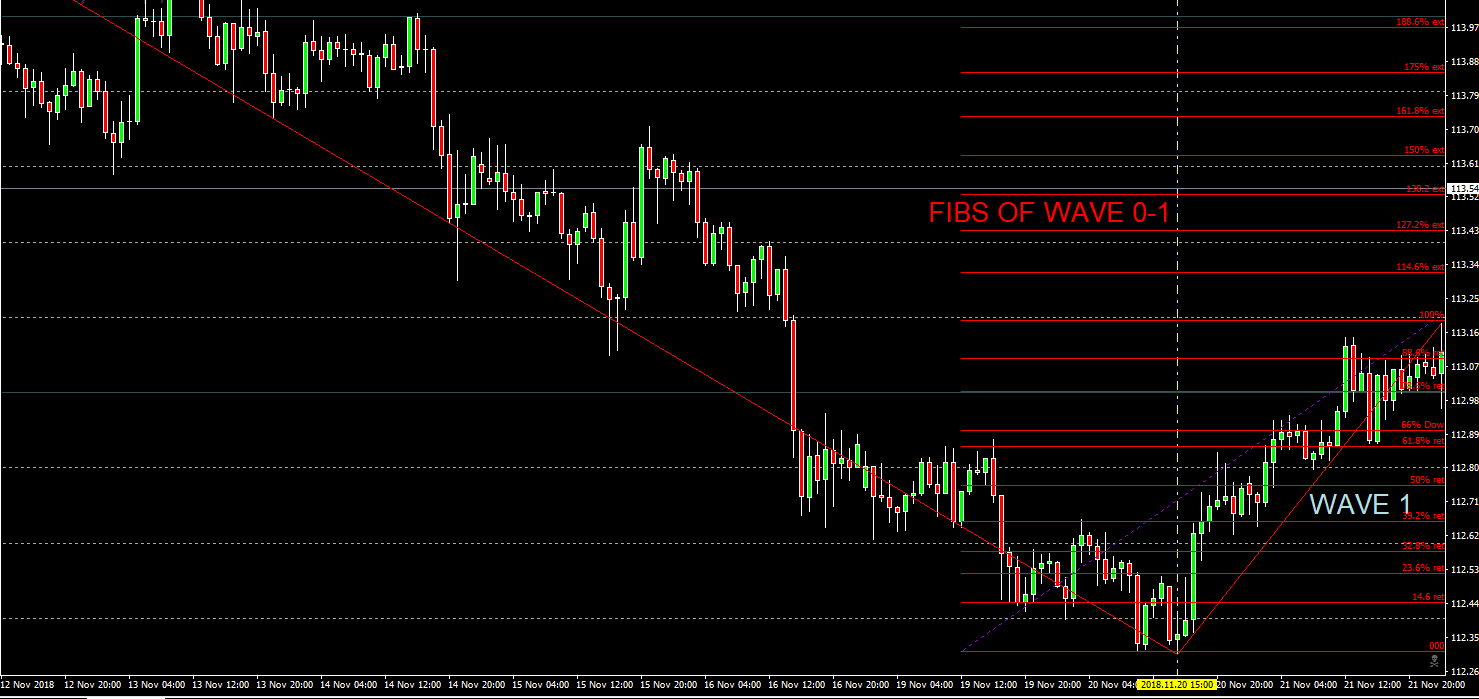
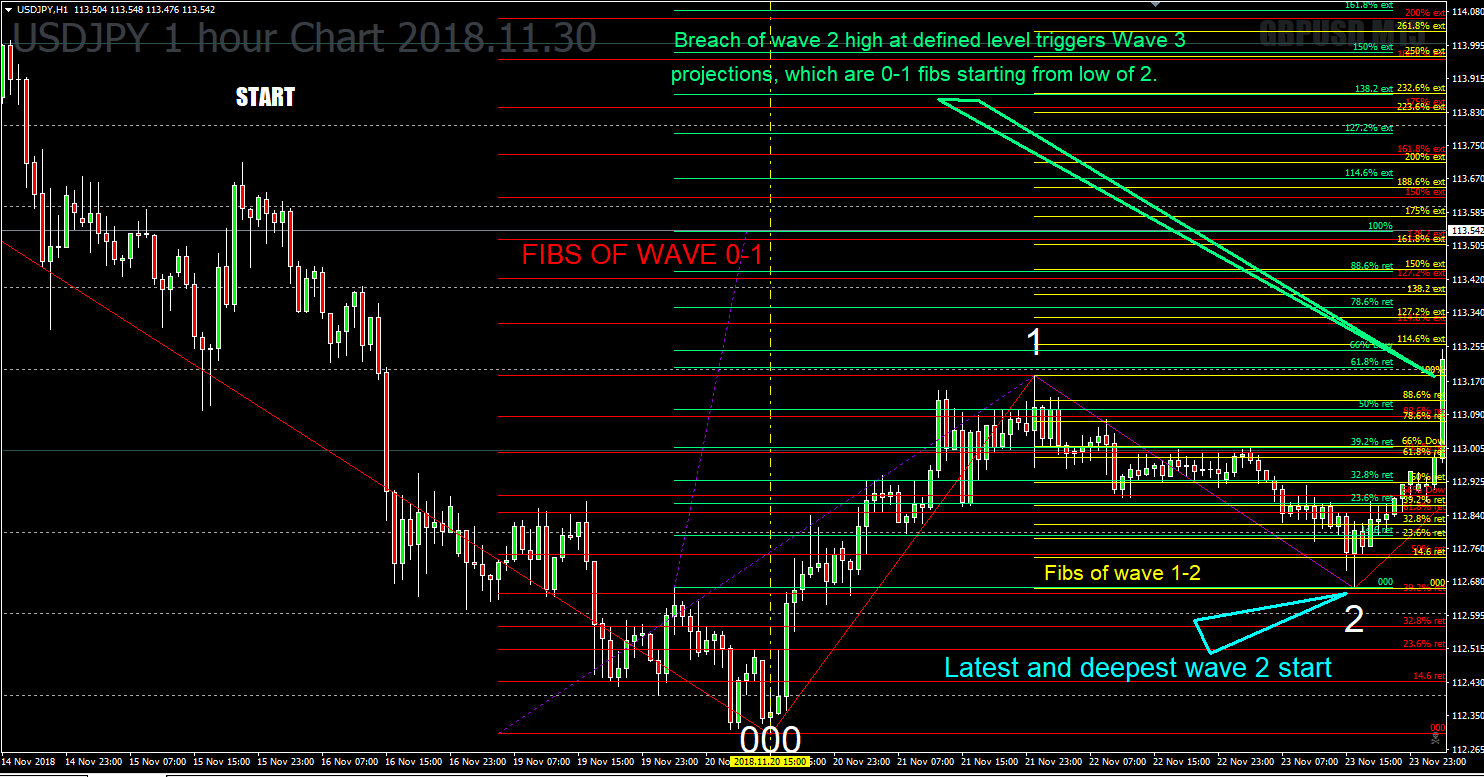
(2) Draws Fibs for Zigzag wave 0-1, or user defined Wave 1.
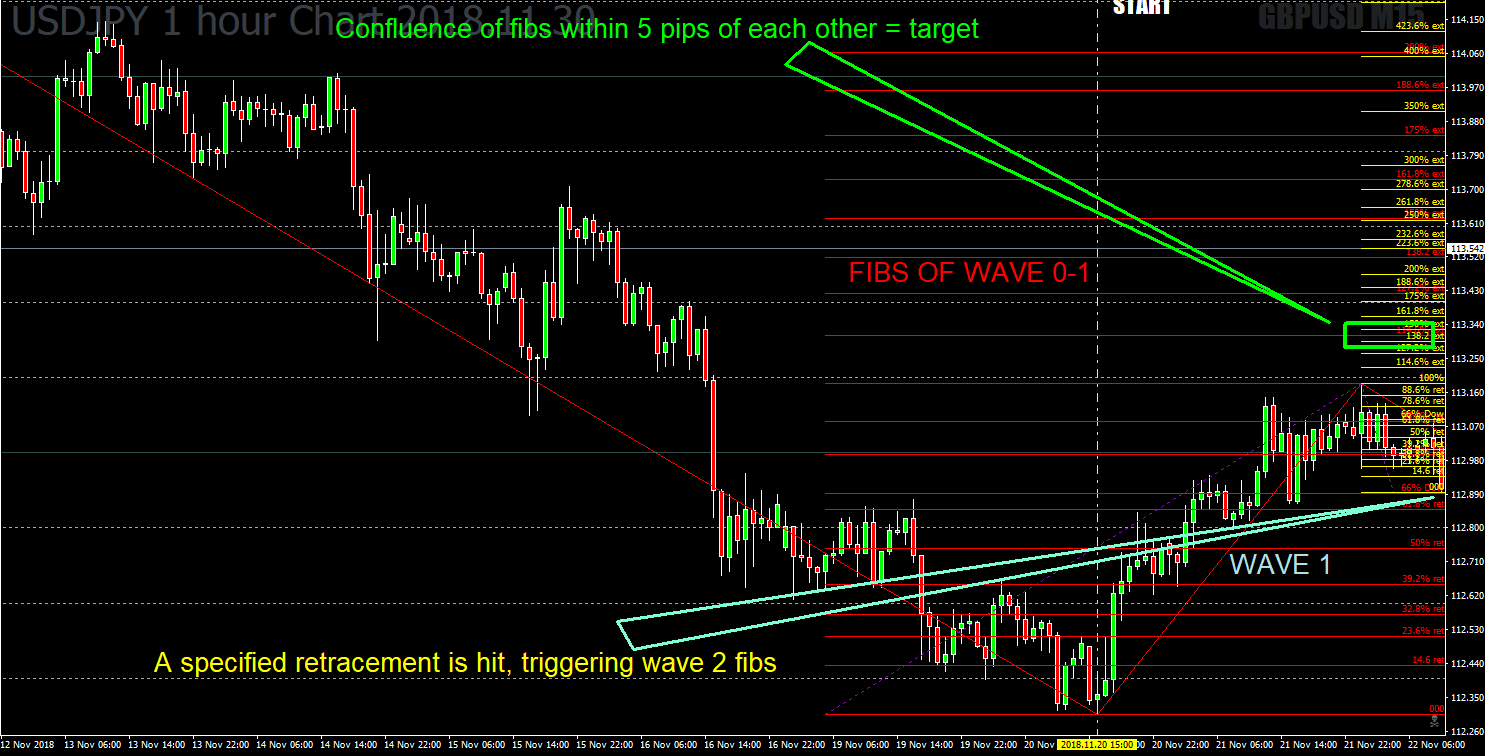
(3) Draws Fibs using wave 1-2
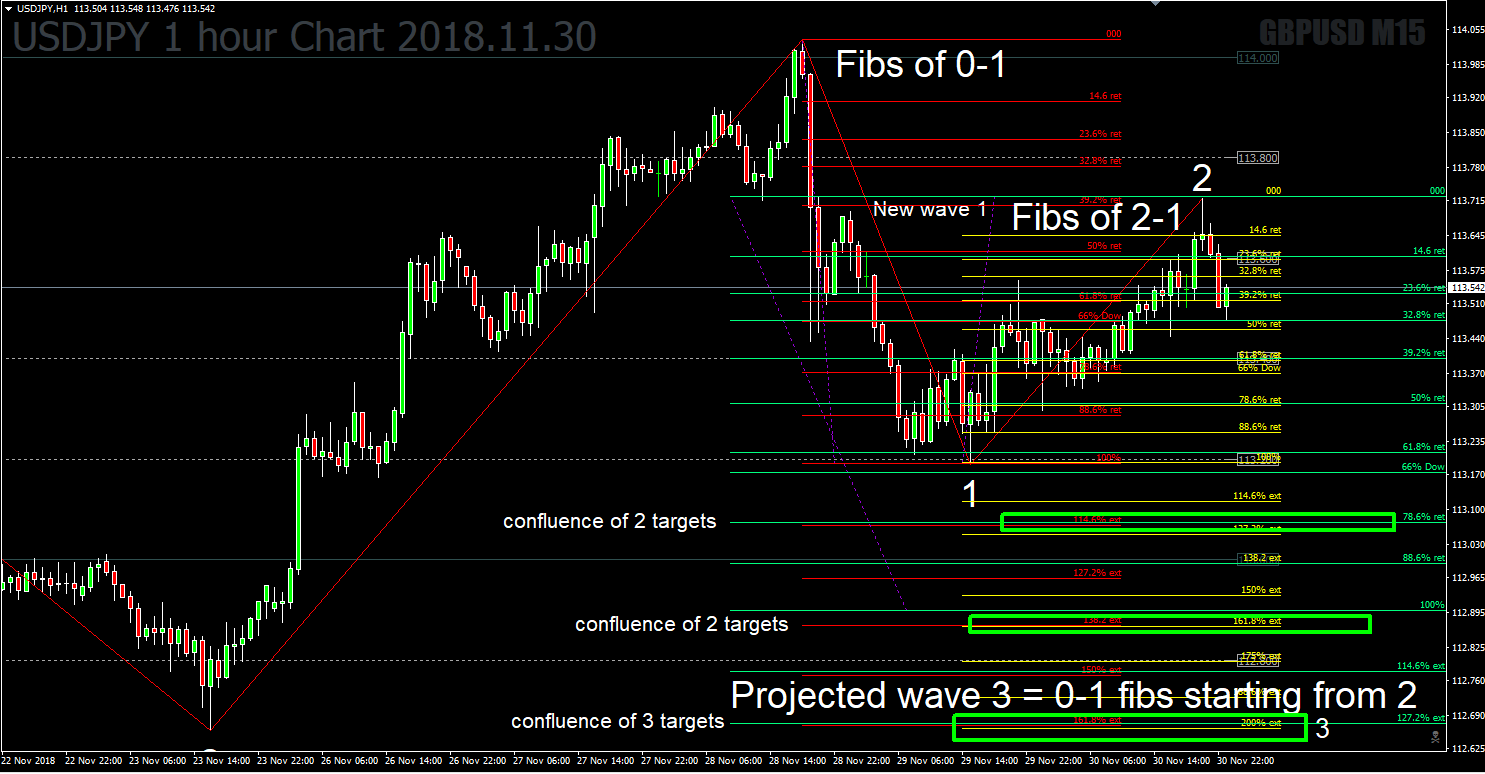
(4) Draws Fibs using Zigzag wave 0-1 but starting from start of wave 3 (i.e. end of wave 2)
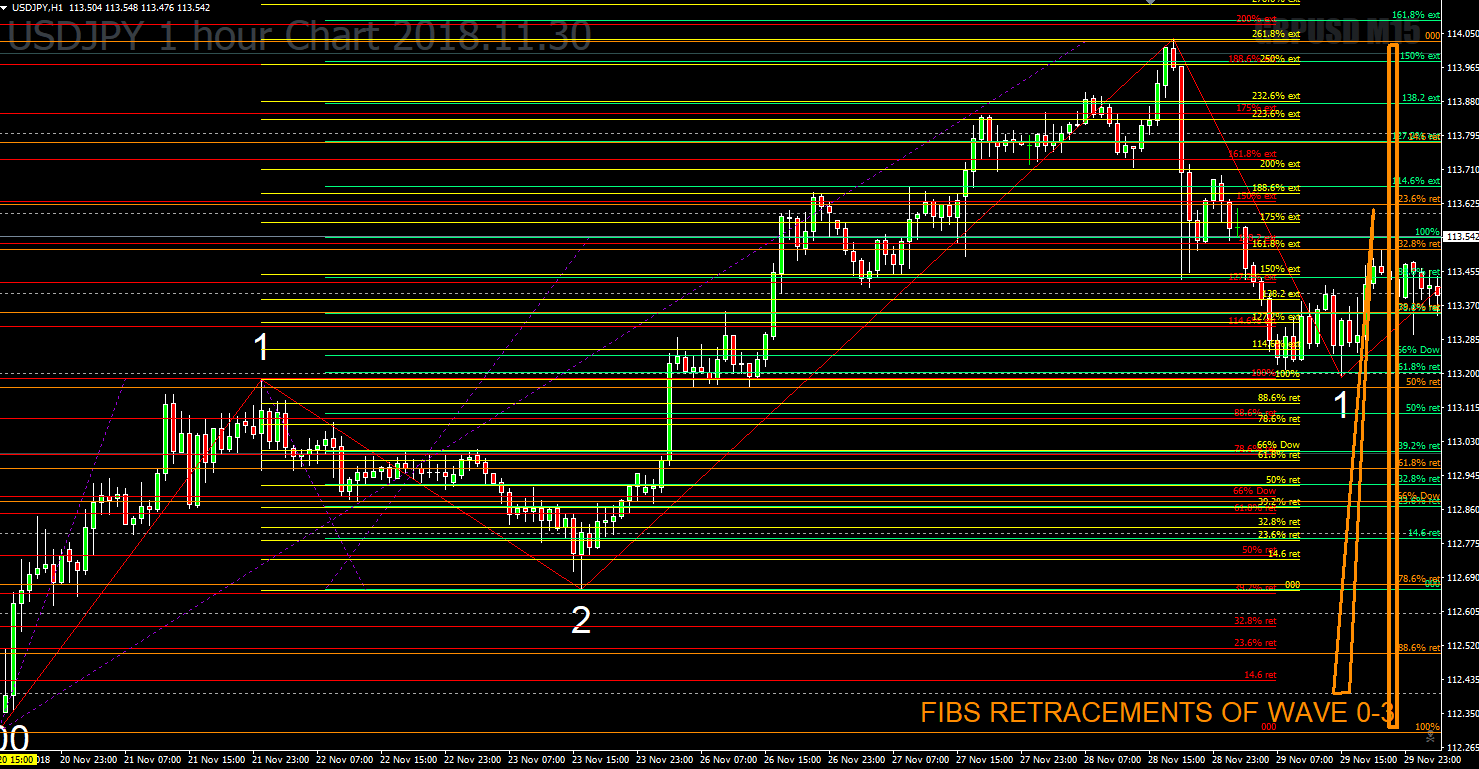
(4b) Draws Fibs of 0-3 after 3 target specified is hit based on 0-1, e.g. 161.8% beginning from 0-1 where 1 high=100%. Update if prices goes higher.
(5) Wave 0-1 defined in pips or pips relative to ATR
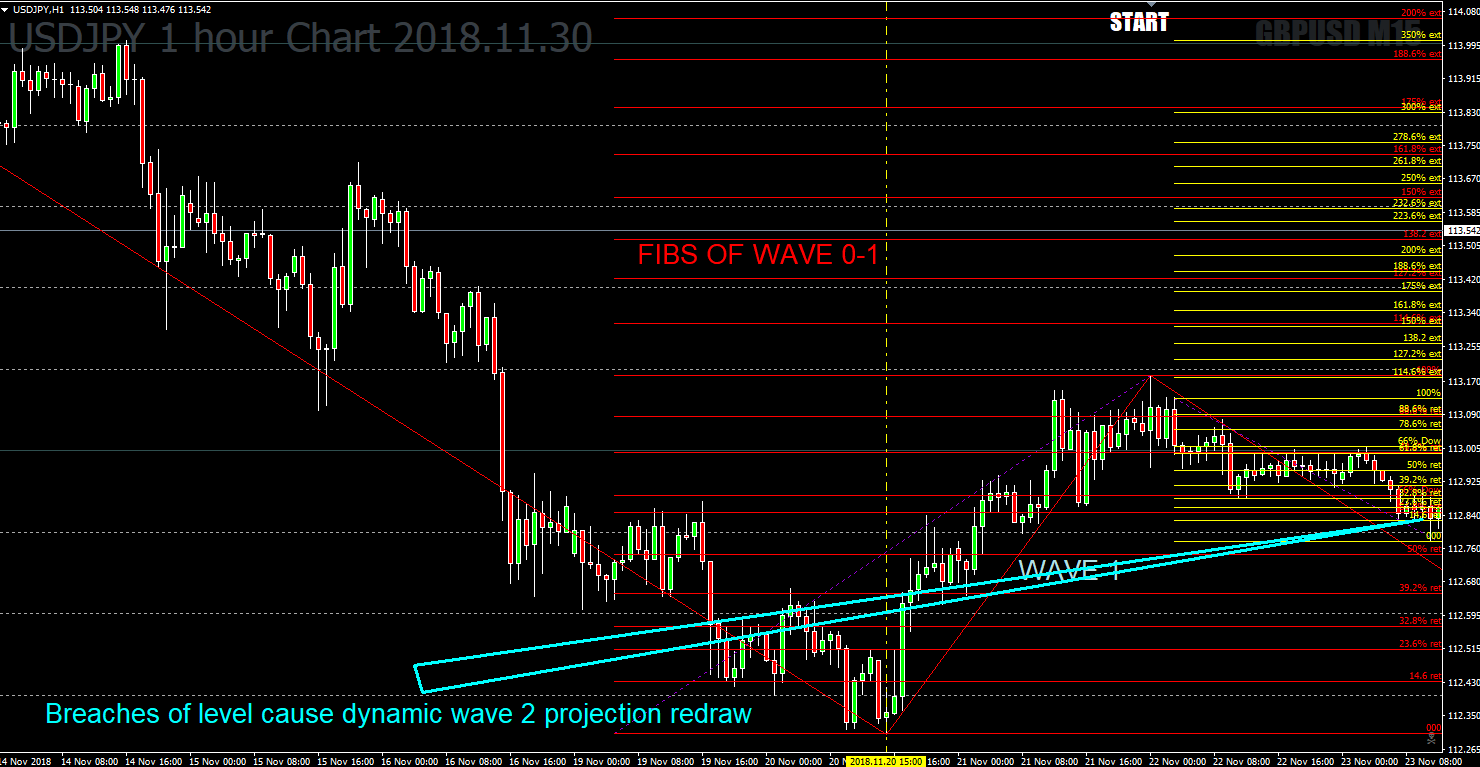
(6) Wave 2 defined as a hit of retracement of wave 1, and updates if price breaches current wave 2 low.
(7) Beginning of wave 3 defined as breach of wave 2 high + X%.
(8) A confluence of 2 or more fibs, within, e.g. 5 pips of each other, is highlighted as 'potential target' for wave 3.
(9) Can paint up to (switch on or off) up past waves (i.e. countback in zigzags)
(10) Number of and percentage of retrace and targets can be defined in each case as a list.
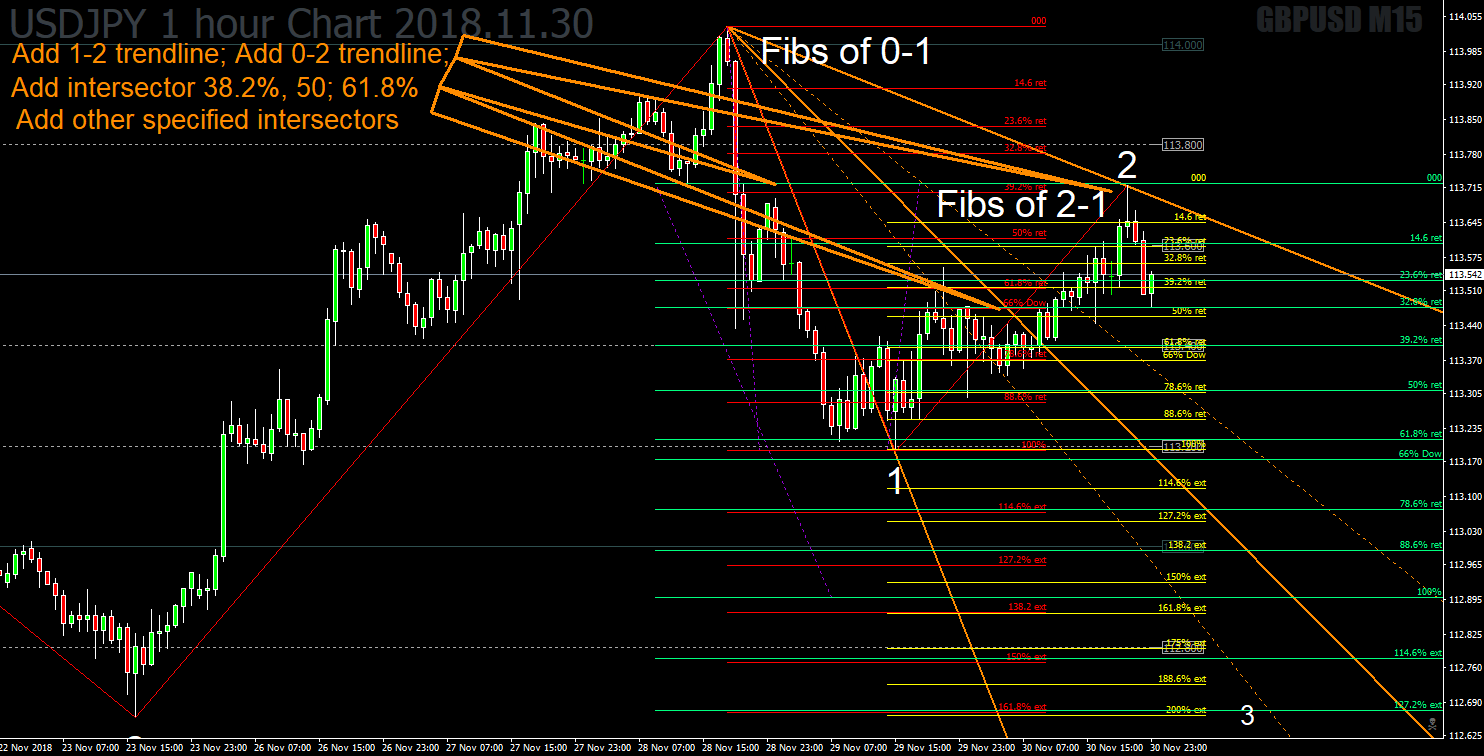
(11) Once wave 1 and 2 form, add wave 0-1 trendline and wave 0-2 trendline + fib "fan-like" intersectors.
(12) Fib levels for the 3 projections and the retrace of 0-3, and the intersecting lines can be specified by the user in both number of and % level.
Summary, for upward impulsive wave 1:
= Identify wave 0-1 by specifying
= Draw Fibs 0-1 + extensions (Fibs 1)
= When a retracement hit, draw wave 1-2 fibs, which is 1-2 + extensions (Fibs 2)
= Draw also 0-1+extensions, starting from low of 2. (Fibs 3 - option to draw these only when wave 1 is exceeded, at fib level 100%, or 110% or whatever).
= Draw trendline 0-1 and trendline 0-2 with 50% intersector and other fib intersectors as fan.
= Mark confluences of 2 lines according to maximum pips difference between them as targets
= Mark confluences of 3 lines according to maximum pips difference between them as targets
= When wave 3 target specified is hit, e.g.200% of wave 0-1 where 0=0%, 1=100% of 0-1, draw 0-3 retracement fibs
= Can switch on or off any of these options
= Can list fib levels desired, e.g. 50%, 100%, 150%, 200%, for each of the waves separately
= Can lookback, or start at an earlier wave
Examples are attached.
Quick turnaround desired.
Solicitudes similares
Inputs being: Number of bars to the left of fractal Number of bars to the right of fractal Number of bars we look back from the current bar (e.g., 30) Number of most recent up (or down) fractals we take into account (e.g., 3) in those number of bars (third input) Most recent fractals' distance from each other, can be either fixed percentage difference between them or automatic based on another indicator (stdDev or
Hi! I have indicator for MT4 (Atomic Analyst). I have attached it below. This indicator has a line in the middle of the chart that can be either green or red (Pic 1). I need to make an indicator for MT4 that will show in one window the colours of the line on each timeframe. Like on the Pic 3 attached (Each line represents timeframe). The indicator has to adjust to timeframes. For example if The line become red on H4
I'm looking for someone who can translate me few indicators to MT4 from tradingview. I'll share more details in private to discuss further. This isn't a one time job, if everything goes great, I have other projects
hello i have a indicator who create bar signals with over painting from past in to future signals... much strange but iam sure that this will be possible to fix maybe somebody can help me, this will be nice. it is similar with high n low aswell i guess pivot points
Make a bot that notifies the trader of potential buy/sell entries which uses Moving averages to identify the entry. This will need to be done on the Meta Trader 5 system and on the 5 min time frame with the Indicie of US30. All info and details of MA's will be sent once quote is accepted
I need a translation of an indicator from TradingView to MT4 indicator. The indicator has diferent set of rules. More details will be shared in prviate. Thank you for your services
Hi, i have a source code for a tradingview indicator. Other coder said that the indicator is complex due to the indicator use the library from tradingview. I need someone who can help me convert this complex indicator to MQL4 Indicator
you must be so good for bringing 4 different zigzag indicators features into High - low trend 3.04 (mtf + alerts + candles + bt) and sorting out their array out of range issue with strict mode and mtf issues. clean mt4 file is needed without any errors, warnings, no array out of rang issue etc
Preciso de um indicador "Mostra Luco" ou "Show Profit", idêntico ao da imagem. A diferença é que preciso para Metatrader 5, enquanto oque possuo é para Metatrader 4. Caso precise do arquivo MT4 como base posso fornecer, mas creio que seja código fechado // I need a "Show Profit" indicator, identical to the one in the image. The difference is that I need it for MetaTrader 5, while the one I currently have is for
Pls the filter rsi 14 a above level 50 and moving average above 50 apply on higher time frame than the bot current time frame. PLS CHECK THE FILE BEFORE EVEN CHAT ME . PLS DONT CHAT ME IF YOU DONT check the screenshot file