Mira cómo encargar de forma rápida un robot comercial
Lea las reglas antes de empezar el trabajo
Cómo encargar un robot comercial en MQL5 y MQL4
Mire el ejemplo de Tarea Técnica para encargar un robot
Nuevas solicitudes en la categoría:
30+ USD
30 - 150 USD
30+ USD
Tarea técnica
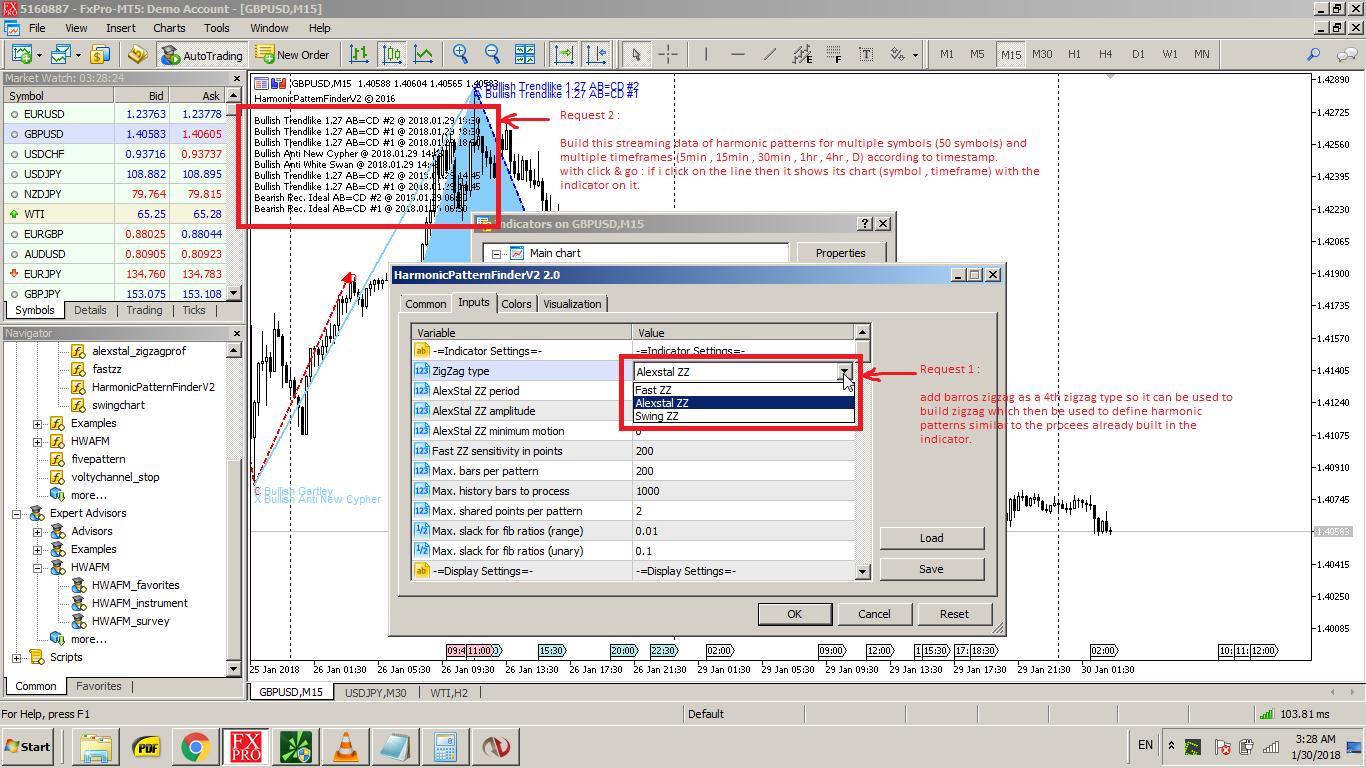
Upgrade indicator , Collect data from indicator (Harmonic Pattern Finder V2) multiple symbols & multiple timeframes - dashboard.
This is the indicator I want to get some modifications on : https://www.mql5.com/en/code/16852 and called (Harmonic Pattern Finder V2).
I want to do two things on the indicator:
1- the indicator (Harmonic Pattern Finder V2) is using different zigzag's indicators (alexstall zz , fast zz , swing zz) to define swings for which it then use to search for harmonic patterns.
i have (barros zigzag = Barros2.mq4) attached which is much better in defining swings .. plz have a look at it.
I want to update the indicator (Harmonic Pattern Finder V2) by adding (barros zigzag = Barros2.mq4) as a 4th zigzag option and use barros zigzag swings to build harmonic patterns using (Harmonic Pattern Finder V2)?
as you see in the attached pictures that the (Harmonic Pattern Finder V2) is using 3 zigzag's options types and I want to add (barros zigzag) as a 4th zigzag option which can be used to define the harmonic patterns already built in the indicator but by using the barros zigzag = Barros2.mq4.
2- After you do the first request : if you put the (Harmonic Pattern Finder V2) on the chart then it will stream the latest harmonic patterns appeared on that chart on the upper left corner.
I want to build streaming dashboard for multiple symbols and multiple timeframes to show the latest harmonic pattern for symbols on these timeframes .. just show arrow (or blue/red arrows : if many patterns happen to occur on same swing point) .. just show the status of the most recent pattern/patterns (arrow , arrows) for the (last pattern = first line).
I want to combine this streaming of patterns (last pattern = first line) for multiple symbols (50 symbols) and ,multiple timeframes (5m , 15m , 30m , 1hr , 4hr , d) on one table >> just i define the 50 symbols and timeframes i want to track then it stream the latest patterns appear for symbol x on timeframe y @ timestamp z.
I'm looking to build dashboard (table showing multiple symbols , multiple TF's) showing the status of the indicator in each TF for each symbol using only arrow (or arrows). I just want to show arrows in the dashboard for each symbol in each TF (maybe many arrows in each cell).
it show the latest pattern appeared for these symbols/timeframes/timestamp on one chart by using arrow/arrows.
then if i click on any line then it take me to that symbol/timeframe arranged by the timestamp of the pattern appearance.
P.S. Please look at the attachments.
Solicitudes similares
Hello, I need a custom Expert Advisor for MetaTrader 5. I am trading from mobile only. **Account & Style:** - Capital: $5,000 - $10,000 - Risk: Moderate/Balanced - Trading Style: Scalping **Pairs & Timeframe:** - Symbols: EURUSD and XAUUSD - Timeframe: M5 **Strategy:** - BUY: RSI(14) < 30 AND Price > 20 EMA - SELL: RSI(14) > 70 AND Price < 20 EMA - Only 1 trade per symbol at a time - No Martingale / No Grid **Risk
Iconic Boy
300 - 400 USD
Am looking for a bot to trade .so that I can be able to trade and become very successful and make some profit so that I cannot sleep on a empty stomach
Hello Traders and Investors, I am a professional algorithmic trading developer specialized in building high-quality Expert Advisors (EAs), Indicators, Scripts, and Trade Management Tools for MetaTrader 4 and MetaTrader 5. With extensive experience in financial markets and trading automation, I can transform your trading ideas into reliable and efficient solutions with clean, optimized, and well-structured code. My
Macd Rsi stochastic vwap Bot. I have code.
150 - 300 USD
Привіт. Шукаю когось, хто б застосував мій код як бота . Я торгую індексом Aus_200 SFE (не XJO). Бот базується на MACD входу/виходу, RSI, стохастиці та vwap. Як тільки роботу приймуть, мені потрібно внести кілька коректив; однак, нічого суттєвого. Дякую
MT4/MT5 HFT EA us30
30 - 3000 USD
Hello everybody, I'm looking for an experienced MQL4/MQL5 developer to optimize a High-Frequency Trading (HFT) Expert Advisor for both MT4 and MT5. The EA performs consistently and profitably on demo accounts, but when it is run on Raw and Standard live accounts under what appear to be the same trading conditions, it begins generating losses. I do not have the original source code (.mq4/.mq5); I only have the
MT4/MT5 HFT EA Live Trading
40 - 10000 USD
I have a High-Frequency Trading (HFT) Expert Advisor for both MT4 and MT5 designed primarily for US30 (Dow Jones Index) . The EA performs consistently and profitably on demo accounts, but when I run it on an IC Markets Raw or Standard live account, it starts generating losses under what appear to be the same trading conditions. At this time, I cannot provide the source code (.mq4/.mq5). I can only provide the
HFT / Latency Arbitrage pepperstone
30 - 5000 USD
I am looking for an experienced MQL5 developer to build a high-frequency (HFT) latency arbitrage Expert Advisor for Pepperstone MT5 , using LMAX as the leading price feed. The initial focus will be on US30 (Dow Jones) , and if the strategy proves successful, I want the EA to be easily expandable to additional symbols such as NAS100, GER40, XAUUSD, major forex pairs, and other supported instruments. The EA should
ENTRY EXIT TIMING (ET BANDS)
30 - 50 USD
QUIERO CONSEGUIR EL CODIGO FUENTE DE ESTE INDICADOR QUE ME GUSTA MUCHO TAMBIEN TIENE EL NOMBRE DE ET BANDS O ENTRY EXIT TIMING . no se los componentes pero estas son las imagenes. que mejor lo describen
Hello Developers, I want to build a custom Expert Advisor (EA) for MetaTrader 5 (MT5) to trade Gold (XAUUSD) and Bitcoin (BTCUSD). This will be based on my own custom strategy. Here are the project requirements: 1. Platform: MetaTrader 5 (MQL5) 2. Trading Assets: Gold (XAUUSD) and Bitcoin (BTCUSD) 3. Timeframe: Suitable for multi-timeframe execution (I will specify the exact timeframes in private chat) 4. Core
Standby Description . Prop Firm Environment . ( Monitor Execution and Handling Environment Changes as Required ) . Technical Issues . Delete extra lines of code (Clean Code , Folder) . Asset related translation , no need for Logic Alteration
Información sobre el proyecto
Presupuesto
30 - 50 USD
Plazo límite de ejecución
a 10 día(s)