I need an indictor/script that will draw exact horizontal trendlines.
I attached an image to show what I mean.
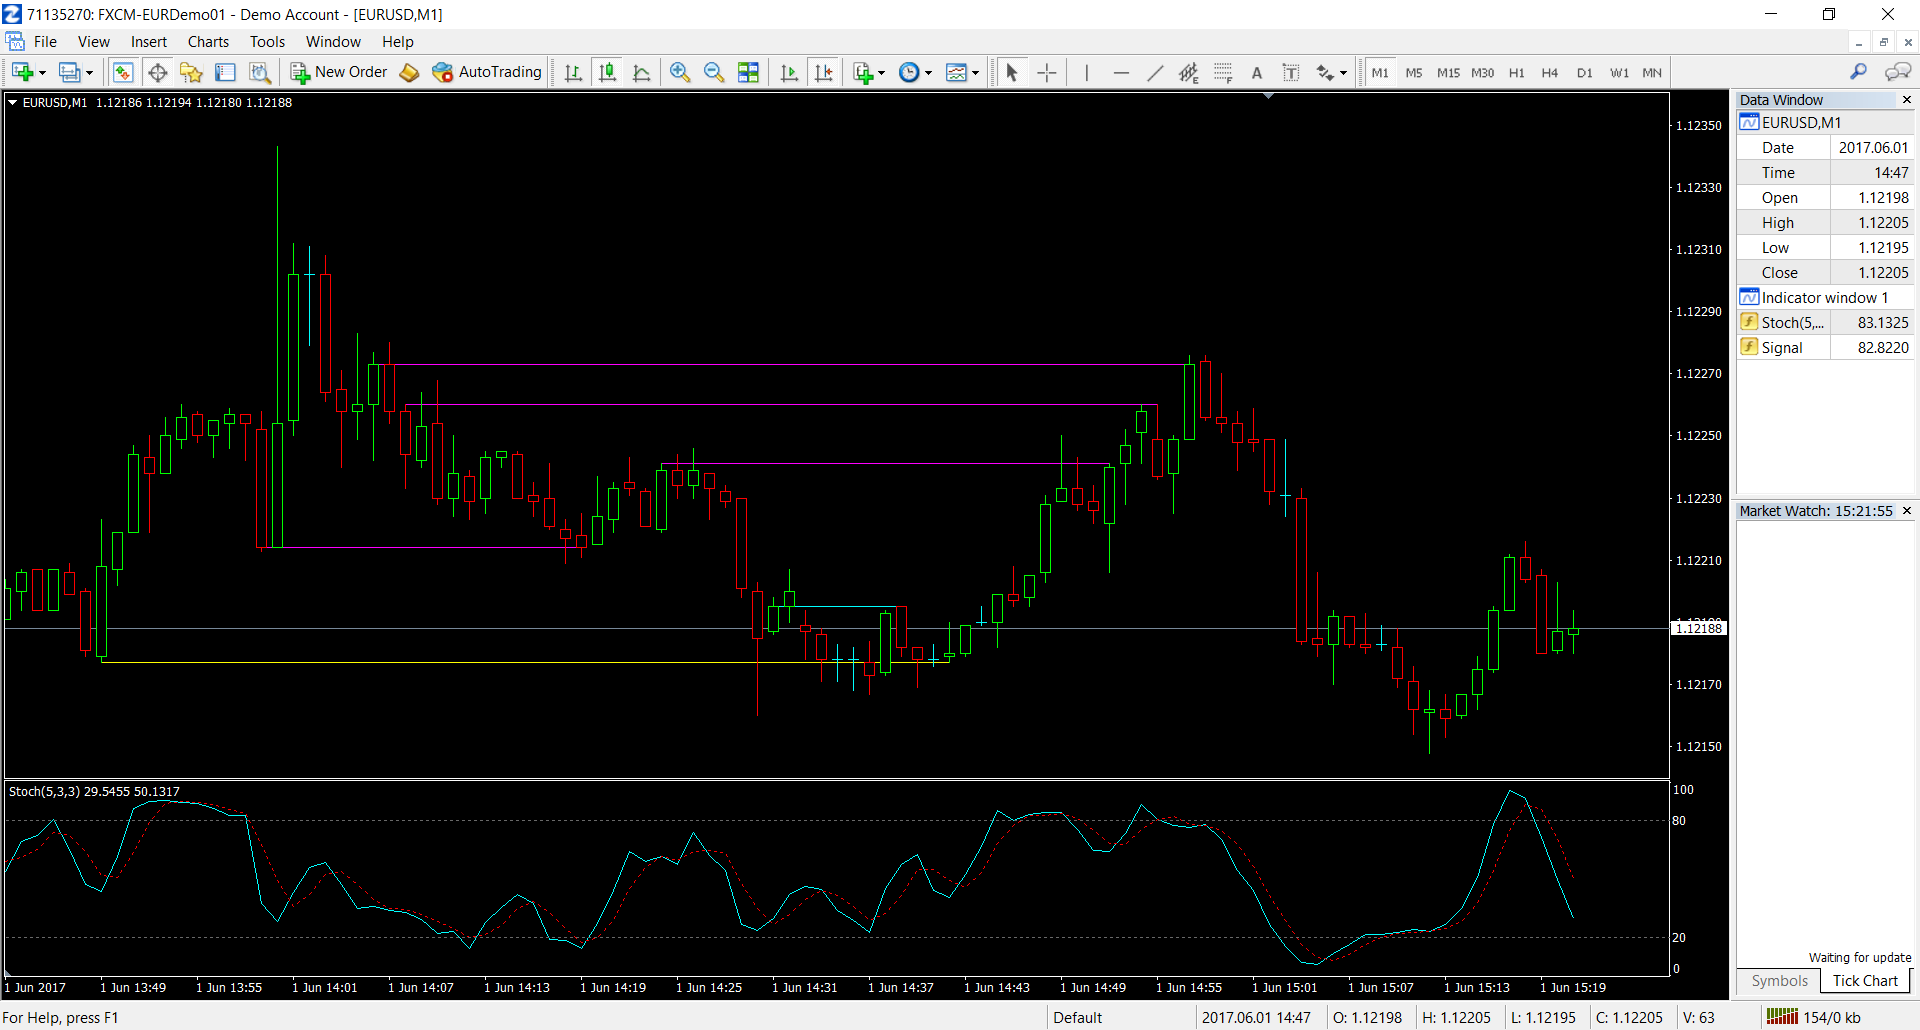
The purple horizontal lines show candlesticks which hit the same exact price point.
The lines which are to be automatically drawn can be OHLC as shown by the purple lines.
The lines may go through the High or Low but never solid candles.
The small blueish line shows the line going through only one solid candle which is okay.
The lines shouldn't exceed more than one solid candle, (I added the yellow line to show this), the yellow line goes through two solid candles.
Also, they must NOT be continuous lines which extend both ways forever.
Final requirement is that the the lines should not match a two different sides of candles (for ex: the top side of a candle can only match with other top sides of candles whether red or green, but cannot match with the bottom side unless the line can go through that bottom side and match with the top side of a candle as shown in the blue line in the attached image and vise versa)
Solicitudes similares
Hi, I have a Compiled JForex strategy (.jfx file) I would like someone to convert it in to readable source code. Please let me know if you can do this task. Thank you
I want to make something automatic which EMA will automatically trade in my account. For this I want to make a simple robot I want to get this made automatically on a simple EMA
I need a professional who have the full knowledge in Ctrader and I want to add new idea for my ctrader https://ctrader.com/algos/indicators/show/3444/ Let me know if this is what you can do and the price to get it done. Thanks
I am looking for a skilled Thinkorswim script developer for a one-time project. Your task will be to combine 8 distinct Thinkorswim studies (I will provide the code for each) into one Lower Study. The final script should display histogram rows for the individual studies with a bubble color scheme of bright green, dark green, gray, dark red, and bright red
I need some who can develop my strategy and hand me over the source code... I will give you the specific area in the market i want to mark out and then set pending orders to execute once price move into the zone