Trabajo finalizado
Tarea técnica
Hi, I'm looking for three indicators to be built.
First but how I trade cause this might have some bearing on what I need and how its programmed. I trade on off-line tick charts generated with the rwtickcharts software.
http://www.rwtickchart.com/index.html .
So any indicator needs to work on these off-line charts. I trade soley the EURUSD and work with 21, 34, 55 and 70 tick charts depending on time of day.
Ok, first indicator needed. We'll call it "Bobs Box Patterns" . I trade box pattern breakouts. I'm a bit of a student of Bob Volmans. So I'm searching for an indicator that will draw these boxes on my chart. Probably the most readily identified and the simplest box pattern is the double inside bar,
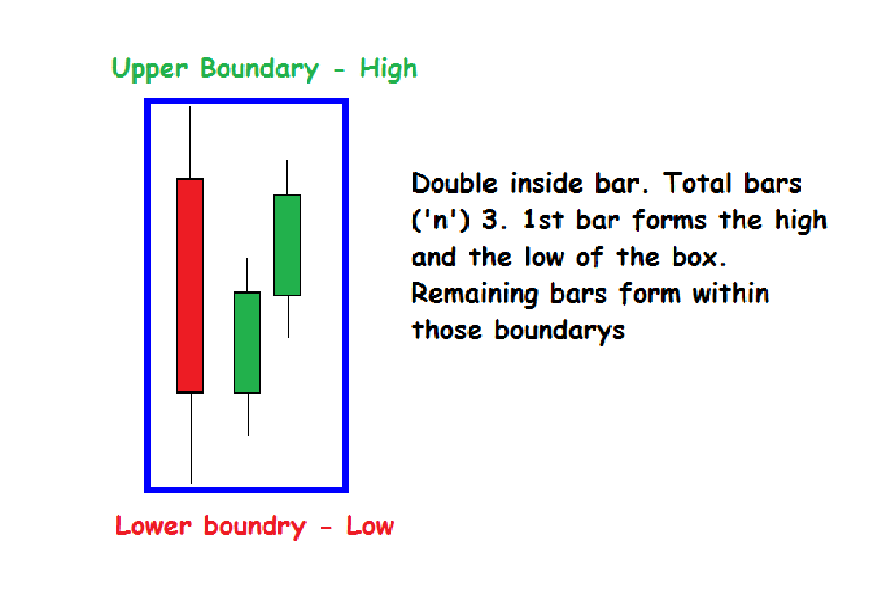
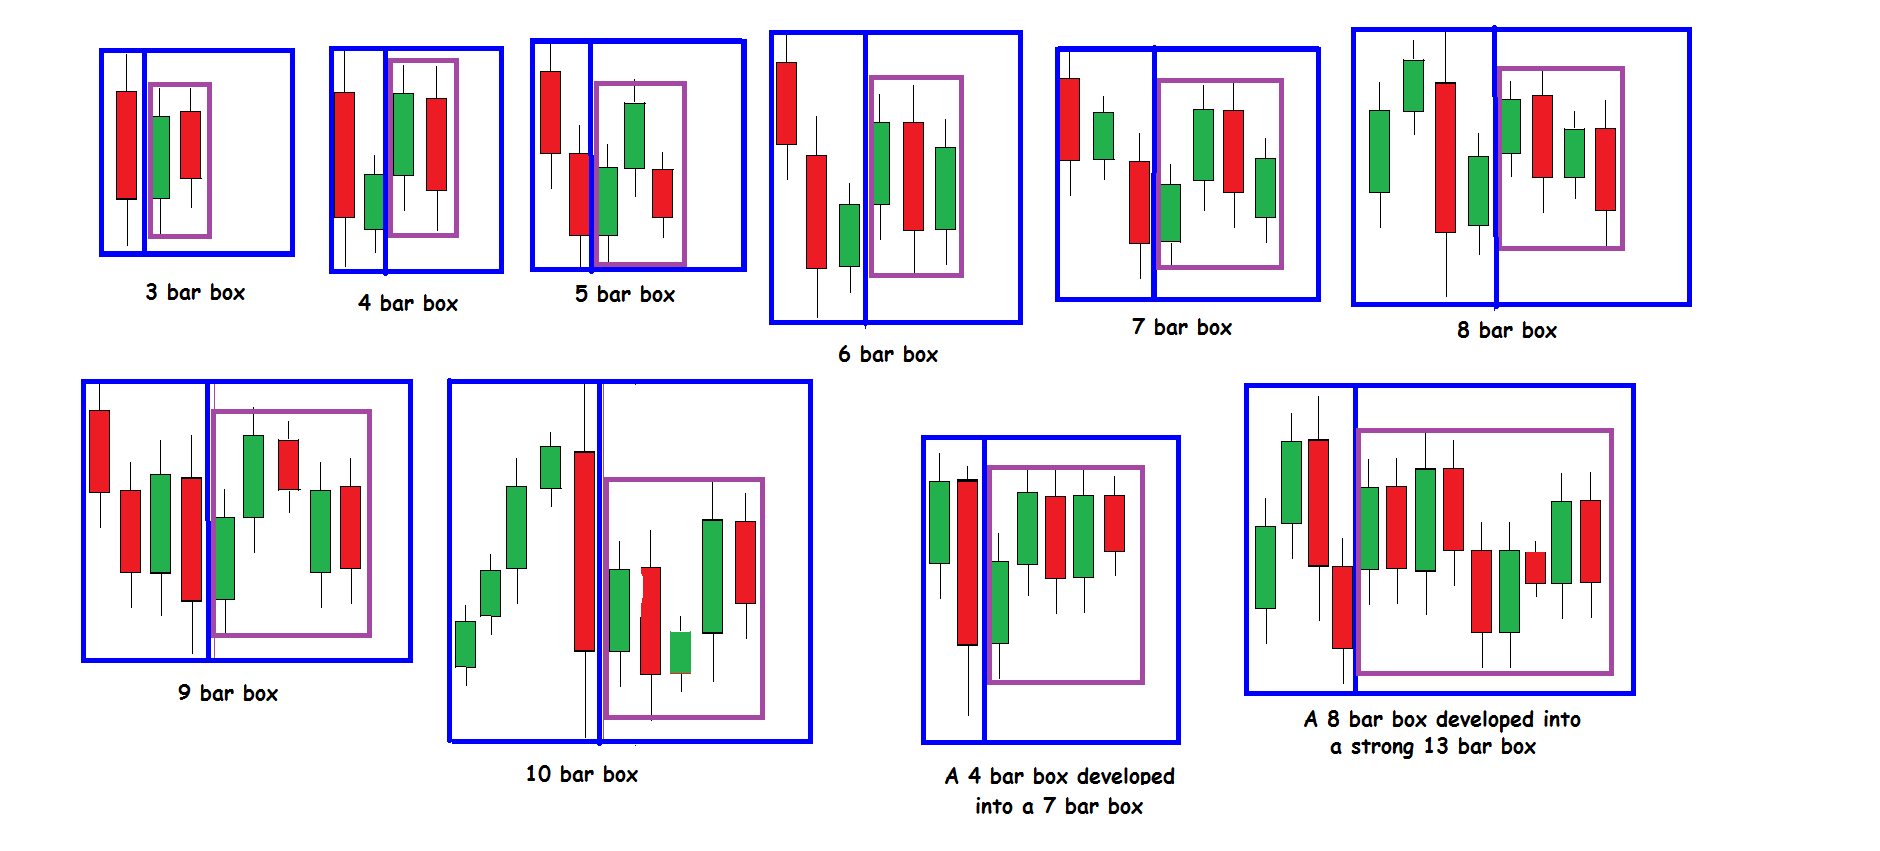
The upper boundary and lower boundary of the box is formed at the high and low of the first bar with the remaining two bars forming inside this range. This is the basic principle of a box pattern. The high and low which form the box's upper and lower boundary MUST occur in the first half of the box pattern with all other bars forming inside this range. Box patterns also repaint. Normally this is a bad thing in an indicator but not in the case for boxes. As long as the high and low of each bar stays inside the upper and lower boundary the pattern remains valid and becomes stronger. What we are detecting is a stalling in negotiations between buyers and sellers. The bigger in number of bars a box becomes the more tension builds and the stronger the breakout when it occurs, or at least that's the theory. The second component of the box then is range. The different in points between the upper and lower boundaries. Again this theory of watching negotiations stall should see a tight range in price form. The greater the number of bars the tighter the range the stronger more valid the pattern becomes. If the range is to great then volatility exists and that's bad for this system and the pattern fails. Here's some more examples,
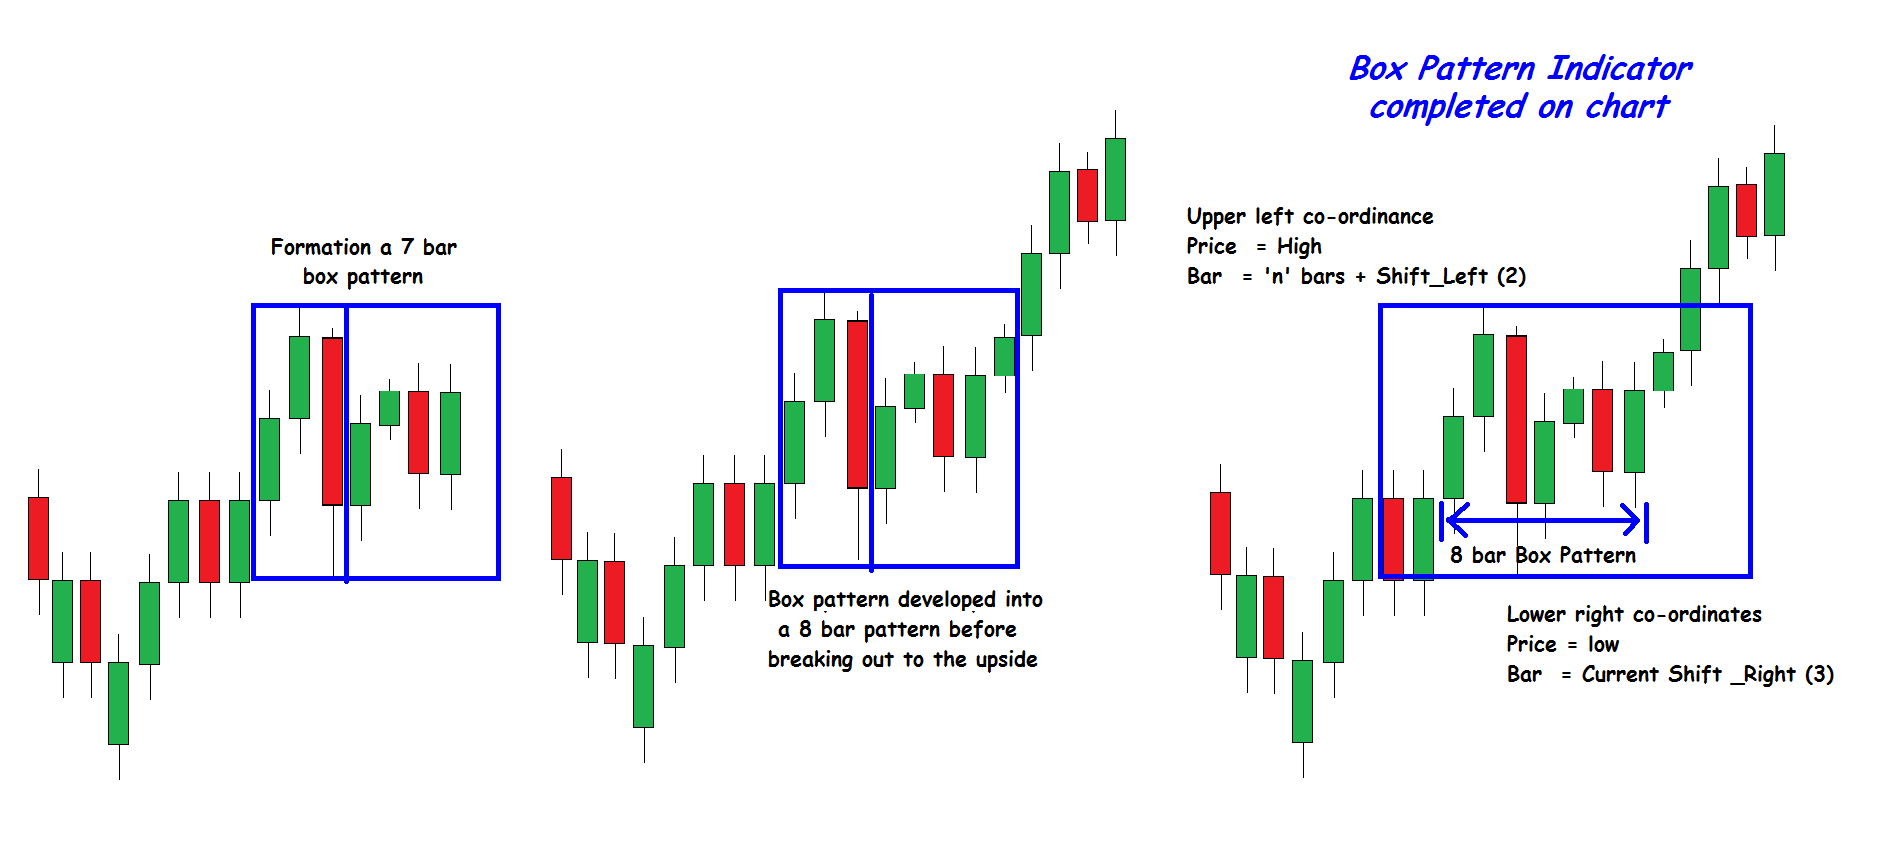
Here's a break down of a 7 bar box pattern

Parameters. The following parameters need to apply;
· Min_Bars - Minimum bars to form a box pattern is three. But that just depends on what timescale your operating in. A 3 bar box pattern on the 70 tick chart is exactly the same as a 6 bar box pattern on a 35 tick chart. The number of bars in a box pattern is referred to as "n". There is no maximum bars. The pattern immediately finishes the moment price breaks out of the box 's boundary.
· Range - Range in points. The difference in point valve between the high and low of the box. I normally operate at 34 points but that can vary from 20 to 40 points.
· Shift _Left - The number of bars prior to the start 'n' bar. Used to define box co-ordinates discussed below. We'll start with a value of 4.
· Shift_Right - The number of bars shifted forward from the current bar. Used to define box co-ordinates discussed below. Again we'll start with a value of 4.
Color - Color of box (rectangle).
The Indicator.
Is a rectangle drawn around the parameters of the box pattern once detected. I currently use an aqua color rectangle so that's as good as any to get started. The rectangle must repaint as a box pattern develops. As said earlier once a pattern has formed it remains valid for as long as each and every consecutive bar forms within the upper and lower boundaries. The pattern becomes void immediately the price breaks one of these levels and that should become the final pattern. The upper left co-ordinates of the box shall be "price" as the high (upper boundary) of the box x 'bars' being 'n' bars plus Shift_Left. This helps identify in what direction price was moving before the pattern form. The lower right co-ordinates shall be 'price' as the low (lower boundary) of the box x 'bars' being the current bar Shift_Right. This allows for the easy identification of the breakout.
The second indicator is a spread indicator. We'll call this one "Bobs Liquidity Indicator" . It will be in the form of a histogram and in a separate window. As the name suggest the valve of each bar shall be the current spread expressed as points each and every tick. The color of each bar will dependent on what cause the value of the spread to change.
If the spread decreased because the bid priced increased it should be green. If the ask price decreased it should be red. If both the bid and ask price moved simultaneously the price with the dominate valve shall be treated as the moved price.
If the spread increased because the bid price decreased the color shall be light green and if because the ask price increased it shall be tomato. Again if both prices move simultaneously the price with the dominate valve shall be deemed to have increased the spread.
To most this won't mean much but because I'm working of fast moving tick charts I need some way to try and gauge what buyers and sellers are doing in the here and now. Spread decreases around times of liquidity which offers the best opportunities for me. As as buyer/selers come into the market spread decreases and as they leave it increases. These box patterns work best in a highly liquid market with low volatility.
The third indicator is also a spread indicator. We''l call this one "Bobs Volatility Indicator". This time we're not interested in its valve each and every tick, simple the value at the close of each bar. The second indicator will be very fast moving maybe only showing history for the past few minutes. For a greater view of market volatility over the visible chart can only occur at the close of each bar. Again won't be much good to anyone not working with fast tick charts but to me paints a very important visual picture of the markets. For a start point the color of the histogram can be blue and the value is spread, close of bar, expressed as points. Again this time we are not interested in why the price of the spread changed, just its value at close of bar.
Again and I can't stress enough, I work on fast moving tick charts generated on off-line. These indicators must work on a off-line chart. Also the plan is to be able to build a bot in the future to trade this for me. Things happen very very fast at this level. A bot would be far better placed to make the decisions needed than me the human trader. The valves calculated by these indicators need to be able to be referenced by a bot.He who hesitates at this level loses. Look forward to your responses and discussion on my needs. A glory-es week-end to you all.