Tarea técnica
I wanted indicator for Meta trader 5:
XAUUSD M15
XAUUSD M15
I need an indicator that plots trend lines. These lines should identify possible tops and bottoms following my reasoning below.
Very important: This indicator needs a 4 parameter input for me to test at different ranges, for example, the zig zag indicator, if you increase or decrease the depth it shows different results
In my case it will be in relation to points and candle intervals
These inputs will be:
Ranges
Line alignment
Line extension deadline
Graphical record history of at least 30 days, looking at the M15 period
In my case it will be in relation to points and candle intervals
These inputs will be:
Ranges
Line alignment
Line extension deadline
Graphical record history of at least 30 days, looking at the M15 period
Simplified Logic:
Identification of the First Top:
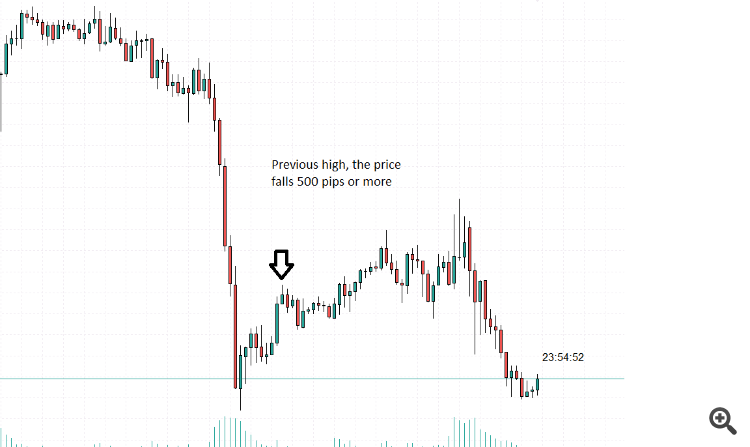
The price needs to fall at least 500 points from a previous high, in a range of at least 3 candles.
The price needs to surpass the previous high by at least 100 points.
Line Drawing:
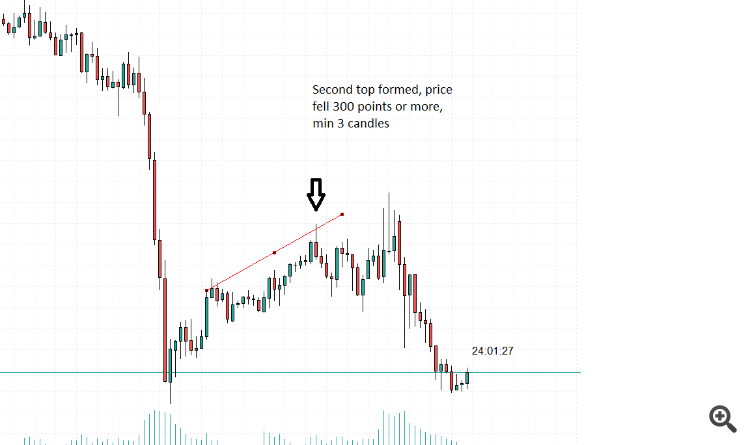
Draw a line connecting the highs of the two tops.
Extend the line by 3 candles ahead in the future.
Line Fixation:
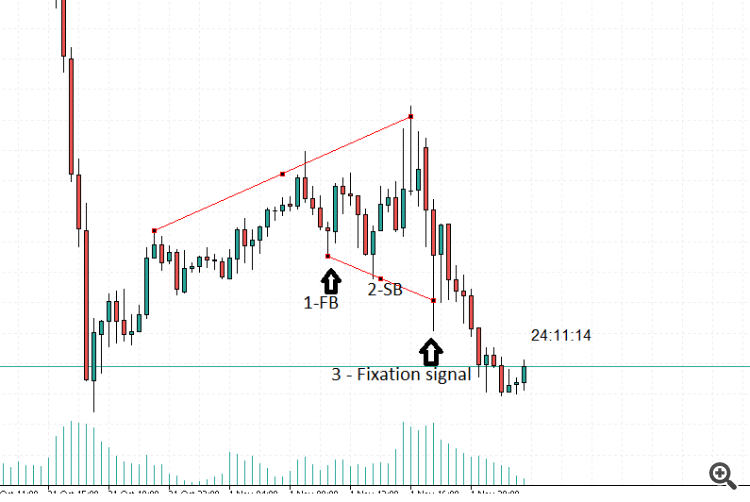
the inclination should be like this < most of the time. See the prints to better understand what it should look like
Very important: I will need an input that moves the lines uniformly in relation to the lows and highs, example: If I want to leave the line aligned exactly with the lows or highs I leave this configured in the input, as well as if I If you want to leave a difference in points, for example 10 points, it should be like this image:


Very important: input to limit line extension, after the second top or bottom is formed, the line will extend 3 candles ahead of the future, this line must expire within a period of number of candles.
I need a competent professional, and the second time I try
Han respondido
1
Evaluación
Proyectos
428
38%
Arbitraje
87
44%
/
18%
Caducado
71
17%
Ocupado
2
Evaluación
Proyectos
0
0%
Arbitraje
0
Caducado
0
Libre
Solicitudes similares
Terms of Reference for Indicator Development 1. Objective To develop a signal indicator for binary options in MQL4 or MQL5 that identifies entry and exit points on the chart based on market trends and patterns shown in the videos on the Trendify Binary Options YouTube channel . This channel provides practical examples of the expected behavior and functionality of the indicator. 2. Main References The primary
Desenvolver um indicador para mercado de futuros
50 - 200 USD
Tenho 2 estratégias que hoje tenho um indicador em que recebo seu sinal de compra/venda. Quero integrar a IA em Python para aumentar a probabilidade de assertividade dos setups. Coletar e Preparar Dados Históricos Preços (abertura, fechamento, alta, baixa). Indicadores técnicos (médias móveis, RSI, MACD, etc.). Variáveis do setup (por exemplo, valores de indicadores no momento de abertura de uma posição). Eventos de
OLÁ. EU PRECISO CRIAR UM ROBO PARA TRABALHAR COM OS DADOS HISTORICOS NO MT5, ELE DEVE PEGAR OS TICKS, DADOS DE UM DIA ESPECIFICADO, COM HORA E MINUTO. E SIMULAR A ABERTURA DE UMA ORDEM PENDENTE PARA ME INFORMAR SE OUVE SLIPPAGE E QUAL FOI O VALOR EM PIPS DA SLIPPAGE NAQUELA DATA, MINUTO E SEGUNDO ESPECIFICADO. APENAS ISSO. QUERO TRABALHAR COM DADOS PASSADOS (HISTORICOS)
PLANILHA QUANTICA PARA MERCADO FINANCEIRO
30 - 200 USD
Planilha quantica para daytrade mini índice e dólar, e forex para rodar no mt5. Colher informações de comprados e vendidos por BANCOS, ESTRANGEIROS E CPFs, COLHER INFORMAÇÕES SOBRE AS 10 MAIORES AÇÕES BOVESPA NO MOMENTO, PROJEÇÕES DO MINI INDICE E DÓLAR, PORCENTAGEM DE VENDIDOS E COMPRADOS NO MOMENTO, SINAL DE ALERTA EM TELA PARA COMPRA OU VENDA EM DETERMINADO PREÇO ESTIPULADO PELAS INFORMAÇÕES DA PLANILHA. A tela de
STRATEGY DEFINITION: This setup is based on the volatility of the "X" minute chart, combining the alignment of averages from different timeframes! It considers the alignment of the averages for the continuity of direction, providing excellent movements. TRADE DYNAMICS TYPE OF AVERAGES: EXPONENTIAL. TIMEFRAME: 1 MINUTE TRADE DYNAMICS: WHEN THE "A" EXP MOVING AVERAGE OF "X" MINUTES + "B" EXP OF "X" MINUTES + "C" EXP
Información sobre el proyecto
Presupuesto
30 - 50 USD
Plazo límite de ejecución
de 10 a 30 día(s)
Cliente
Encargos realizados2
Número de arbitrajes1


