Tarea técnica
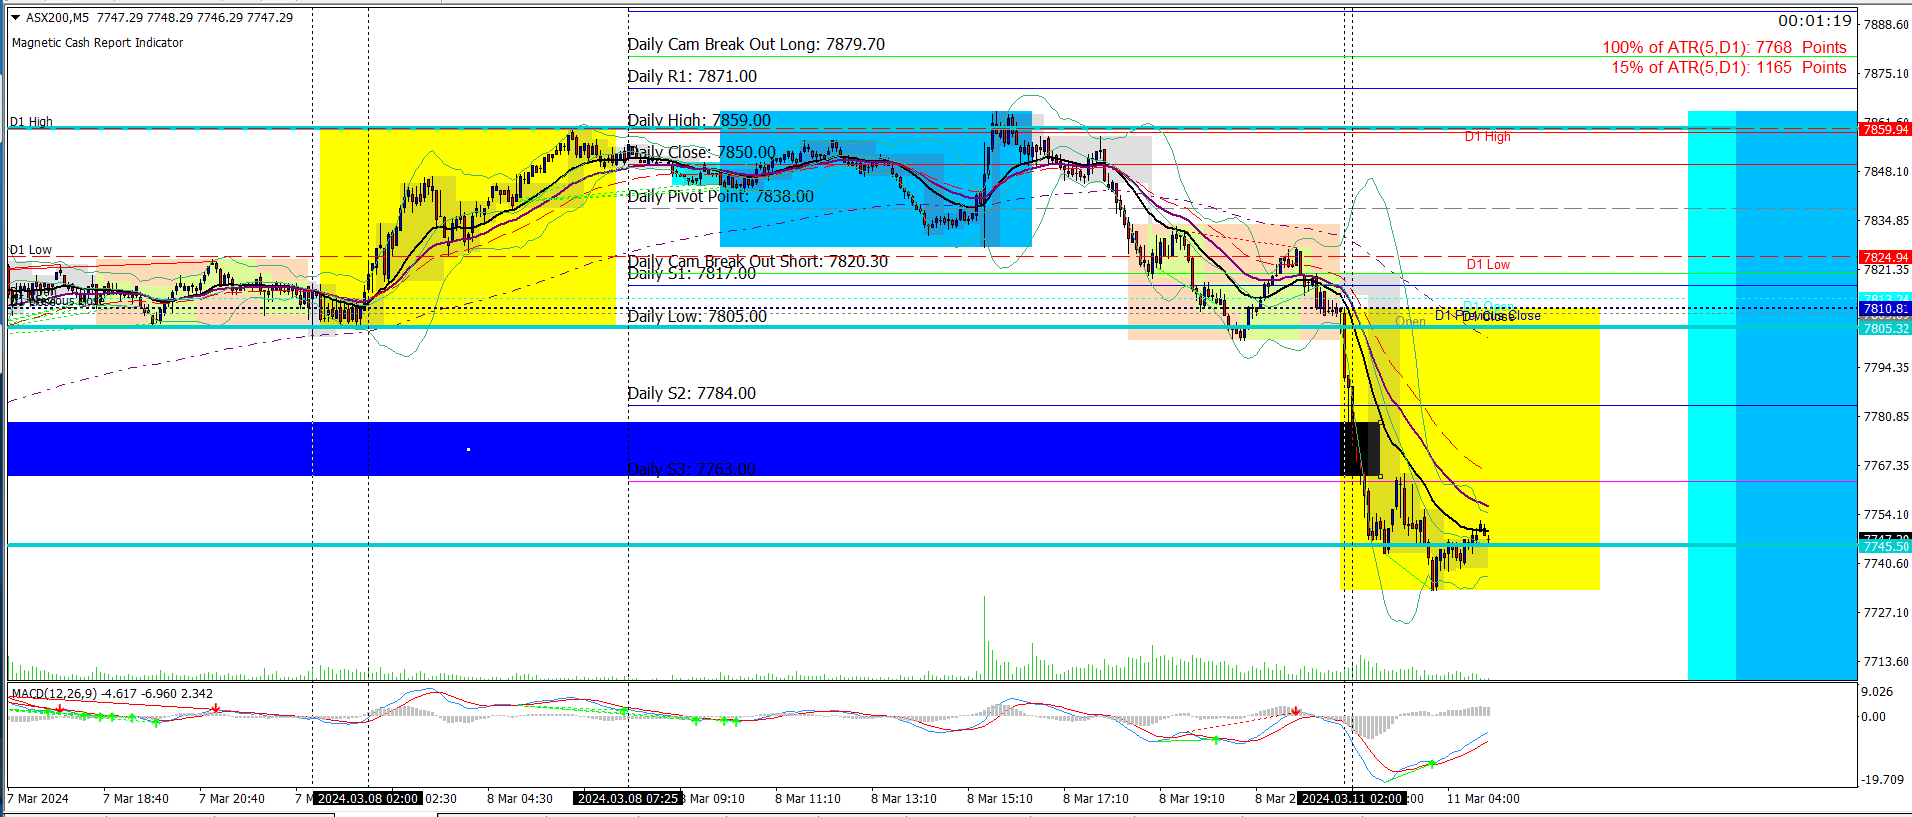
I need a pivot indicator showing the standard levels R1 to R3 and the camarillo level breakout long and short R4
id like the indicator to work out the levels based on the cash chart times .. i use on indexes . so id like to input the times to work out the levels ie cash open at 8:00 close at 4:30
but this can be different on different brokers time so this i why i want to inmut the time period so it can be Auto populated from then .
the standard formula of SUM( high +low+close ) /3 and for cam levels SUM(high-low)*1.1/2+close.
I want to be able to sell or buy at x% of the 5day ATR move past the R3 /S3 level and the CAM brkout long or short levels .
2.
I need an indicator which will find high probability gaps
1. show how many up or down days it s been prior to the gap forming
2. 2 types of gap a extreame gap = a move higher or lower than the high or low of the previous day which i want highlighted once a gap is forming ie and left highlighted until the gap closes during the cash hours which could take 1-any no. of days .
3. second type of gap is standard gap ie any open the next day higher or lower than the close of yesterday .highlighted until closed during cash hours input Time from x time to y time .
4 i need an alert and function to buy or sell towards or away from the gap at x points ie if were 50pips past gap and gap hasn't closed in cash hours i want to sell towards the gap expecting it to fill .
or if a gap forms and we are 10pips away from the gap i want to buy expecting gap not to fill.
5 . i need an alert if we have a double or tripple gap ie we have opened above the high or low 2 or 3 days in a row without filling the gap during alocated time period ie cash hours .
i can send some pictures of what it looks like .
finally i need an alert if we are opening above yesterdays close or high /low and have had 3 or more up/down days and are between camarillo breakout levels R1 and S1