Mira cómo encargar de forma rápida un robot comercial
Lea las reglas antes de empezar el trabajo
Cómo encargar un robot comercial en MQL5 y MQL4
Mire el ejemplo de Tarea Técnica para encargar un robot
Nuevas solicitudes en la categoría:
30+ USD
30+ USD
30 - 60 USD
30 - 50 USD
Trabajo finalizado
Plazo de ejecución 17 días
Comentario del Ejecutor
He is always online but refused to reply to chat so as not to pay for the job and get Ea for free. That is very bad of him
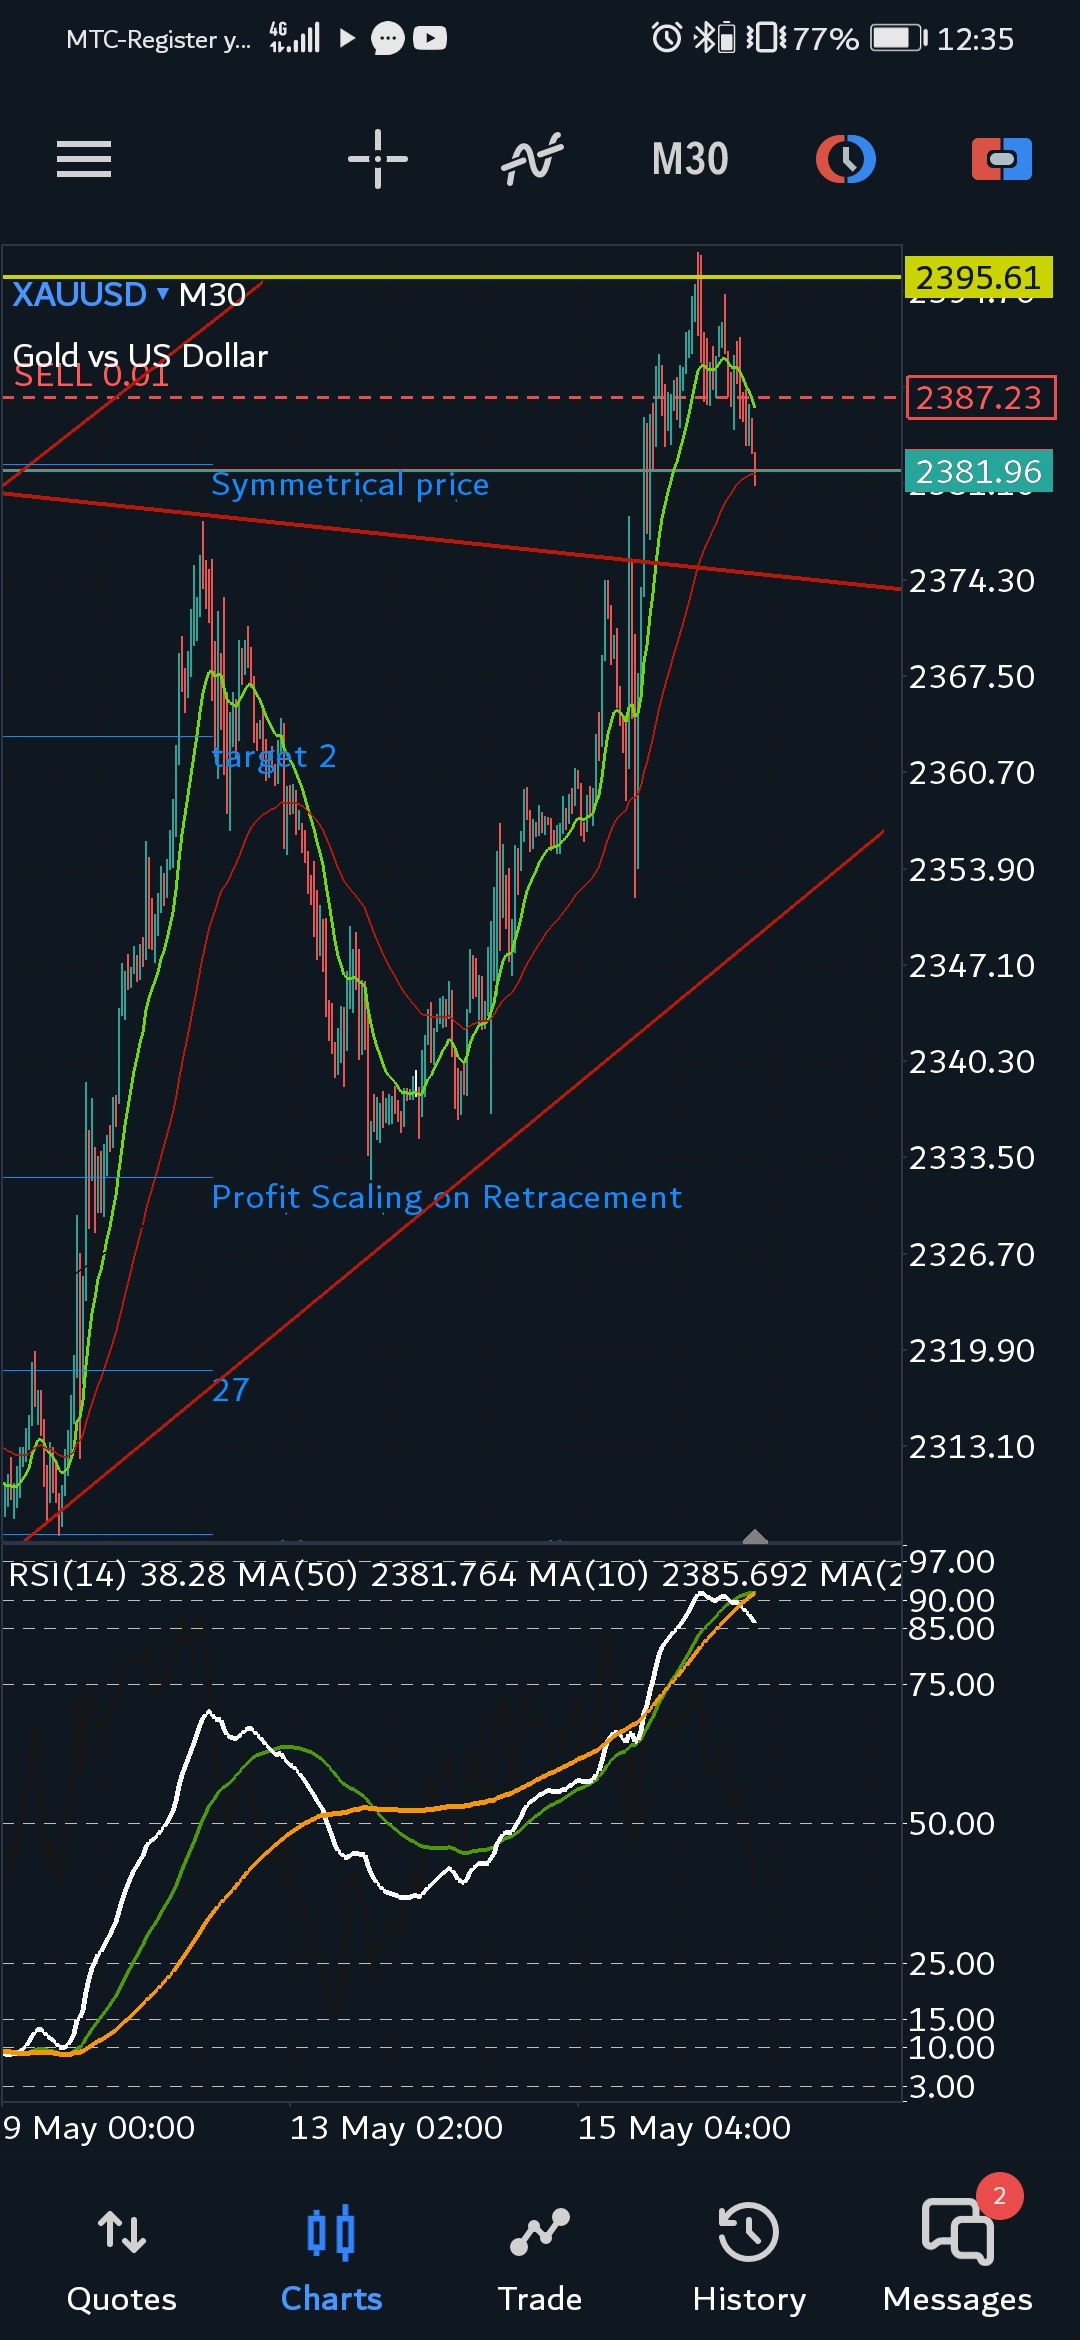
Tarea técnica
In the Relative Strength Index(RSI) there will be levels 80 overbought and 20 over sold.. I want this two moving averages(MA) (period: 10, method: exponential,apply to: close )and(period: 200, method: exponential,apply to: close ) in the RSI box.. If the MA 10 reaches overbought area level 80 in the RSI and crosses below MA 200 in the overbought level 80.. can be applied to all timeframes.. a automated sell order is triggered instantly, else if the MA 10 reaches level 85 in the overbought area sell limit pending order is/are set automatically
Han respondido
1
Evaluación
Proyectos
3
0%
Arbitraje
0
Caducado
0
Trabaja
2
Evaluación
Proyectos
73
15%
Arbitraje
3
33%
/
33%
Caducado
7
10%
Trabajando
3
Evaluación
Proyectos
62
8%
Arbitraje
12
58%
/
42%
Caducado
1
2%
Libre
4
Evaluación
Proyectos
1432
62%
Arbitraje
21
57%
/
10%
Caducado
43
3%
Libre
5
Evaluación
Proyectos
440
26%
Arbitraje
125
21%
/
57%
Caducado
96
22%
Trabaja
6
Evaluación
Proyectos
226
22%
Arbitraje
15
60%
/
20%
Caducado
1
0%
Trabajando
7
Evaluación
Proyectos
524
33%
Arbitraje
28
39%
/
43%
Caducado
7
1%
Ocupado
8
Evaluación
Proyectos
3057
66%
Arbitraje
77
48%
/
14%
Caducado
340
11%
Trabaja
9
Evaluación
Proyectos
22
14%
Arbitraje
0
Caducado
1
5%
Libre
10
Evaluación
Proyectos
416
38%
Arbitraje
86
44%
/
19%
Caducado
70
17%
Ocupado
11
Evaluación
Proyectos
186
73%
Arbitraje
4
100%
/
0%
Caducado
1
1%
Libre
12
Evaluación
Proyectos
88
14%
Arbitraje
30
30%
/
53%
Caducado
36
41%
Trabaja
Solicitudes similares
Pinescript to MQL5
100 - 200 USD
READ IT URGENT, i need to complete this job in 1-2 day so APPLY it only if can do it, if some requirement is not clear tell me, im here, please be careful, i need this in 1-2 days, if you are not sure, not apply it, i dont want leave BAD FEEDBACKS please
Hedging Grid Expert Advisor
50+ USD
Create hedging grid EA with my own logic. Add a Moving Avarage Filter. 2 engine with same logic. Sl TP by $ amount. Add Profit loss Dashboard Virtual all trade close Button
Expert Advisor based on Sweep of a Time Range
50 - 200 USD
Hi There, my name is Jordan and I’m based in Australia. I’m looking to get an EA developed through freelance work and I’ve outlined some rough details of the intended EA, which is a similar concept to an existing EA by Andrii Hurin called “Time Range Sweep EA”. There are quite a lot of similarities to the reference EA and these include: · Trade on any market and instrument or on several pairs at the same time
MT5 Arbitrage EA developer
50+ USD
Hello, Looking to create an arbitrage EA for MT5. The EA will run on two local MT5 instances (ex. 2 different accounts) and keep track of a certain pair price every 10 seconds. The EA will send data from instance #1 to instance #2 and vice versa. The EA will execute trades on the two accounts if a set of conditions are met. Apply if you have the experience and knowledge
I have an algo that is running on ProRealTime, they have their own language. It is a simple strategy with 5 conditions + SL/TP settings, very basic. I need someone that can convert or just create a functional MT5 algo (EA) from these conditions for me, if you do a good job I have around 10+ more algos that need to be transferred to MT5
Creating of an expert advisor or trading bot that uses a Top Down analysis (using monthly, weekly, daily, hourly, minutes ( 30, 15, 5, 1) to determine trade direction or trend direction and makes multiple trade decisions for mt4. You can use or combine accurate trend indicators. Posted earlier
A very simple request for backtesting trading signals in MT5 Strategy Tester from a csv file
30+ USD
Dear Developers, I would have a very simple request. I have a ML model developed in Python for EURUSD daily trading. I would like to backtest it in Meta Trader 5 using the Strategy Tester tool. For that I would need an Expert Advisor program. The input would be a csv file that contains two columns: - dates (going back for a few years on a daily basis) - trading signal (it can have only 2 values, either 1: Buy, or -1
Convert Existing Trading View Indicator to EA
30 - 33 USD
Good day i will need a developer to create an EA for me using existing trading view indicator .The EA will open after the indicator has given signal and will close if altenate signal comes.The trading view indicator will be shared and improvement is welcome
Creating of an expert advisor or trading bot that uses a Top Down analysis (using monthly, weekly, daily, hourly, minutes ( 30, 15, 5, 1) to determine trade direction or trend direction and makes multiple trade decisions for mt4. You can use or combine accurate trend indicators
A trading bot or expert advisor
30+ USD
Creating of an expert advisor or trading bot that uses a Top Down analysis (using monthly, weekly, daily, hourly, minutes ( 30, 15, 5, 1) to determine trade direction or trend direction and makes multiple trade decisions for mt4. You can use or combine accurate trend indicators
Información sobre el proyecto
Presupuesto
30 - 60 USD
Para el ejecutor
27
- 54
USD
Plazo límite de ejecución
de 1 a 3 día(s)