Before anything the whole project revolves around the following
-candles patterns
-scanner indicator and a trading robot
-alerts linked to arrows (up\down)
-filters which can be applied to either the alerts, indicator’s dashboard, or trading robot.
Filters such as: candle size, skip nearing pattern filter,
___________________________________________________________________________________________
-The first step is to code and indicator that could detect all cases in file (all patterns) with attention to doji candles and divergence doji candles
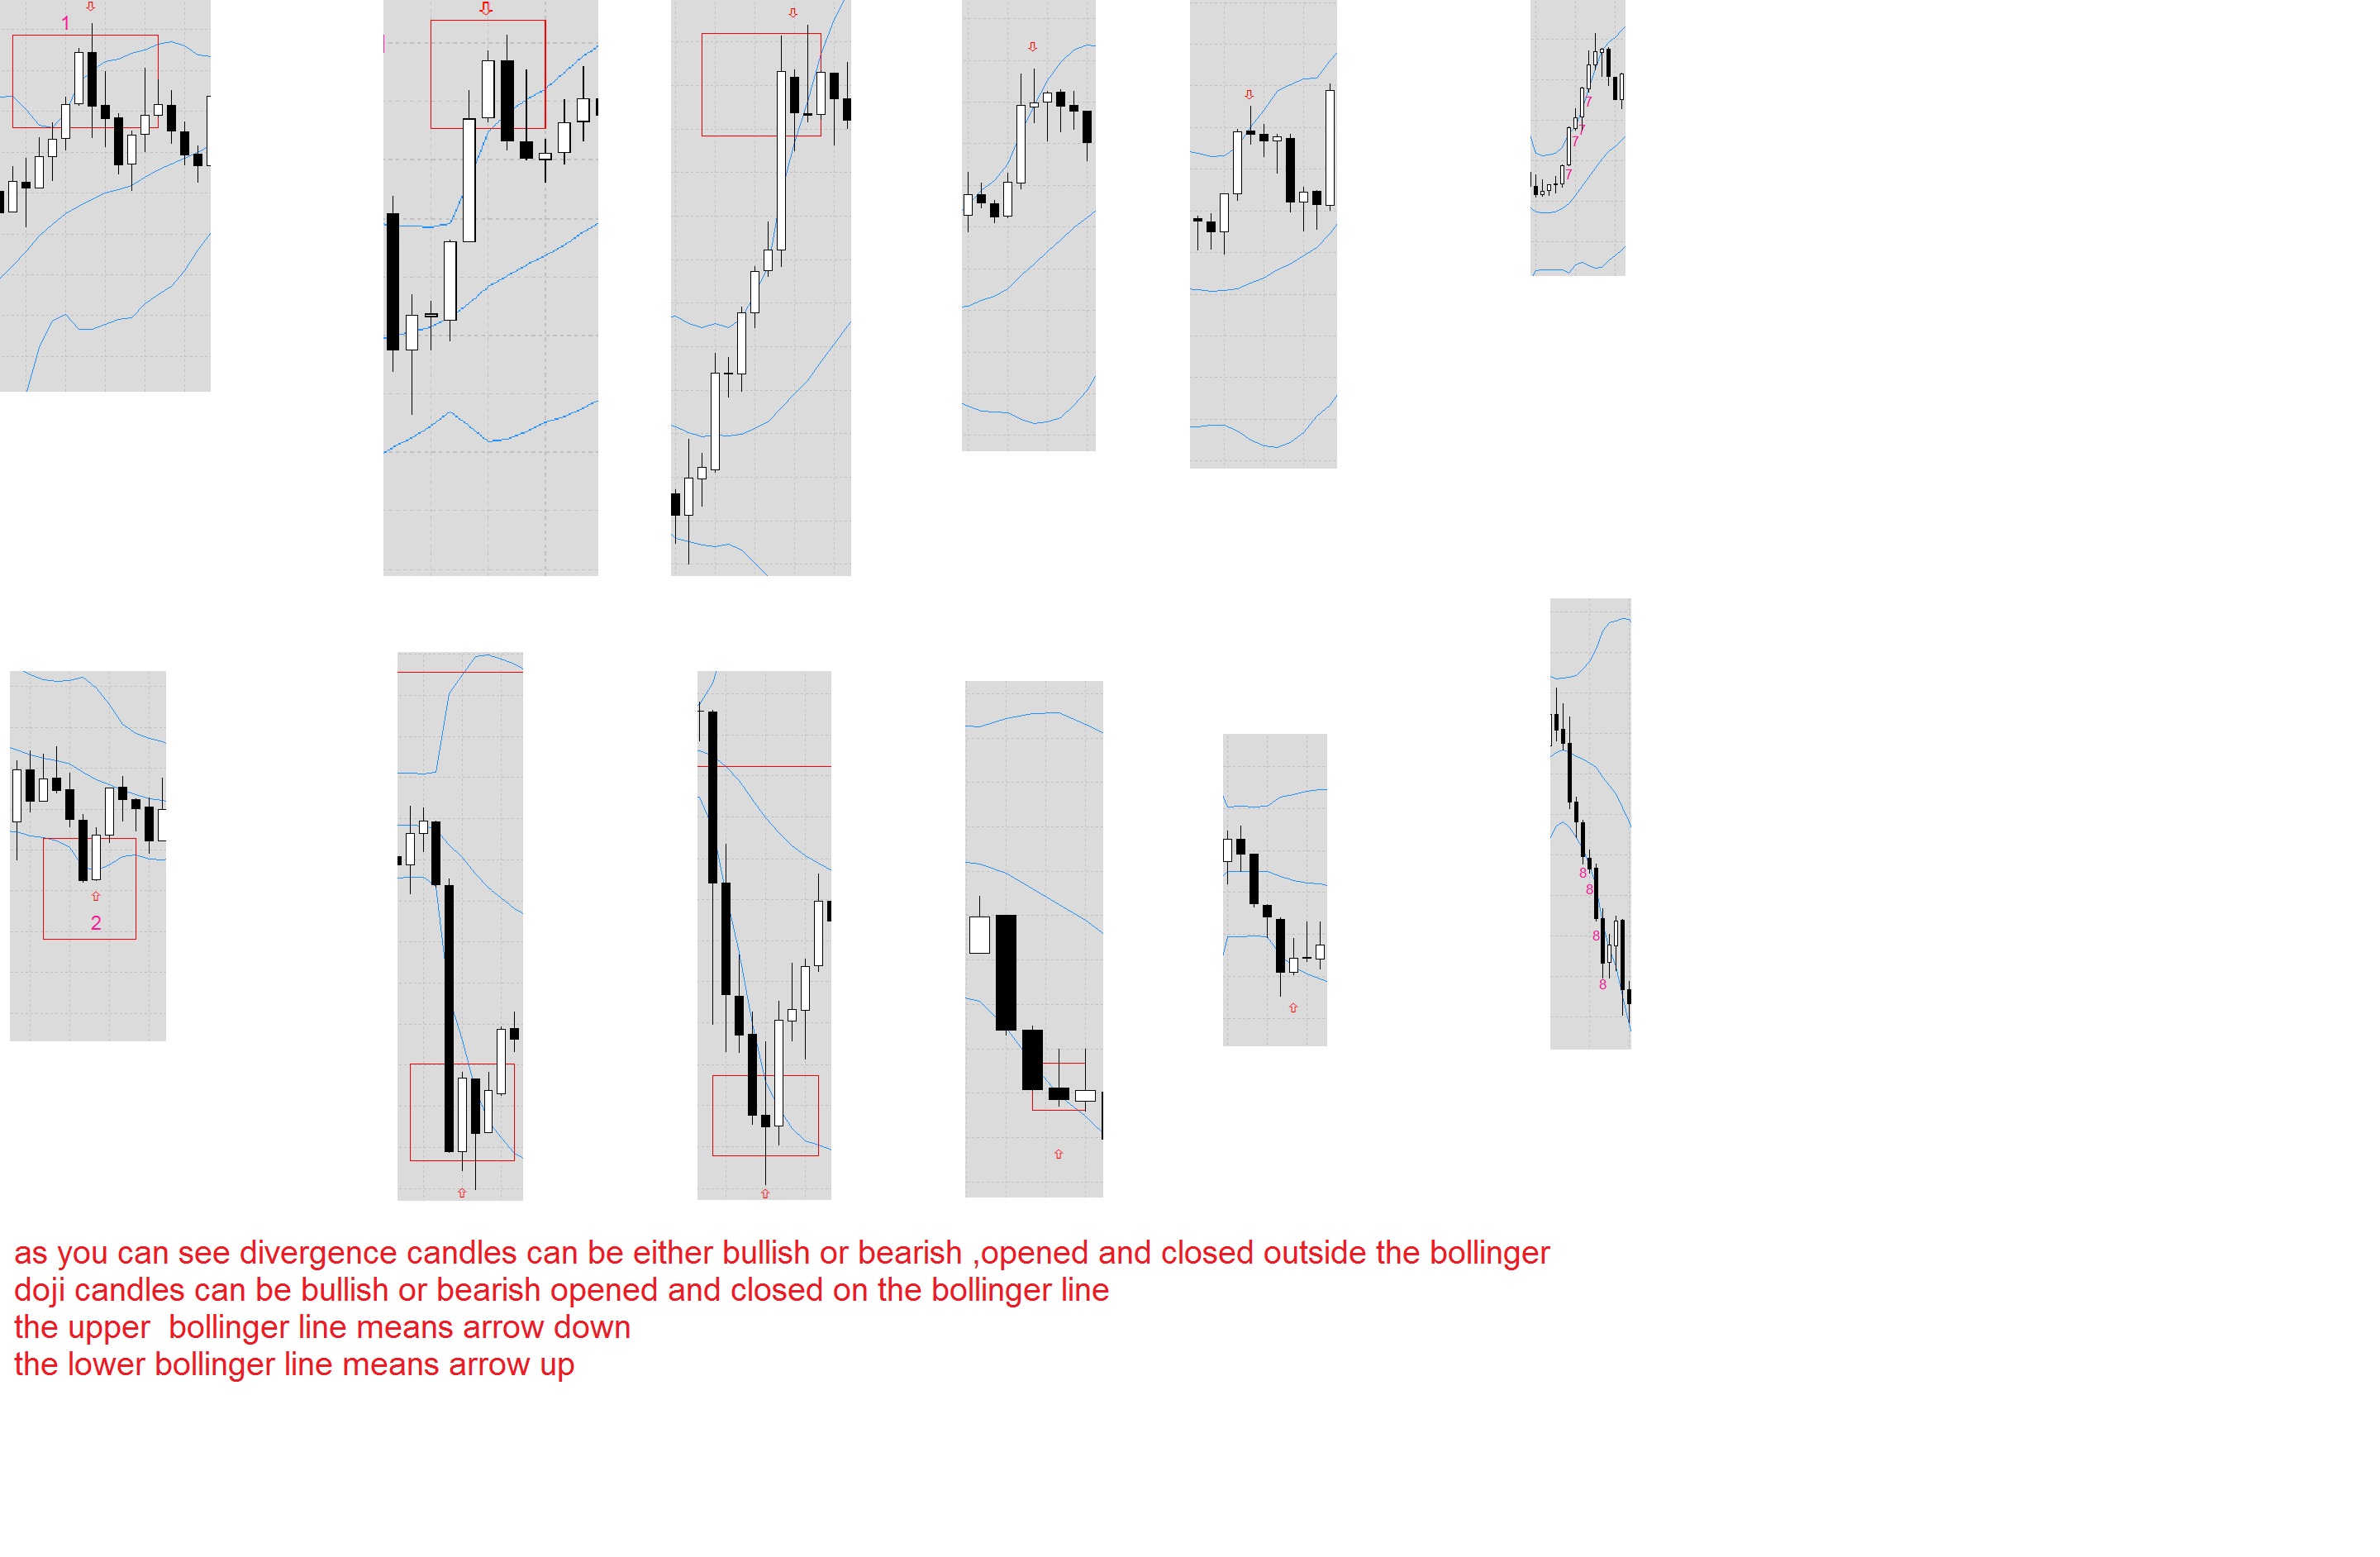
1-two candle formation ,bullish candle that open between middle and upper bollinger band but close outside the upper band followed by a bearish candle that open outside the upper band then close(inside) between upper and middle band
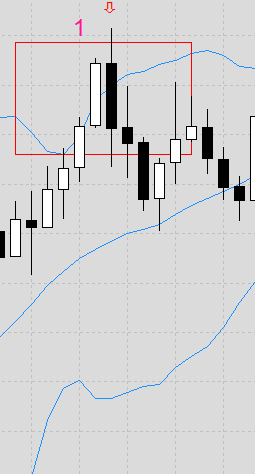
2-the complete opposite of pattern 1, bearish candle that open between middle and lower bollinger band but close outside the lower band followed by a bulish candle that open outside the lower band but close inside (between lower and middle band)
3-bullish (candles that open and close completely outside the upper band)
4-bullish (candles that open and close completely outside the lower band)
5-bearish (candles that open and close completely outside the upper band)
6-bearish (candles that open and close completely outside the lower band)
7-doji (bullish\bearish) candles that open and close outside (lower\upper band),note:candle wicks isn't relevant,and when candle size is applied these candles should be skipped
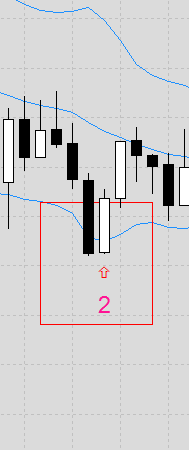
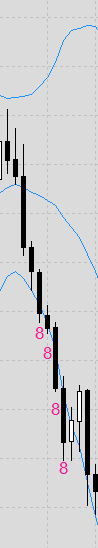
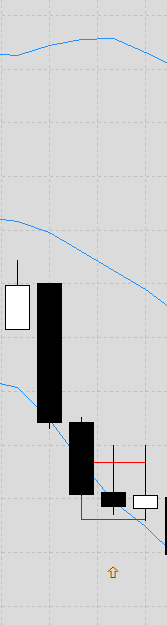
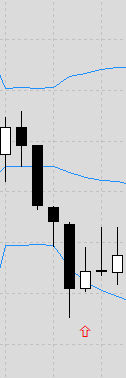
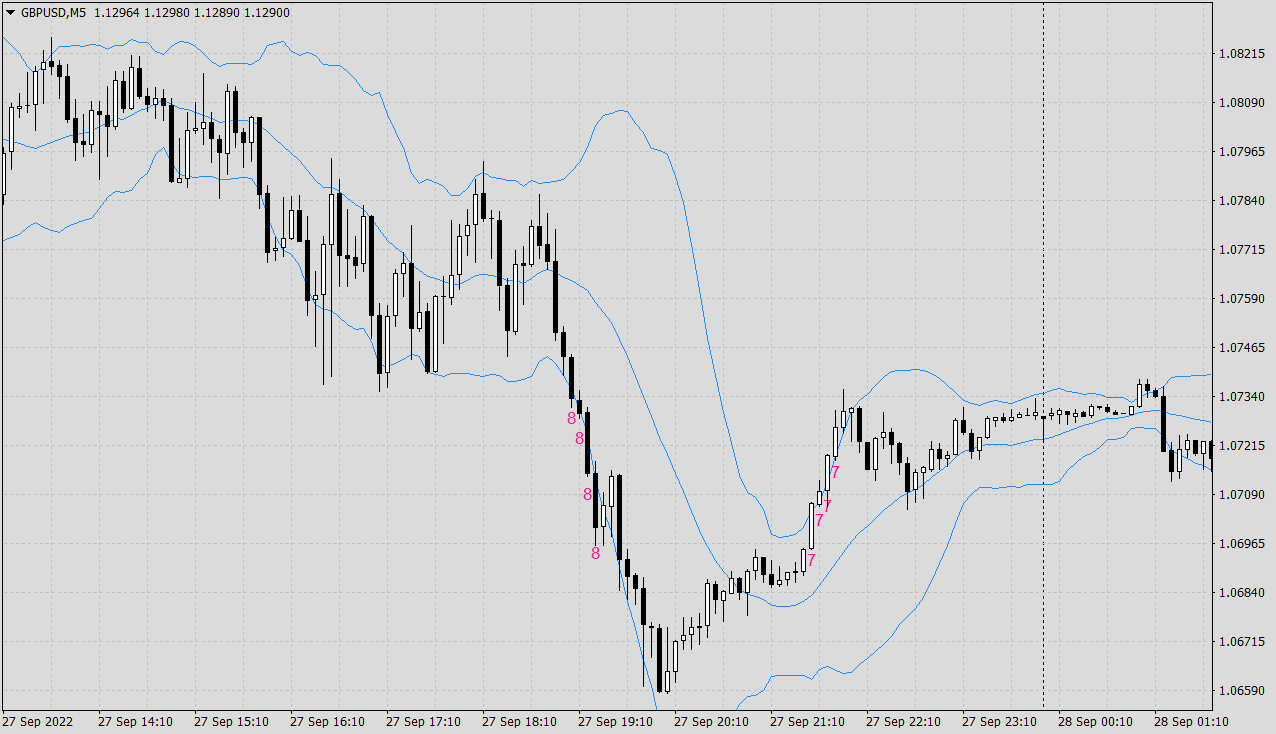
8-candles (usually small doji ones bullish or bearish on upper or lower band)but they open and close on the bollinger line review image 7,8,9,10 in (all patterns photo)
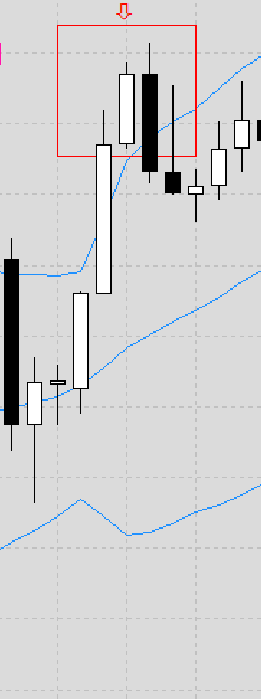
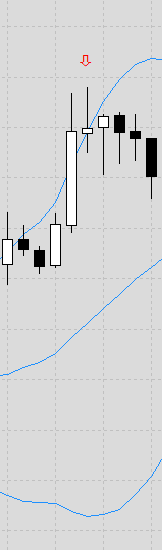
9-consecutive candles (bullish\bearish) (2,3,4,5,6) that break the bollinger with adjustable value in the setttings to be highlighted on the chart with and two opposing symbols you desire for bearish and bullish.
note:upper line is arrow down\sell signal
------- lower line is arrow up\buy signal
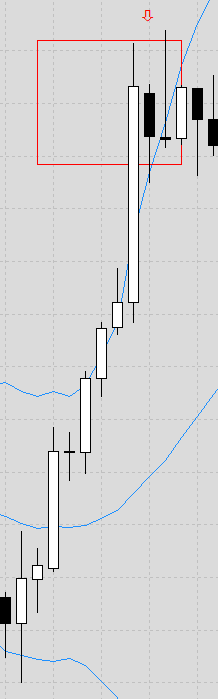
10-two candle formation similar to pattern 1 and 2 but the second candle is not necessarily opened outside the (upper/lower) band ,but rather close enough(opened and closed) to previous candle near (upper/lower band) (review photo 29)
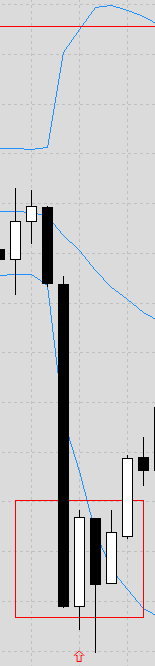
Case 11,12:is when consecutive candles pierce (lower\upper)bollinger line,with consecutive variable before detection input available ,example ,I want to highlight number(could be 2,3,4,5 of consecutive candles ,so that input should be vailable in the indicator and expert settings
Important note: please let me know if you could code the above mentioned patterns in the case of these patterns approaching the lower or upper bollinger line but without the other conditions being met ,example case 1+2 but regardless of opening and close outside or inside the (upper\lower) bollinger line ,same concept for divergence and doji candles ,and in that case we’d have extra other 12 patterns.
-No need to present the cases based on their category 12345678 just a simple red or green arrows
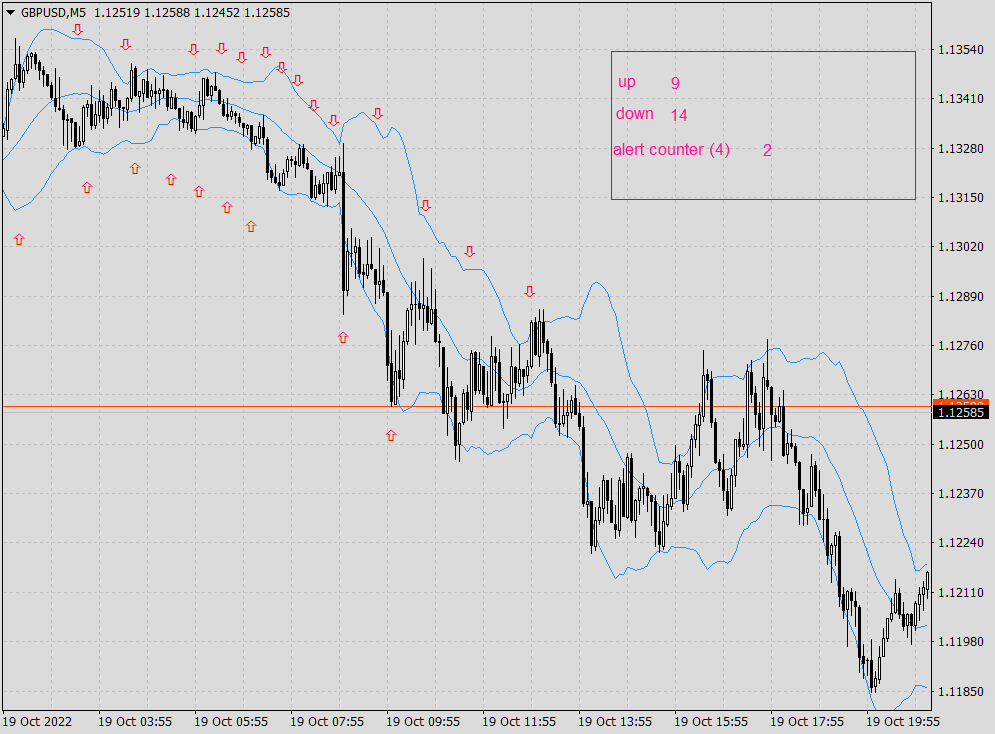
Dashboard should always present the number of arrow up cases, arrow down cases ,and the current detected cases dedicated for the alert review DB 1 photo
the dashboard is dedicated for showing how many cases up and down over a long extended period of time, previous (days,weeks,or number of candles)
Dashboard options, show only arrows down, show only arrows up, every time or number of candles
-Candle size filter is needed
-There should be (include\exclude) feature in the indicator\trading robot settings for every pattern mentioned above
Example :only detect and count bearish doji arrows (review all patterns)picture
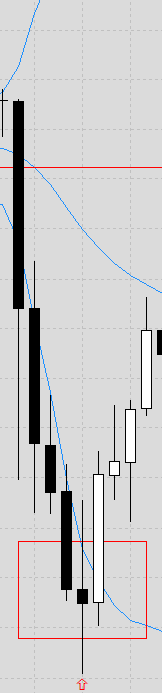
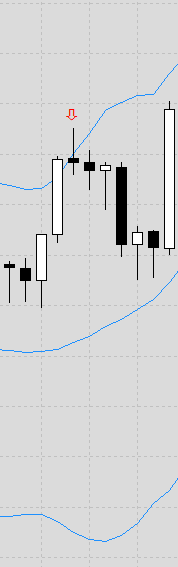
Note: some doji cases are close to the upper or lower Bollinger line but still doesn’t fall under any of the 12 cases ,also I want the robot to detect divergence candles outside the Bollinger even if they’re doji candles, if you don’t know what I’m talking about you can ask me for a picture .
arrow up cases with green arrow up graph on the chart
arrow down cases with red arrow down graph on the chart
______________________________________________________________________________________________________
alert section: the alert is supposed to take in consideration ,(time,cases detected up\down)
the alert should be conditional ,if N=number of arrows
-N of arrows up detected
-N of arrows down detected
-N of arrows up+down detected but last detected is down
-N of arrows up+down detected but last detected one is up
-N of arrows up+down detected regardless of last detected case being up or down Counter of the alert started after the previous reset ,example an alert goes after detecting 13 cases up then reset to zero in the dashboard and the chart should highlight where the alert went on the last pattern that triggered the alert
-an alert whenever two or three or four consecutive candles appear on the chart (candle size filter applied)on any the chosen candle period (hours ,days)on\off feature
***note:the dashboard should always present the overall number of arrows up and arrows down from the chart
***note: the chart should always show arows (green or red) even if the alert is off on that case
and the location on which recent case the alert occurred when the alert was triggered
Candle size filter, to choose the size of the candle that fits the above description to be considered for indicator calculation, for example only candles that are >20 pip or > 40 pips
first step is to design an indicator that could detect and highlight the 12 cases mentioned in the post
-----------------------------------------------------------------------------------------------
on the chart i want the bearish cases highlighted in red arrows above the candles and green arrows below
the bullish cases, as for the last two cases marked (777,888)to be highlighted in a certain small graph, (review all patterns picture)
-every number(period of time or candles) in the indicator settings should be adjustable
-every period of time should be adjustable
-every filter should have on and off switch for it
-the dashboard must show how many cases the alert have detected so far,and how many bullish and bearish cases appeared on the chart
you could also design a dashboard for multiple timeframe (M5,M15,H1,H4)for previous or upcoming patterns on the same chart
even if the indicator\EA\dashboard is running on one time frame,example ,4 boxes one for current M5 and the three others for same setups on other time frames(M15,H1,H4)
so that's 4 boxes or you can combine them all in one dashboard it's up to you cause graphics don't matter as long as they're clear
---------------------------------------------------------------------------
alerts should be triggered if
1-combination of both bullish and bearish cases detected (with settings to choose how many for reset and alert)
2-after (number) of bullish arrows
3-after (number) of bearish arrows
4-to reset the counter dashboard after a passage of the chosen period of time, example,reset the counter after one day (24 hours=288 M5 candles)
example 24 hours passed and 12 cases detected if both time and number of cases are conditions for the alert