Trabajo finalizado
Tarea técnica
I'd like to create an MT5 indicator that highlights Break of Market Structure... e.g. HL HH LL LH. There are some additional features I like to have so that it creates alerts and label the Break of structure Strong or weak depending on if the wick of the candle (High/Low) breaks the structure or if the candle closes above/below. I can specify details if you agree to work with me on this indicator.
Also key is that I'll need the MQL source code as I want to build a EA system by combining this with other confluences (I already have developed these myself).
Please let me know if you are interested and we can take it from there.
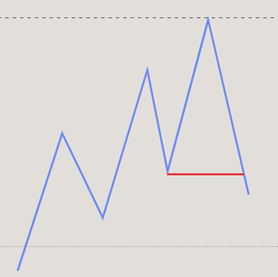
A simplified diagram below:
This is just a start and I need someone committed and very experienced on structure/candles/supply&demand concepts as I'd like to engage with you on a complex project
I've had a few query from potential developers suggesting the use of Zigzag. While I've considered this, please bear in mind the following tahat are unique to my requirements:
- the break of structure is considered if the wick breaks the previous high/low even by a few pippets (this parameter to be defined) so that the indicator can detect doube top or double bottom
- the previous high, low is traversed back through the candles (lets say 5000 - gain configurable)
- if the the current candle breaks the high or low of the previous candle (and is the opposite colour) *and* is higher/lower than the previous structural high/low, then you need to use that as a break of structure.
example below:
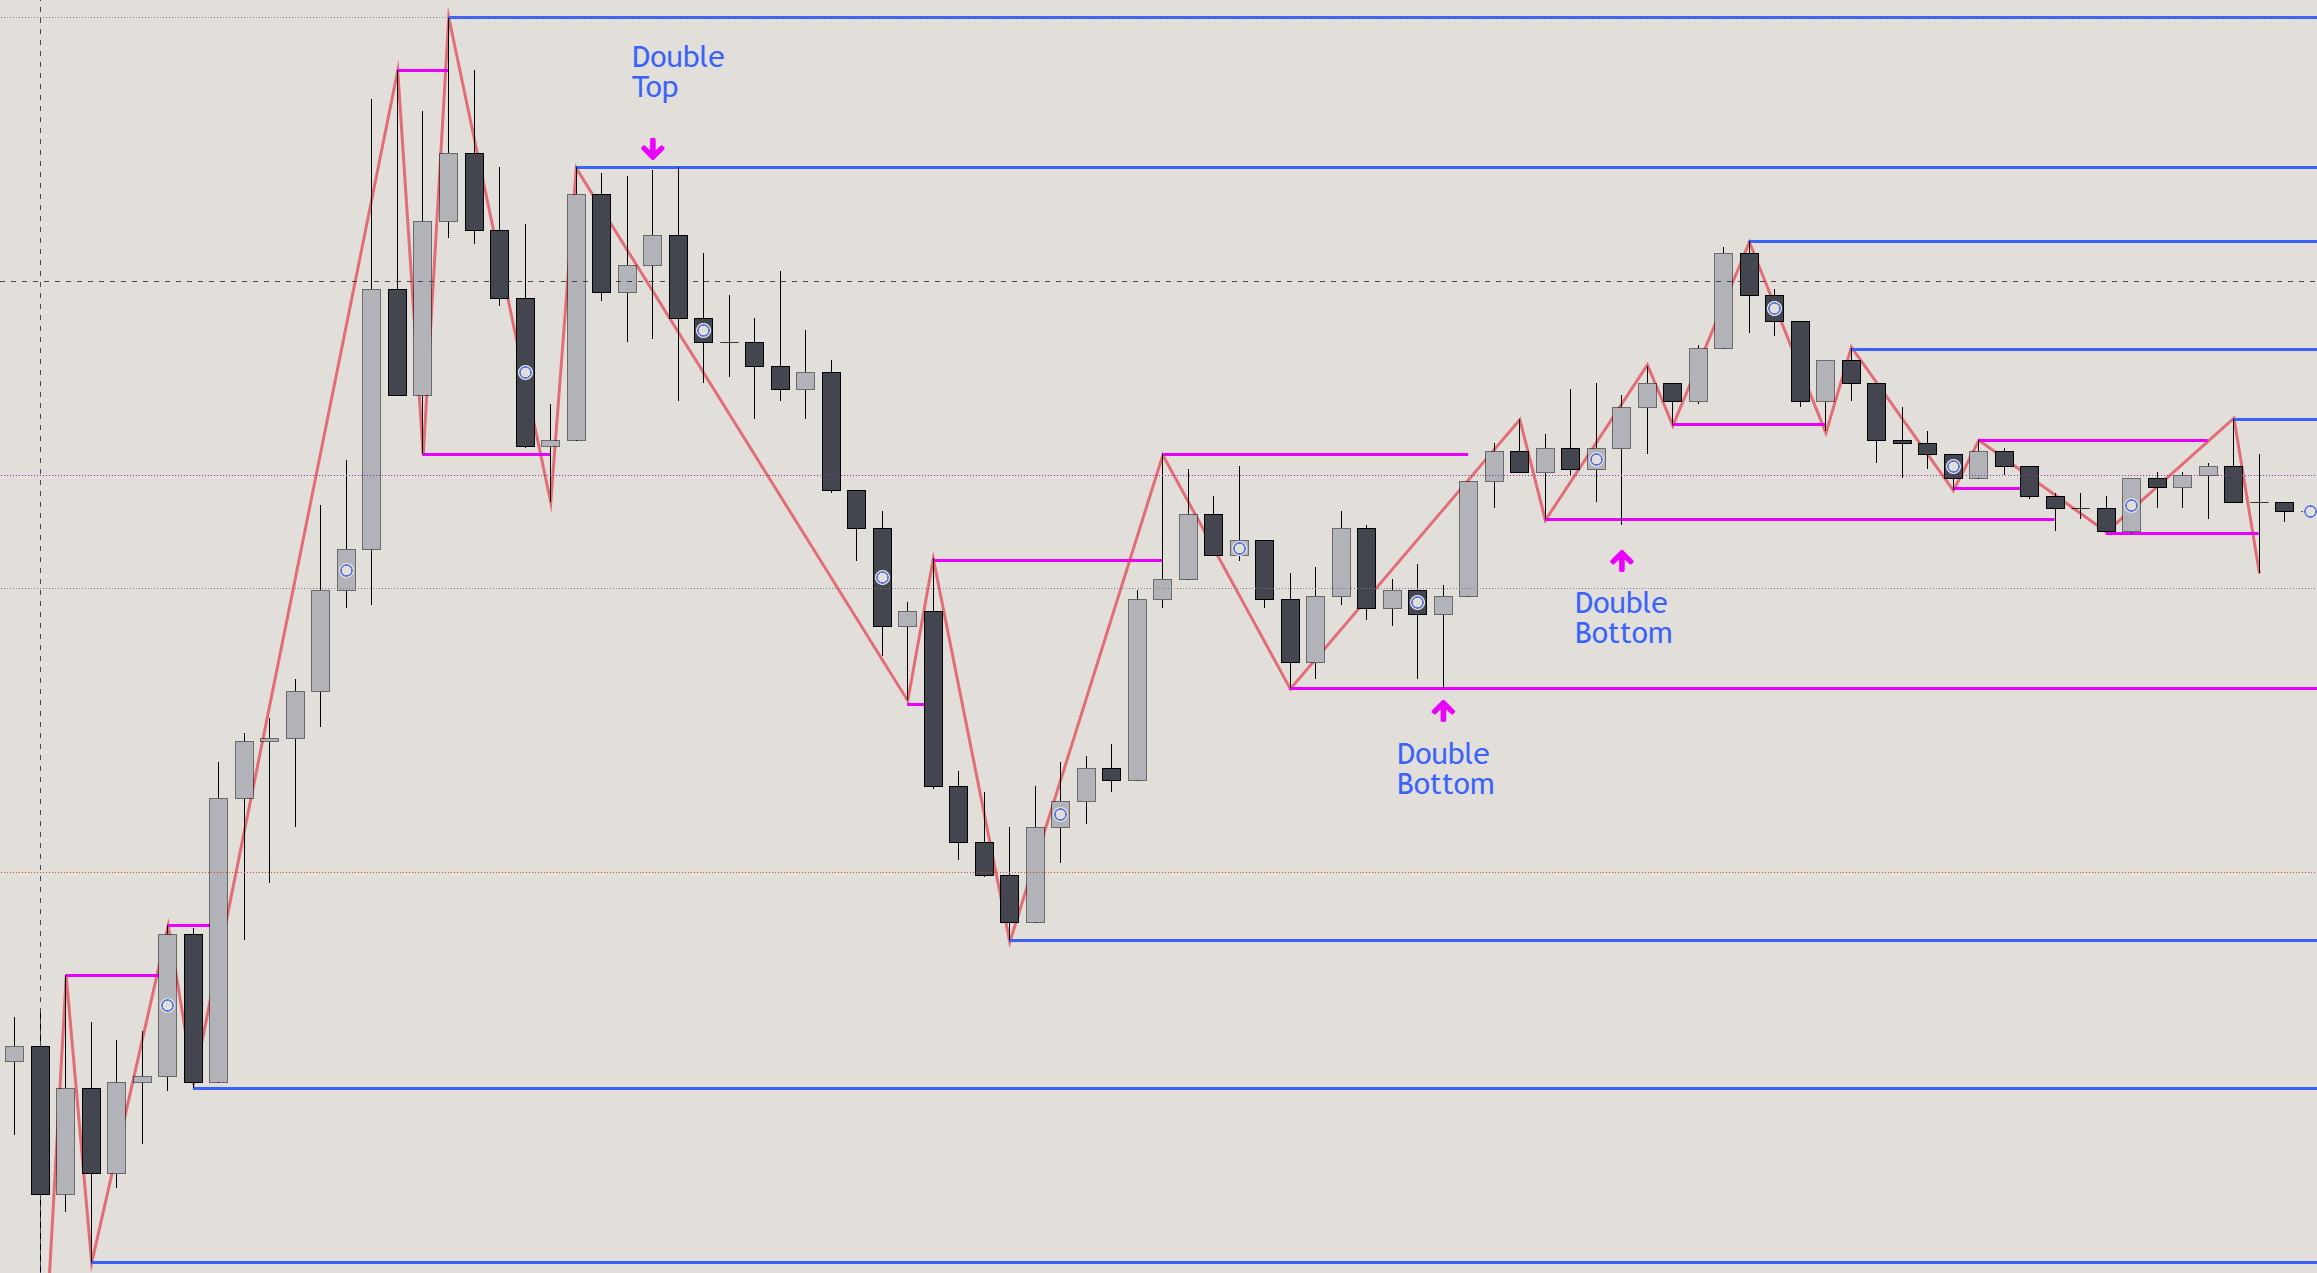
Blue = untested structure
Pink = structure broken
You don't need to draw these in the indicator for all of the history. Just the last n bars or n structure breaks.
I'd like to have two TF (one HTF, Daily, Weekly etc) and one LTF (H1, M15).