 Todos los encargos
 Reglas
Mira cómo encargar de forma rápida un robot comercial
Lea las reglas antes de empezar el trabajo
Cómo encargar un robot comercial en MQL5 y MQL4
Mire el ejemplo de Tarea Técnica para encargar un robot
Nuevas solicitudes en la categoría:
250 - 500 USD
30+ USD
30 - 50 USD
30 - 40 USD
30+ USD
Trabajo finalizado
Plazo de ejecución 65 días

Comentario del Cliente
Very detail and will do his best to deliver the best solution for you.
Comentario del Ejecutor
Excellent communication, very helpful and great understanding. A pleasure to work for him.
Tarea técnica
I need a help to code VWAP (Volume Weighted Average Price) which is a very common indicators that used in futures market. At the end of the project, I would need the source code.
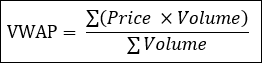
The main math formula I found from online is
Please refer to the attached picture below for my desired outcome.
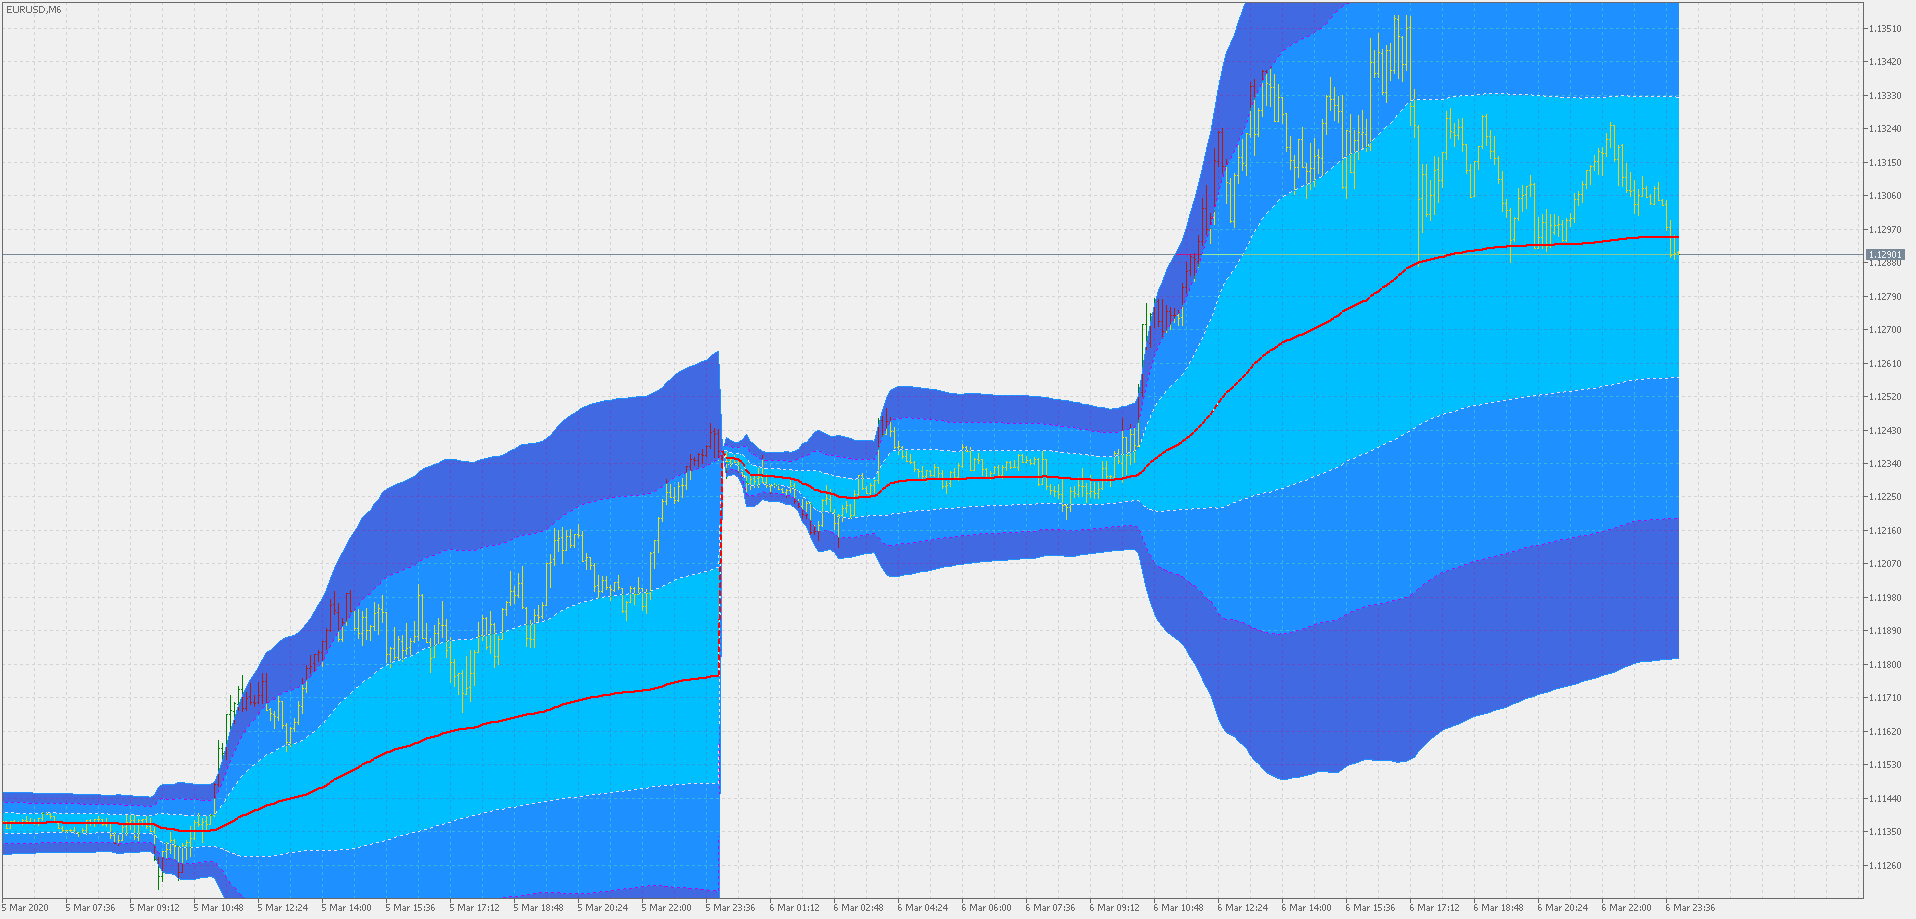
To simplify my requirement, I will put it into bullets points
- The VWAP indicators will reset based on daily basic. When new days reached, the VWAP will begin from 0 again.
- Continue from above, I need an inputs that can allow me the period of resetting, just use period timeframe, where i can choose for it to reset on daily/weekly/monthly basic. (to avoid error, help me check if the current time frame is smaller than input's desired reset period)
- Follow the math equation above to calculate the center or VWAP lines
- The range/bands upside and downside band is measured using standard deviation (0.5, 1.0, 1.5, 2.0)
- Set input parameters of the gap. For default, I want the up down band as 0.5, 1.0, 1.5, 2.0 standard deviation (4 levels needed - 1 more level than above one)(let it be a float number where i can key in later on)
- The colour used if can choose the one have gradient (also allow to make changes), for default, can just follow the picture above.
- Volume calculation can choose to based on either Tick volume or Real volume
- Input: Data source to choose can be ticks, M1, M5, M15, M30
- Input: Period count - For the case where the calculation of VWAP on entire chart will be time consuming, by default let it only count on past 30 days of VWAP. The '30' is the inputs I can define later
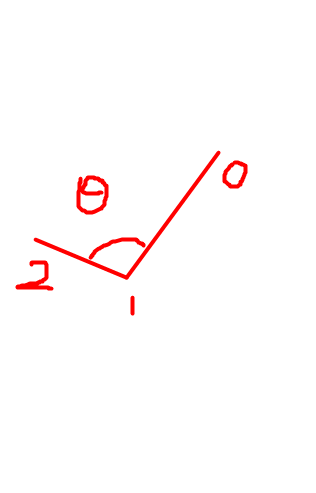
- On data windows, I would like to know the angle of previous VWAP value relative to current VWAP and 2 period earlier VWAP. In simple term, angle of 3 points between shift 1,2,and 3. Refer picture below.
-
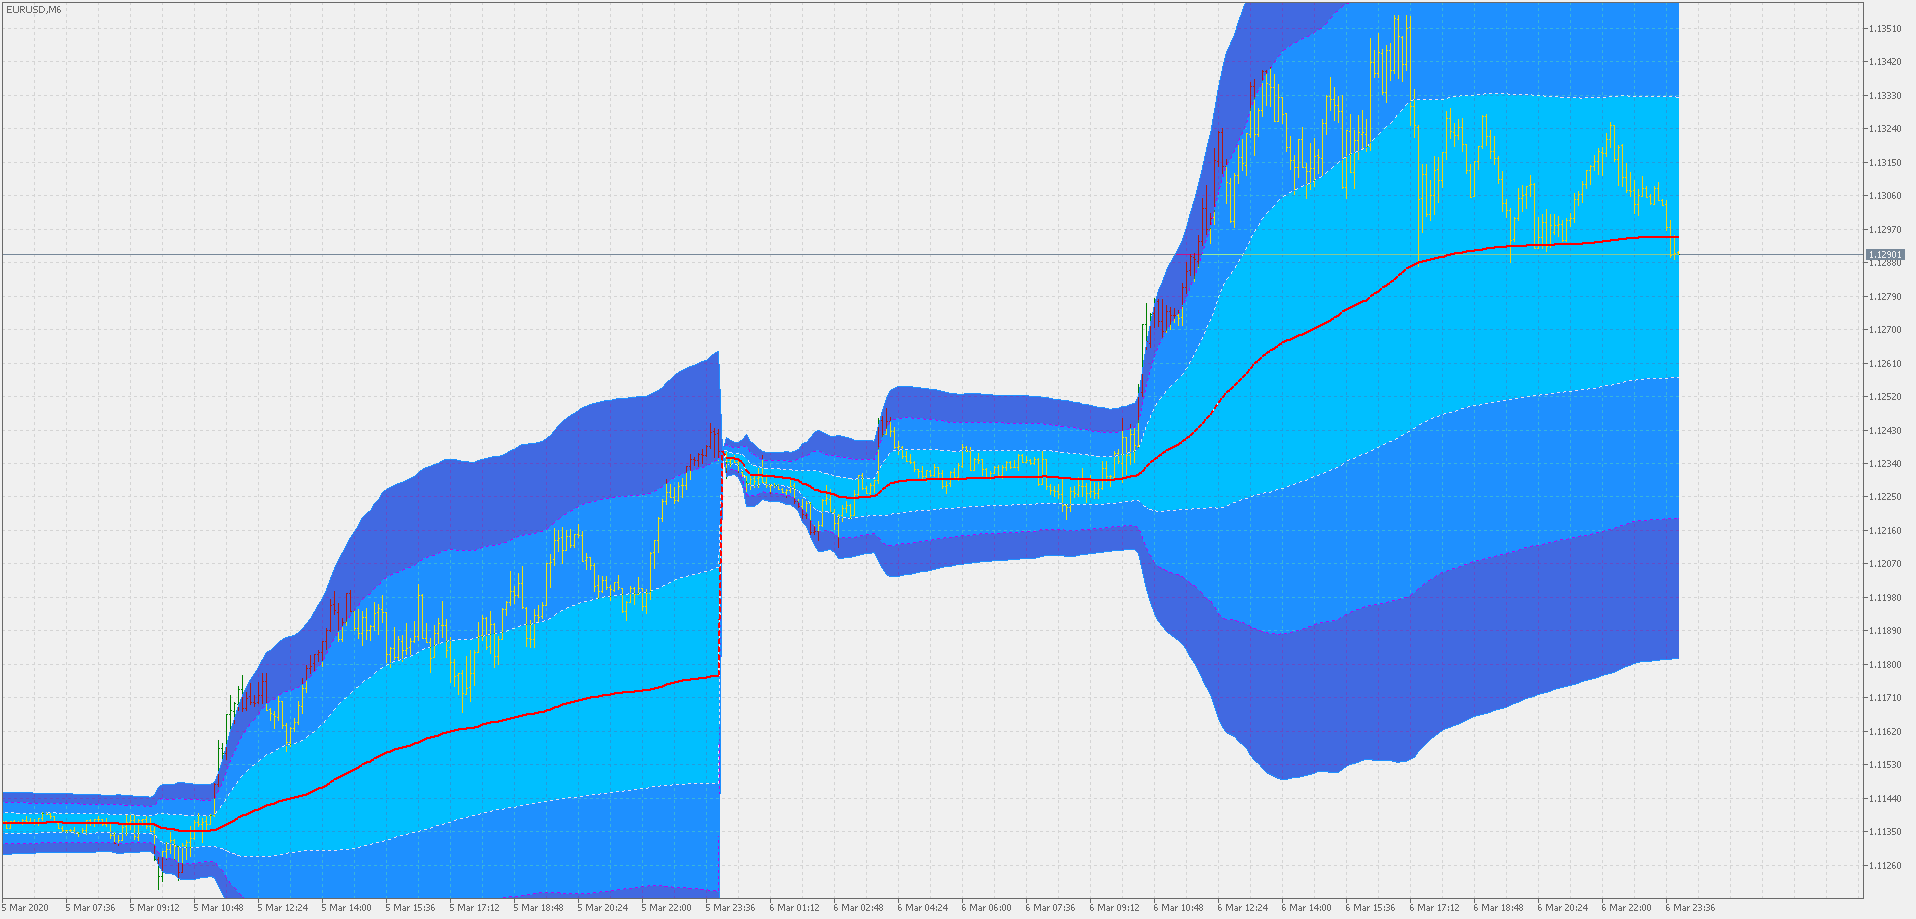
Resources: https://www.mql5.com/en/code/28523
I found this code available on code based but is displayed in histogram. It will be great if I can see the volume profile development as the time past (which is VWAP). Perhaps you can use the code available here to start working. Feel free to contact with me for any clearification.
Han respondido
1
Evaluación
Proyectos
72
22%
Arbitraje
13
46%
/
15%
Caducado
5
7%
Libre
2
Evaluación
Proyectos
46
28%
Arbitraje
9
0%
/
100%
Caducado
7
15%
Libre
3
Evaluación
Proyectos
5
0%
Arbitraje
5
0%
/
80%
Caducado
2
40%
Libre
4
Evaluación
Proyectos
13
23%
Arbitraje
0
Caducado
1
8%
Libre
Solicitudes similares
I am looking for a highly skilled trading strategist and MQL5 developer with genuine experience in researching, designing, testing, and implementing systematic trading strategies. My primary interest is XAUUSD (Gold), although proven experience with other financial markets is also welcome. I am not looking for someone who simply converts trading rules into code. I want to identify a professional who understands
MarketMind Breakout Pro XAUUSD H1 — Donchian Breakout EA Project type: Personal EA development and backtesting Platform: MetaTrader 5 Instrument: XAUUSD Timeframe: H1 Strategy: Donchian Channel breakout with EMA 200 Project overview This project evaluates a Donchian breakout trading strategy for XAUUSD on the H1 timeframe. The system uses channel-based breakout conditions and an EMA 200 trend filter. Historical
The purpose of this order is ONLY to test and implement my H1 POI (Point of Interest) identification logic correctly. I am not requesting the complete EA at this stage. I will provide the exact rules for identifying the H1 POI after selecting the developer. The developer must convert those rules into clear, deterministic MQL5 logic. Requirements: Analyze H1 candles according to the rules I provide. Identify and mark
Hello, I’m looking for an experienced developer to research, build, test, and install a fully automated MetaTrader 5 trading bot for gold, XAUUSD. My total development and installation budget is $300, including all agreed work and fees. My goal is to pass a $100,000 FTMO US Two-Step Standard evaluation and sustainably maintain the funded account. I need a day-trading strategy that can buy in bullish markets and sell
Hello International Developer, I need LIFETIME MT5 EA for XAUUSD Gold. REQUIREMENTS: 1. Lifetime bot - No expiry date, unlimited accounts, unlimited installations 2. Must include source code .mq5 file - This makes it lifetime 3. Every trade MUST have Stop Loss 300 points and Take Profit 600 points 4. No martingale, No grid, No averaging - Clean safe strategy 5. Auto lot size = 1% risk per trade for good margin growth
Consultor de técnicas Fibonacci
30 - 70 USD
Fibonacci Técnicas... Estudos Fibonacci de expansão e retração. Estudos técnicos... Linhas de tendencia, resistência, suporte. Probabilidades... Analises técnicas com indicadores e contextos fundamentalistas Estatística... Analises técnicas com indicadores e contextos fundamentalistas Análise técnica... 6 Operações diárias... Scalpe trader, day trader, swing trader Consultor de técnicas Fibonacci... explicação de
Custom MT5 Trading Robot for Gold and Forex
200 - 300 USD
Project: Custom MT5 Day Trading Expert Advisor I need a custom automated trading robot (EA) for MetaTrader 5, developed in MQL5. Markets: - Gold (XAUUSD) - Selected Forex pairs Trading style: Automated day trading. All positions should be closed according to predefined strategy rules and before the end of the selected trading session. Strategy: The developer should propose a clear trading strategy, explain its rules
Ninjascript strategy tester
30+ USD
Hi, I need NinjaTrader 8 Strategy Analyzer backtests on two of my strategies, each over 1 year AND 3 years of data. Please quote the full job. Common settings: NT8 Strategy Analyzer, MCL (Micro WTI Crude Oil) continuous front-month contract (MCL ##-##), 5-minute bars, 1yr + 3yr of the most recent data, $2.50 round-turn commission per contract. Deliverables per run: full Strategy Analyzer summary (net profit, profit
a { text-decoration: none; color: #464feb; } tr th, tr td { border: 1px solid #e6e6e6; } tr th { background-color: #f5f5f5; } Project Description I need an Expert Advisor (EA) for MetaTrader 5 (MT5) that can automatically trade Gold (XAUUSD) and major Forex pairs. The EA must analyze market conditions, open and close trades automatically, manage risk effectively, and be fully compatible with the MT5 Strategy Tester
To create a unique description that meets the freelance site's requirements, you can type the following: "I am looking for an experienced MQL5 developer to create a custom Forex Expert Advisor. The trading strategy should be based on a moving average crossover system, filtered by the Relative Strength Index indicator. The expert advisor needs to feature distinct strategy modules with adjustable settings for the
Información sobre el proyecto
Presupuesto
30+ USD
Plazo límite de ejecución
a 5 día(s)