Trabajo finalizado
Tarea técnica
I have an Indicator, and I want to change it into an EA.
I have a picture to show how this Indicator works and what I need.
I am a rookie of program making, so I can't tell you how it works, sorry.
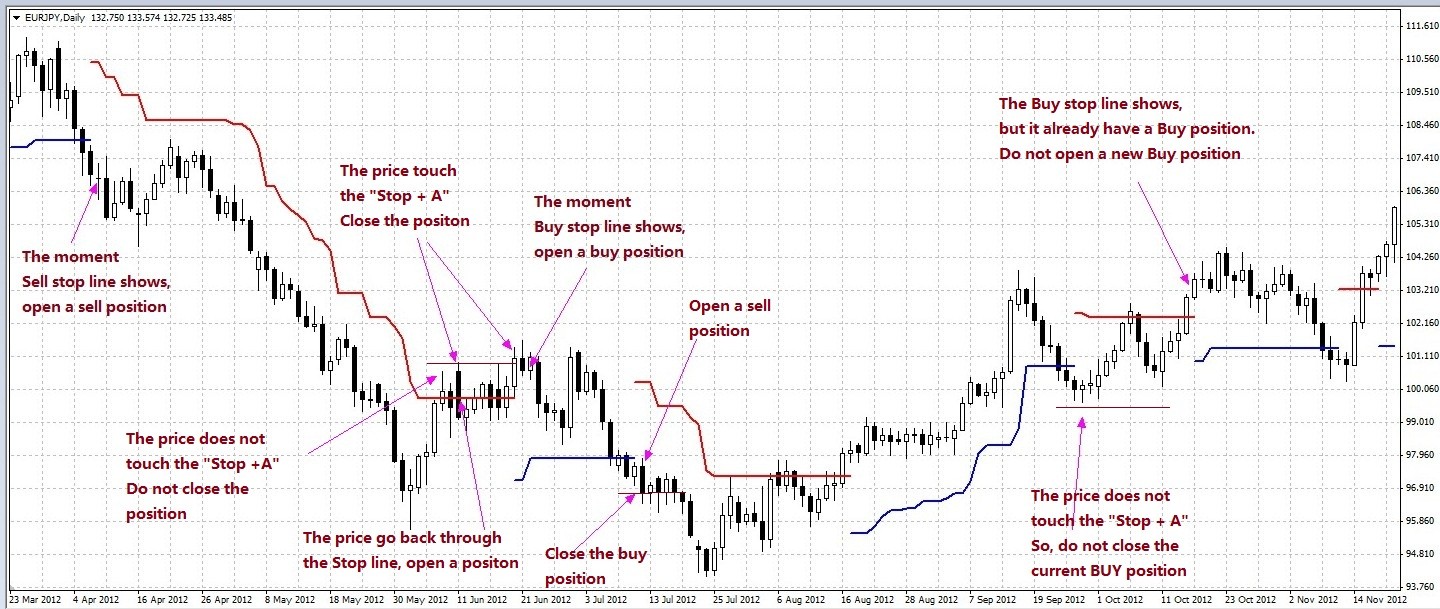
As you can see, the Indicator shows two lines.
A blue line (I call it "Buy stop line") and a red line (I call it "Sell stop line")
At the first beginning, I should input two variables.
"Lot size" and a variable "A".
----For the Buy stop line----
When to OPEN
1. If there is no Buy position, the moment Buy stop line shows, open a buy position.
2. If there is no Buy position, the moment price go up through Buy stop line, open a buy position
When to CLOSE
1. The moment price touch "Stop + A", close the current buy position.
[For Buy stop line, "Stop + A"="Current stop price"-"A"]
For example, if current stop price is 1.31254 for Eur/Usd, and A is 50,
so the "Stop + A" is 1.30754. The moment price touch 1.30754, close the Buy position.
----For the Sell stop line----
When to OPEN
1. If there is no Sell position, the moment Sell stop line shows, open a sell position.
2. If there is no Sell position, the moment price go down through Sell stop line, open a sell position
When to CLOSE
1. The moment price touch "Stop + A", close the current sell position.
[For Sell stop line, "Stop + A"="Current stop price"+"A"]
For example, if current stop price is 1.31254 for Eur/Usd, and A is 50,
so the "Stop + A" is 1.31754. The moment price touch 1.31754, close the Sell position.
----Additional information----
1. There is only one Buy position at one time, and there is only one Sell position at one time.
2. It is possible for the circumstance that it have a Buy position and a Sell postion at the same time, if the former one doesn't meet the close condition.
3. Please look the picture after you reading the words, and if you still have some questions, please tell me.