Resistance Support Lines Pro
- Indicators
- Serhii Fertikov
- Version: 1.7
- Updated: 3 August 2023
- Activations: 5
The indicator calculates fractal lines, which are technically psychological support/resistance lines.
In fact, these are the highs and lows of the price over a period of time.
The indicator works on all charts and timeframes.
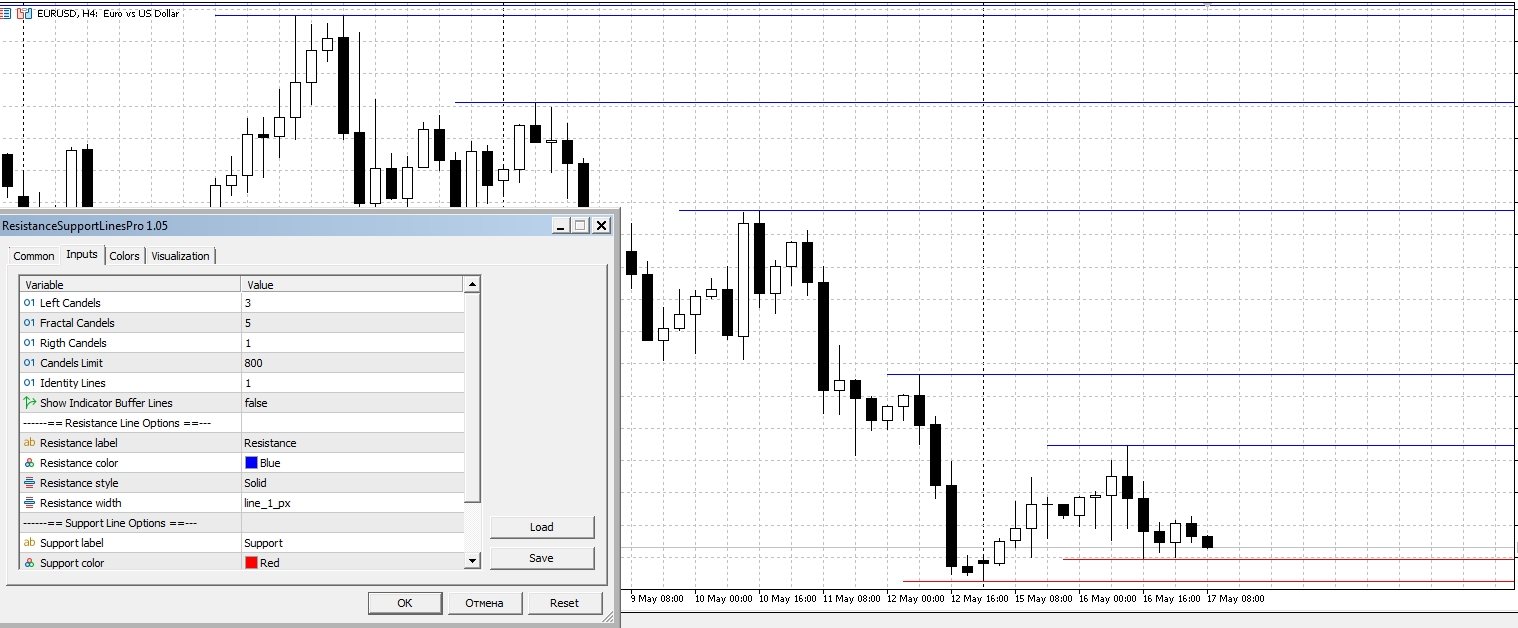
Settings:
- Fractal Candels - number of candles from which a fractal is built. Calculates the maximum/minimum at which a psychological price can be set.
- Rigth Candels - number of candles based on which false fractals are filtered to the right of it
- Left Candels - number of candles on the basis of which false fractals are filtered to the left of it
- Candels Limit - number of last candles on the basis of which the indicator works. The default setting is optimal. If you need more lines for a longer period, increase this value.
- Identity Lines - is the minimum distance between two lines of the same type. This coefficient reduces the number of lines that are close in price
- ... advanced colour settings and display styles on the graph
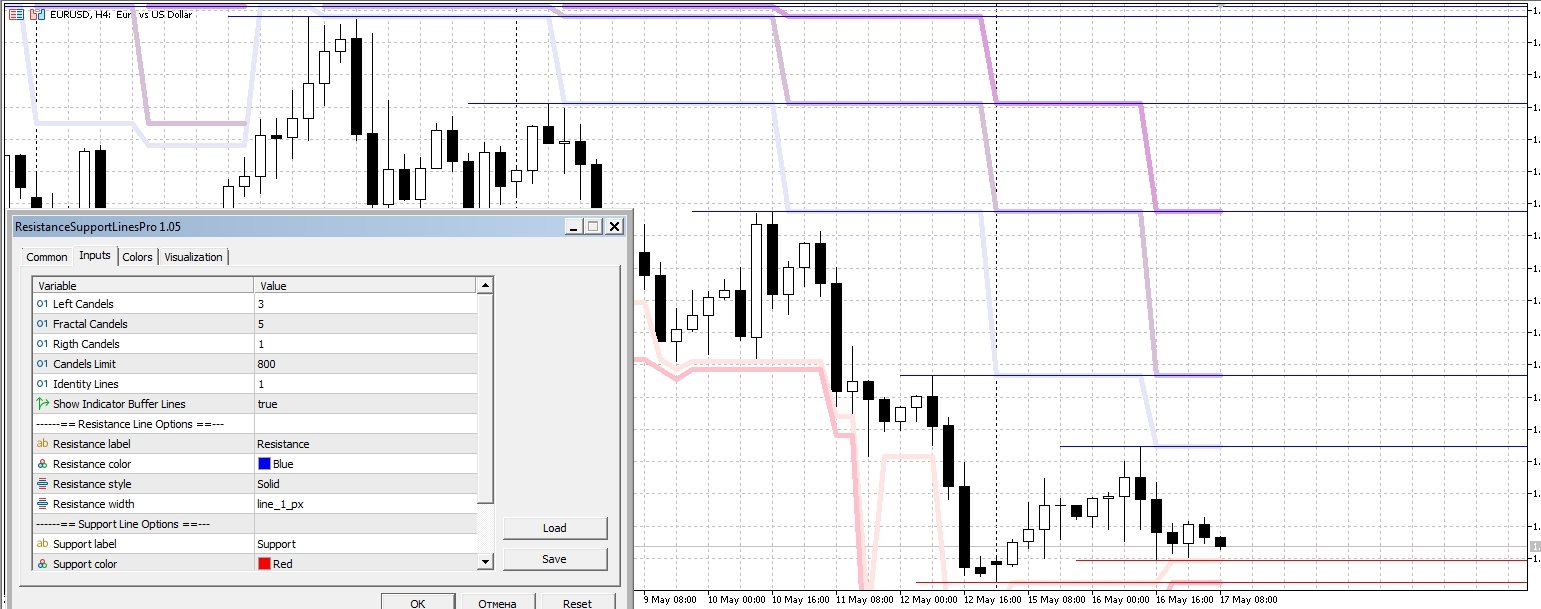
If the previously formed line is broken by the price, it is cut off and stays on the chart for some more time, then these segments are deleted from the chart. For the indicator buffer this line ceases to exist.
Use in experts and other scripts:
This version of the indicator comes with indicator buffers and can be used in your EAs for automated trading.
In total there are 6 buffers in the indicator (3 for resistances and 3 for supports): 0,2,4 - indexes of resistance line buffers; 1,3,5 - indexes of support line buffers, where 0 is the nearest resistance line, and 4 is the far line.
Contact:
If you have any questions or need assistance, please contact me via direct message.
Author:
Fertikov Serhii, More of my indicators, advisors, scripts are available in the seller's profile.