Resistance Support Lines Pro
- Indicatori
- Serhii Fertikov
- Versione: 1.7
- Aggiornato: 3 agosto 2023
- Attivazioni: 5
L'indicatore calcola le linee frattali, che sono linee di supporto/resistenza di tipo tecnico psicologico.
In realtà, si tratta dei massimi e dei minimi del prezzo in un periodo di tempo.
L'indicatore funziona su tutti i grafici e i timeframe.
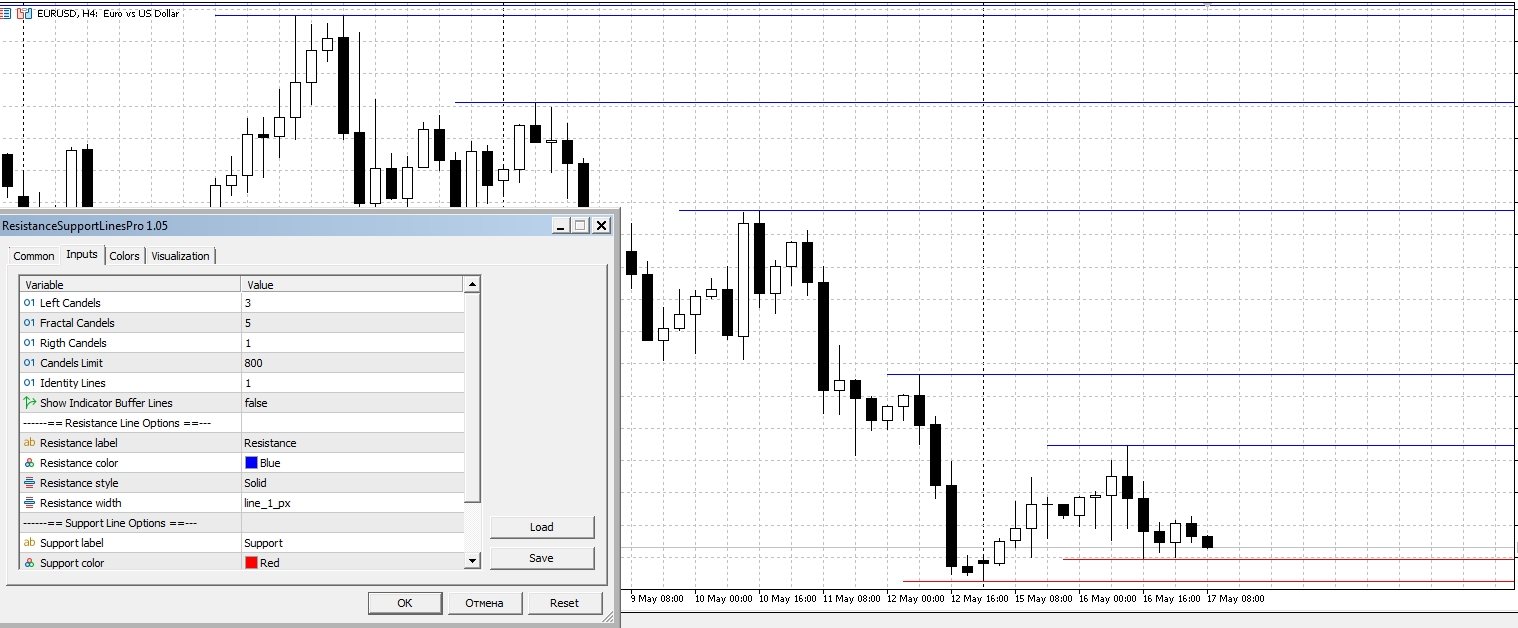
Impostazioni:
- Fractal Candels - il numero di candele sulla base del quale viene costruito un frattale. Calcola il massimo/minimo a cui è possibile calcolare il prezzo psicologico.
- Rigth Candels - il numero di candele in base al quale i falsi frattali sono filtrati a destra di esso
- Left Candels - il numero di candele in base al quale i falsi frattali sono filtrati a sinistra di esso
- Candels Limit - il numero di ultime candele in base al quale l'indicatore funziona. L'impostazione predefinita è ottimale. Se avete bisogno di più linee per un periodo più lungo, aumentate questo valore.
- Identity Lines - è la distanza minima tra due linee dello stesso tipo. Questo coefficiente riduce il numero di linee vicine in termini di prezzo
- ... impostazioni avanzate del colore e stili di visualizzazione sul grafico
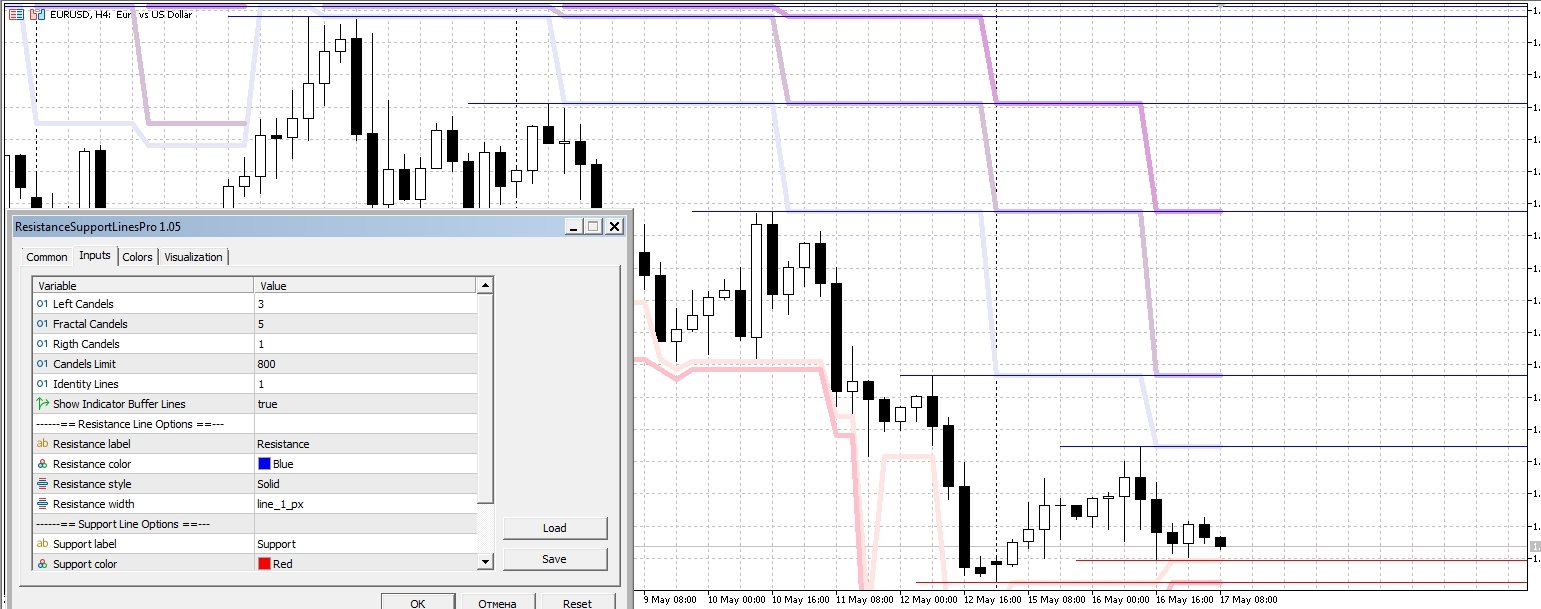
Se la linea precedentemente formata viene rotta dal prezzo, viene tagliata e rimane sul grafico per un altro po' di tempo, quindi questi segmenti vengono cancellati dal grafico. Per l'indicatore buffer questa linea cessa di esistere.
Utilizzo in esperti e altri script:
Questa versione dell'indicatore è dotata di buffer e può essere utilizzata negli EA per il trading automatico.
In totale ci sono 6 buffer nell'indicatore (3 per le resistenze e 3 per i supporti): 0,2,4 - indici dei buffer delle linee di resistenza; 1,3,5 - indici dei buffer delle linee di supporto, dove 0 è la linea di resistenza più vicina e 4 è la linea più lontana.
Contatto:
Se avete domande o bisogno di aiuto, contattatemi tramite messaggio privato.
Autore:
Fertikov Serhii, Altri indicatori, consulenti e script sono disponibili su profilo del venditore.