UR Gamma
- Indicators
- Krzysztof Jan Debski
- Version: 1.15
- Updated: 15 May 2024
- Activations: 5
UR Gamma
(powered by similar calculations found in Machine Learning systems)
UR Gamma is a cutting-edge financial analysis tool that offers a new and improved take on the classic WaveTrend indicator. By incorporating advanced Digital Signal Processing techniques, UR Gamma addresses some of the limitations of traditional WaveTrend algorithms and provides a more accurate, robust and dynamic approach to identifying and measuring trends in price action.
Advantages of using UR Gamma:
- Minimalistic setup
- All the data is being calculated in the background - with just 1 output for the user - clear and neat.
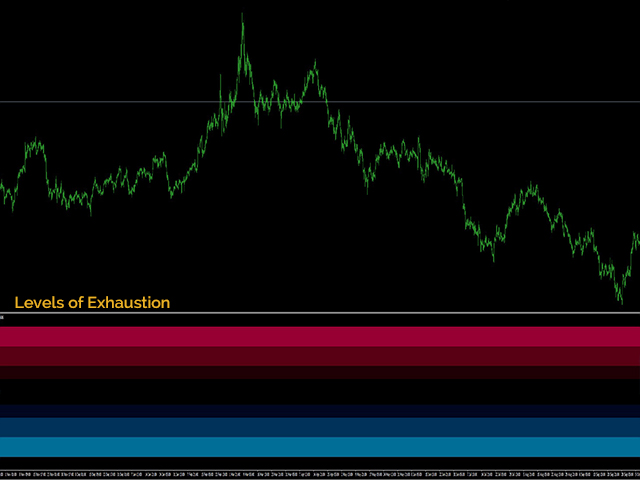
- Background levels to suggest exhaustion
- Adjusted to all kinds of assets.
There is a special telegram chat on which you can stay up-to-date with the tools updates and also send request if you feel there is something missing!
Why UR Gamma?
UR Gamma is a powerful tool for traders and investors, providing them with a more comprehensive, reliable and actionable insight into market trends and price movements. The algorithm is also adaptable for use across multiple time frames and markets, making it a versatile and flexible solution for any financial analysis needs. With its unique approach and advanced functionality, UR Gamma is a must-have tool for any professional or serious trader looking to gain an edge in the financial markets.
How to use UR Gamma ?
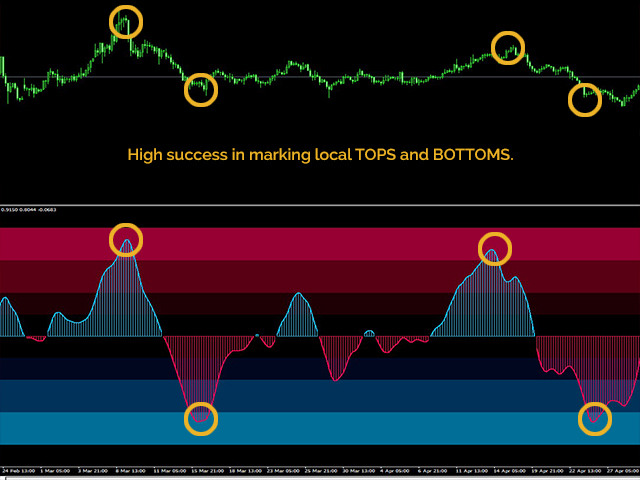
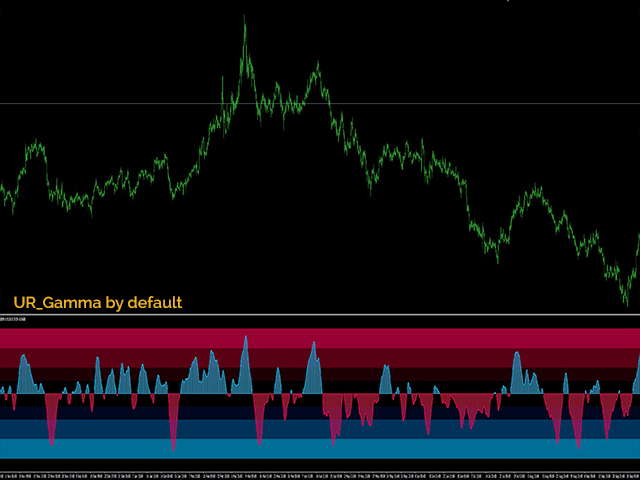
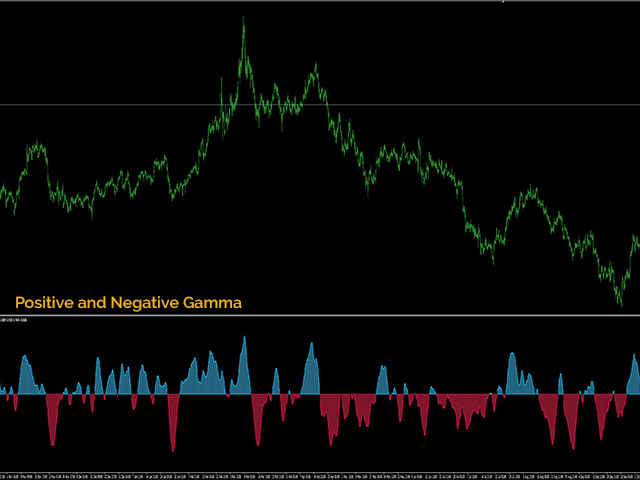
UR Gamma is a one line oscillator that is designed to help traders identify and measure trends in price action. The oscillator is easy to use and provides a clear visual representation of market trends, with the background levels showing possible exhaustion points of price. To use UR Gamma, simply add the indicator to your chart and observe the oscillations of the line. The oscillator will oscillate between -1 and 1, with 0 as the median. When the line is above 0, it indicates that the market is in an uptrend, and when it is below 0, it indicates a downtrend. The background levels provide a clear indication of possible exhaustion points of price, so traders can take action accordingly. To further enhance the analysis, users can adjust the settings to suit their preferences and requirements.
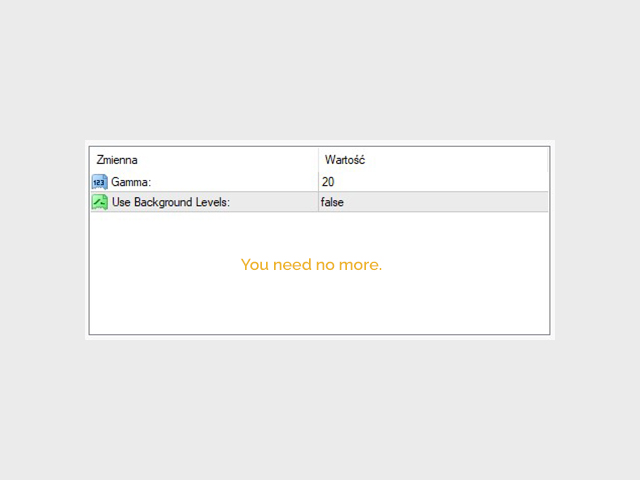
- Gamma: Basically a "lookback" value that influences the length of the waves - adjust this depending on the timeframe you are using.
- Use Background Levels: Visualization of exhaustion behind the buffer
DISPLAY
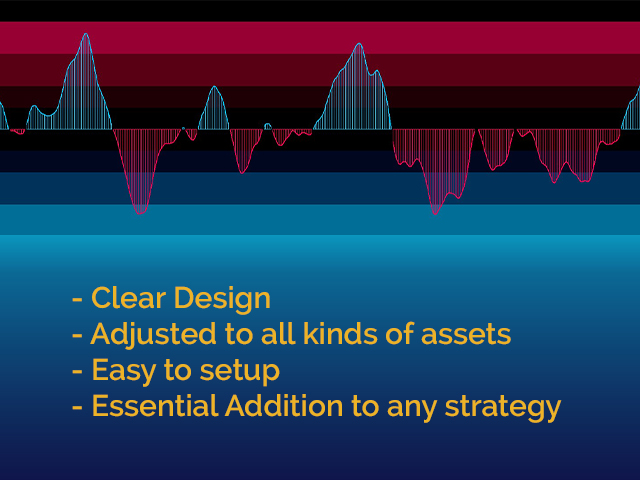
- Gamma Line: Shows the exhaustion of the price and possibly redistribution levels marking tops and bottoms.
- Background Levels: Show different exhaustion levels adjusted to the default setup.
WWW -> https://urtradingcoder.carrd.co
Twitter -> https://twitter.com/URTradingCoder
Facebook -> https://www.facebook.com/profile.php?id=61559349091899
YouTube -> https://www.youtube.com/channel/UCihthoKQYrhj91jkUO8B1kg
MQL Store -> https://www.mql5.com/en/users/youreacoder/seller

