UR Gamma
- Göstergeler
- Krzysztof Jan Debski
- Sürüm: 1.15
- Güncellendi: 15 Mayıs 2024
- Etkinleştirmeler: 5
UR Gama
(Makine Öğrenimi sistemlerinde bulunan benzer hesaplamalarla desteklenir)
UR Gamma, klasik WaveTrend göstergesine yeni ve geliştirilmiş bir bakış açısı sunan son teknoloji bir finansal analiz aracıdır. UR Gamma, gelişmiş Dijital Sinyal İşleme tekniklerini birleştirerek, geleneksel WaveTrend algoritmalarının bazı sınırlamalarını giderir ve fiyat hareketindeki eğilimleri belirlemeye ve ölçmeye yönelik daha doğru, sağlam ve dinamik bir yaklaşım sağlar.
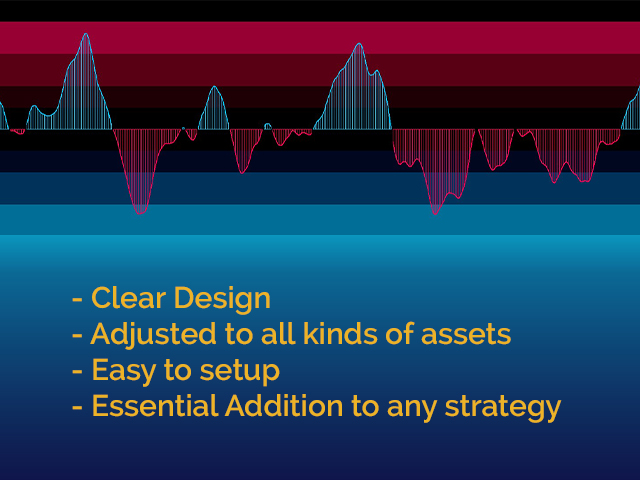
UR Gamma kullanmanın avantajları:
minimalist kurulum
Tüm veriler arka planda hesaplanıyor - kullanıcı için yalnızca 1 çıktı ile - net ve düzenli.
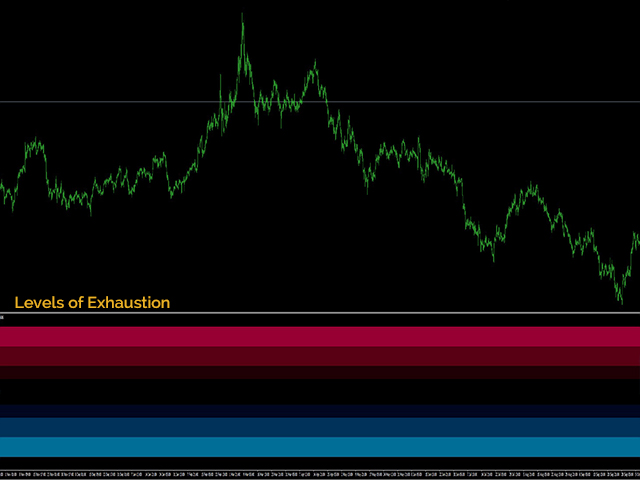
Tükenmişlik önermek için arka plan seviyeleri
Her türlü varlığa göre ayarlanır.
Araç güncellemelerinden haberdar olabileceğiniz ve eksik bir şey olduğunu düşünüyorsanız istek gönderebileceğiniz özel bir telgraf sohbeti var!
Neden UR Gama?
Amaç, olasılık dağılımının -1 ile 1 arasında, orta nokta 0 olacak şekilde salınmasıdır. Bunu başarmak için, verileri dönüştürmek için Makine Öğreniminden aktivasyon işlevi adı verilen bir teknik kullanılır. Böyle bir işlev, -1 ile 1 arasındaki değerleri tuttuğu için sinir ağlarında sıklıkla kullanılan hiperbolik tanjant işlevidir. Girdi verilerinin birinci türevini alıp ikinci dereceden ortalamayı kullanarak normalleştirerek, tanh işlevi girdiyi etkili bir şekilde yeniden dağıtır. sinyali istenen -1 ila 1 aralığına getirin.
UR Gamma, tüccarlar ve yatırımcılar için güçlü bir araçtır ve onlara piyasa eğilimleri ve fiyat hareketleri hakkında daha kapsamlı, güvenilir ve eyleme geçirilebilir bir içgörü sağlar. Algoritma aynı zamanda birden fazla zaman diliminde ve piyasada kullanım için uyarlanabilir ve bu da onu her türlü finansal analiz ihtiyacı için çok yönlü ve esnek bir çözüm haline getirir. Eşsiz yaklaşımı ve gelişmiş işlevselliği ile UR Gamma, finansal piyasalarda avantaj elde etmek isteyen herhangi bir profesyonel veya ciddi tüccar için olmazsa olmaz bir araçtır.
UR Gama nasıl kullanılır?
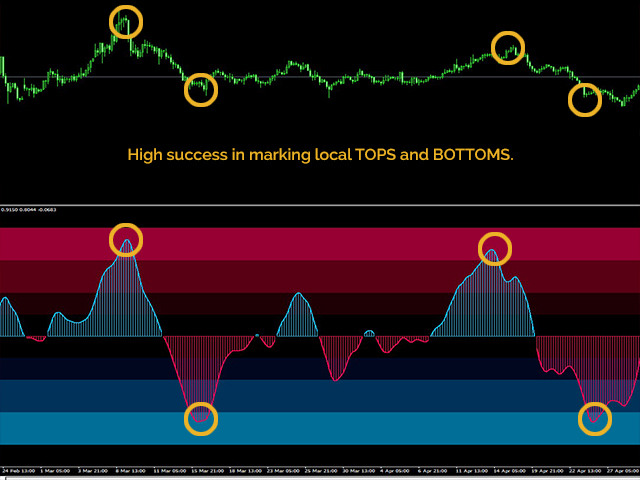
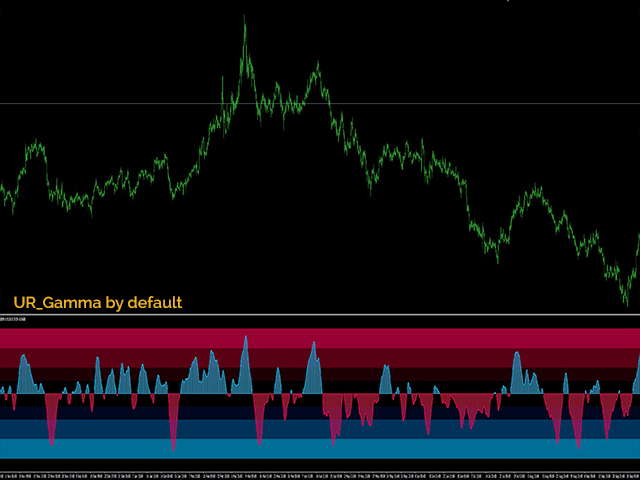
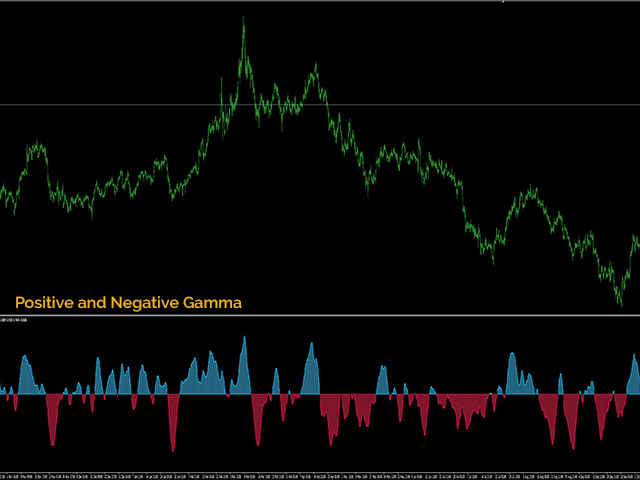
UR Gamma, tüccarların fiyat hareketindeki eğilimleri belirlemesine ve ölçmesine yardımcı olmak için tasarlanmış tek hatlı bir osilatördür. Osilatörün kullanımı kolaydır ve olası fiyat tükenme noktalarını gösteren arka plan seviyeleri ile pazar eğilimlerinin net bir görsel sunumunu sağlar. UR Gamma'yı kullanmak için, göstergeyi grafiğinize eklemeniz ve çizginin salınımlarını gözlemlemeniz yeterlidir. Osilatör, medyan olarak 0 olmak üzere -1 ile 1 arasında salınır. Çizginin 0'ın üzerinde olması piyasanın yükseliş trendinde olduğunu, 0'ın altında olması ise düşüş trendinde olduğunu gösterir. Arka plan seviyeleri, fiyatın olası tükenme noktalarının net bir göstergesidir, böylece tacirler buna göre harekete geçebilir. Analizi daha da geliştirmek için, kullanıcılar tercihlerine ve gereksinimlerine uyacak şekilde ayarları düzenleyebilir.
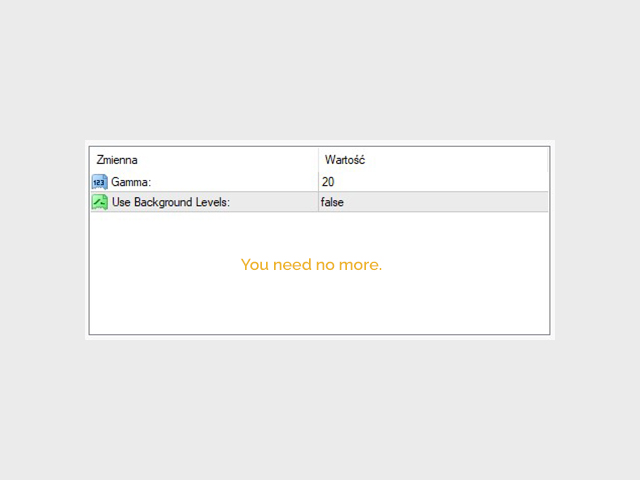
AYARLAR
Gama: Temelde dalgaların uzunluğunu etkileyen bir "geriye bakma" değeri - bunu kullandığınız zaman dilimine göre ayarlayın.
Arka Plan Düzeylerini Kullanın: Tamponun arkasındaki yorgunluğun görselleştirilmesi
GÖRÜNTÜLEMEK
Gama Çizgisi: Fiyatın tükenmesini ve muhtemelen yeniden dağıtım seviyelerini gösterir.
Arka Plan Düzeyleri: Varsayılan kuruluma ayarlanmış farklı tükenme düzeylerini gösterin.