React Fibonacci Chart
- Indicators
- Kim Yonghwa
- Version: 1.6
- Updated: 5 June 2024
Features
- Indicator for Fibonacci Retracement Trading
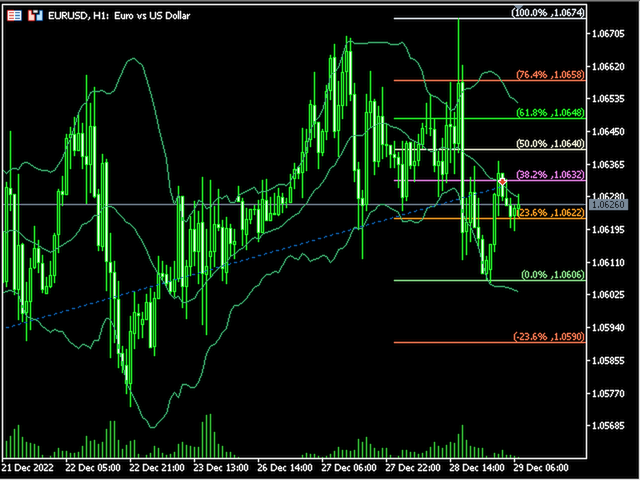
- A Fibonacci chart is drawn based on the previous bar selected among 1H, 4H, 1D, and 1W.
- When the market price touches the Fibonacci level, the color changes and the touch time is displayed.
- The Fibonacci graph is drawn at -23.6, 0, 23.6, 38.2, 50, 61.8, 76.4, 100, and 123.6 levels and the chart refreshes when the bar is updated.
Variables
- Timeframe : A Fibonacci chart is drawn with the selected time frame among 1H, 4H, 1D, and 1W.
- FiboWidth : Determines the thickness of the level.
- FiboStyle : Set the style of the pivot level.
- TouchedColor : Color that changes when touched
Please comment if you have any errors or you would like to see improved.
Ratings are a great help to developers. If you are satisfied, please give us 5 stars.


Отличный