React Fibonacci Chart
- Indicadores
- Kim Yonghwa
- Versión: 1.6
- Actualizado: 5 junio 2024
Funciones
- Indicador para el Trading de Retroceso de Fibonacci
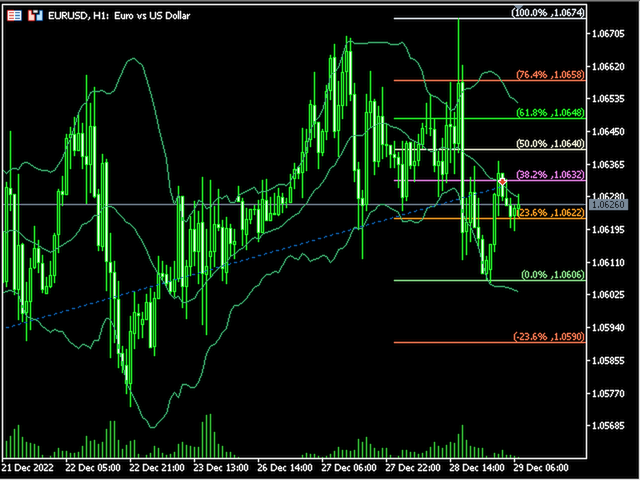
- Se dibuja un gráfico de Fibonacci basado en la barra previa seleccionada entre 1H, 4H, 1D y 1W.
- Cuando el precio del mercado toca el nivel de Fibonacci, cambia el color y se muestra la hora del toque.
- El gráfico de Fibonacci se dibuja en los niveles -23.6, 0, 23.6, 38.2, 50, 61.8, 76.4, 100 y 123.6, y el gráfico se refresca cuando se actualiza la barra.
Variables
- Marco de tiempo: Se dibuja un gráfico de Fibonacci con el marco de tiempo seleccionado entre 1H, 4H, 1D y 1W.
- FiboWidth: Determina el grosor del nivel.
- FiboStyle: Establece el estilo del nivel pivote.
- TouchedColor: Color que cambia al ser tocado.
Por favor, comente si encuentra errores o le gustaría ver mejoras.
Las calificaciones son de gran ayuda para los desarrolladores. Si está satisfecho, por favor, otórguenos 5 estrellas.


good share