Risk2Reward MATR
- Utilities
- Abraham Correa
- Version: 1.5
- Updated: 16 August 2024
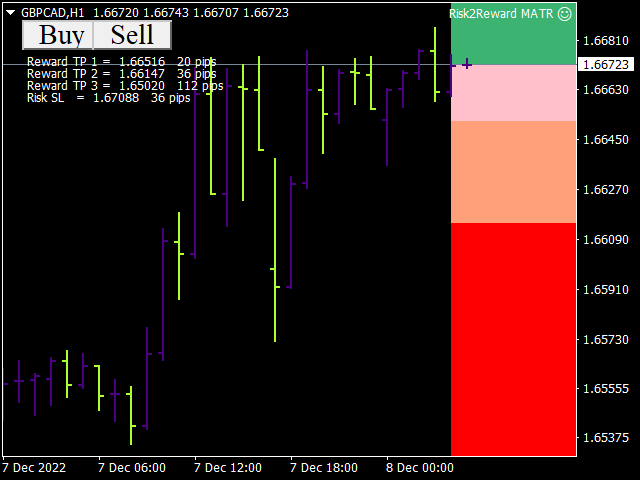
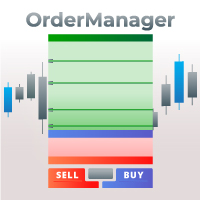
Adapting to the volatility, potential Risk to Reward trading positions are shown based on Average True Range. Risk-Reward-Boxes are shown when the 'Buy or Sell' Button is clicked! A utility of the ATR calculation, rejoice with a matter that isn’t part of a hard decision for when to close a trade. This matter would assist your risk management decision.
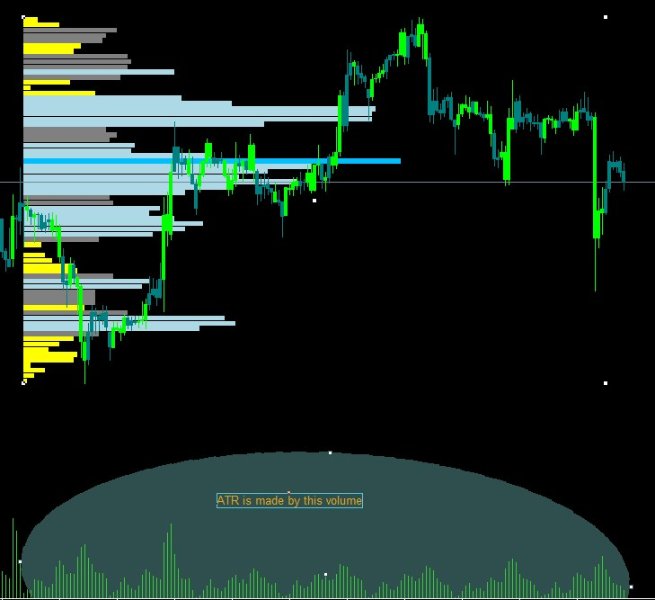
Specifications: The Average True Range is a commonly used indicator that measures a symbol’s market volume, noting changes over a given time span in candlestick form(in a specific time-frame). True Range is the difference between the lowest traded price and the highest traded price of a candlestick, in any given time period. The Average True Range, in all, averages these Highs and Lows of a "preceding" period of days, showing you its calculative result.
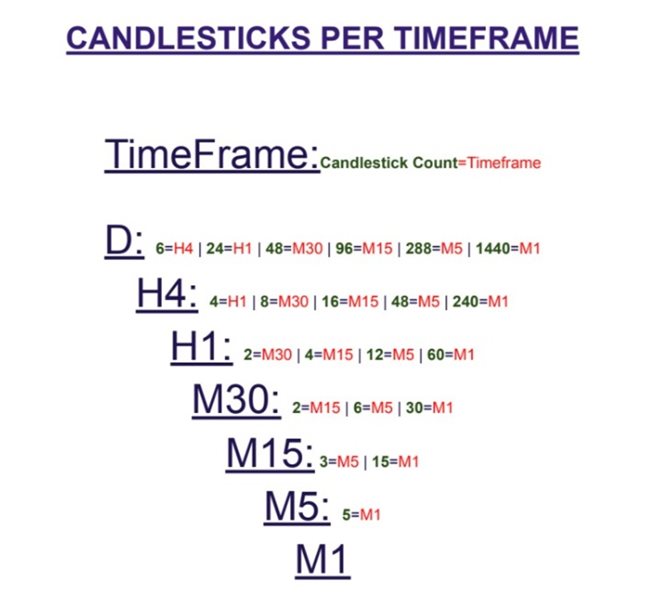
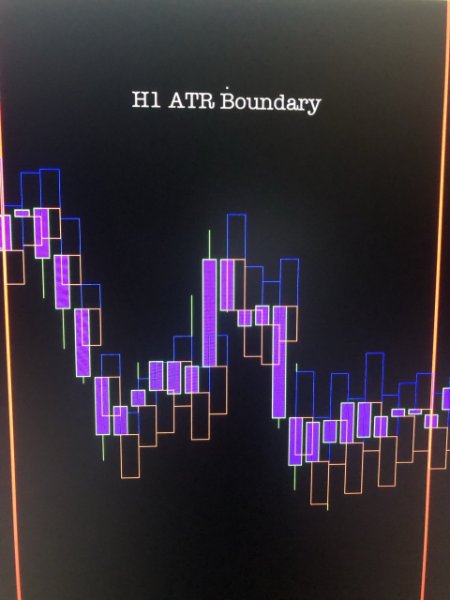
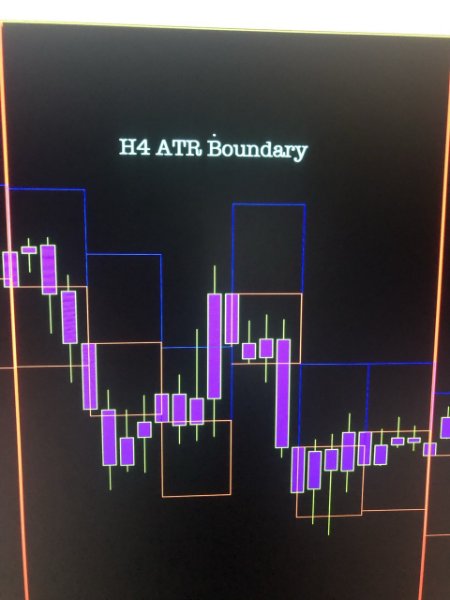
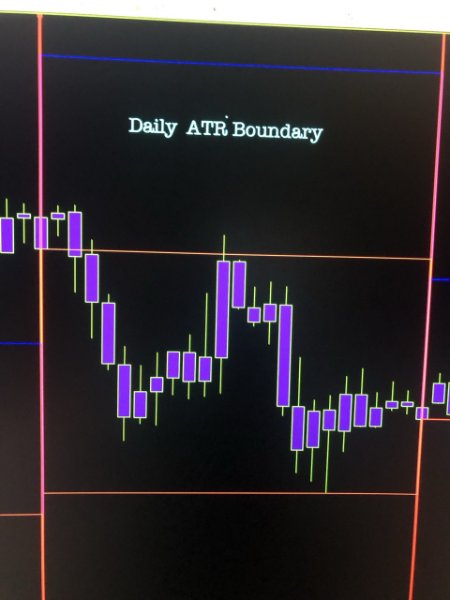
In example, the default settings of the ATR indicator gives us a 14 Day period. The ATR collects the Highs and Lows in pip value, dividing it by 14 days. But of course, this is beyond the common indicator, ATR. Matter a fact, three entirely different Take-Profits (x3 TPs | trailing SL) solely rely on their own Time-frame for different pip consumption. The rule of candlesticks is technically different on each Timeframe. And so, we find a different result for each Time-frame when we use the same period.
Example:
- Time period/days accounted for: 14 | Candlestick count in Timeframe: M30
- Time period/days accounted for: 14 | Candlestick count in Timeframe: H1
- Time period/days accounted for: 14 | Candlestick count in Timeframe: H4
^These are going to offer different Average True Ranges primarily because each Time-frame contain different number of Candlesticks; due to Time Variation! ^
Here is where the power lies and reason why I favored the 3 TP’s: Theoretically, a trailing can happen at the first TP toward the second TP. Third TP awaits! Stop Loss is also based on Average True Range. Remarkably this EA is for a chartist looking for the probability factors and a view of where a limiting point would be for position making.
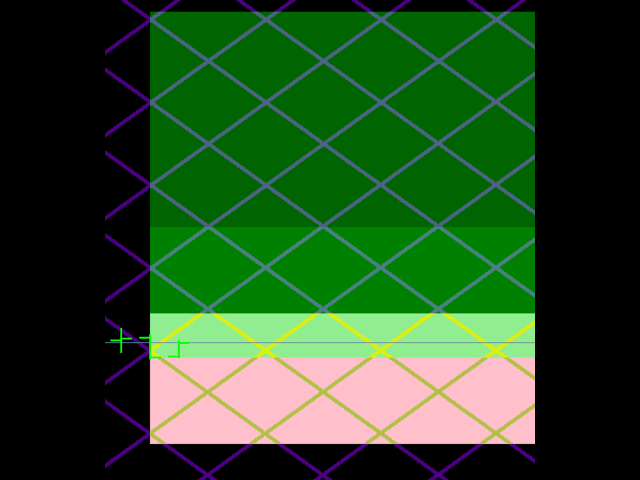
Tighter/Smaller boxes in this matter are typical for the time period of sideways movement of long duration which happen during consolidation and low volumes. Conversely, a much larger box is present when there are more participants in the market, creating more volatility. When volume rises, it stretches the Risk2Reward Box out more. Volatility enables the size adjustment of the Risk-Reward Boxes. This matters because it determined how large or small the R-R boxes can be! Altogether, it is alterable with the settings, customizable to your preferred position closure and how far back (Time period/days accounted for) the boxes can attain (for your advancement).
Multiplier via MATR expander
"Multiplier via MATR expansion" regards the enlargement of the ATR by multiplying it, purposely to have a larger average true range value. This would give a wider range distance toward "Take Profit | Stop Loss"
= Be aware and keep note of where the last candlestick ended and where the current candlestick is. =
=Don't switch timeframes while having this on or the Risk2Reward MATR will delete itself =
Remember you had accepted the Trading Risk Disclaimer / Terms and Conditions of Trading:
Your trades are yours and yours alone. The maker of this product does not physically partake into your manual positions nor is there any attachment than the use of the product. All wins are your wins, so as to losses involved.

