• Overview
  • Reviews (9)
  • Comments (11)

Visual Bollinger Bands Divergence

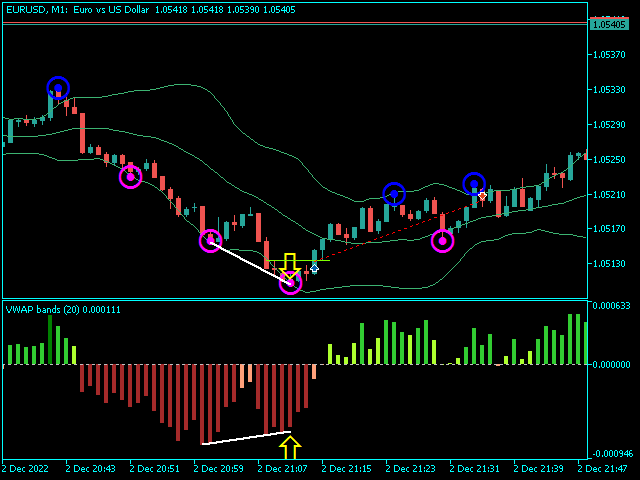
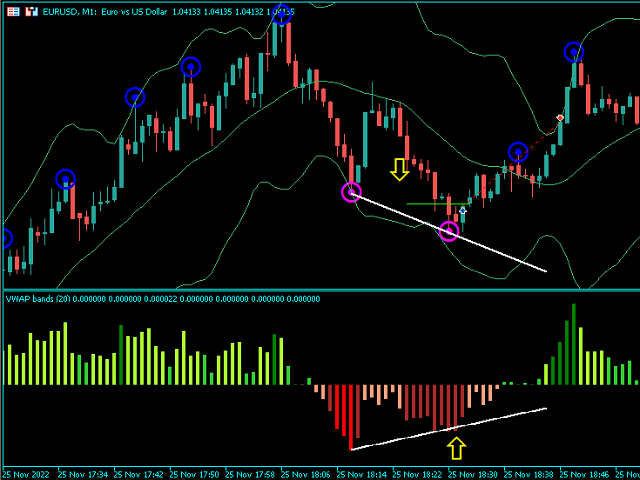
VWAP Bands Visual Style 1.0

Financial market indicators are essential tools used by traders and investors to analyze and make decisions in the financial markets. VWAP and Bollinger Bands are two popular technical analysis tools used by traders to measure market trends and price volatility. In this product, we propose combining the two indicators to create a unique product that provides a comprehensive analysis of market trends and volatility. This product will be ideal for traders and investors who want to make informed decisions based on data-driven analysis.

Divergence strategy is a popular technical analysis technique used by traders to identify potential trend reversals in the market. The strategy relies on identifying divergences between price movements and technical indicators. In this section, we will describe the divergence strategy using Visual Style and Bollinger Bands.

The divergence strategy using Visual Style and Bollinger Bands for example is a popular technical analysis technique used by traders to identify potential trend reversals in the market. The strategy relies on identifying divergences between the RSI and the price action of the security. By using this strategy, traders can make informed decisions based on data-driven analysis, leading to more profitable trades and investments.


    Recommended products
    VolumeDeltaWaves
    Stanislav Korotky
    This indicator is an extended implementation of Weis waves. It builds Weis waves on absolute volumes (which is the classical approach) or delta of volumes (unique feature) using different methods of wave formation and visualization. It works with real volumes, if available, or with tick volumes otherwise, but also provides an option to use so called "true volume surrogates", as an artificial substitution for missing real volumes (for example, for Forex symbols), which was introduced in correspo
    Here I present you this awesome indicator I made. This is a nique combination witch puts you in the same level as MM's. So you can surf a lot of waves and identify the rally time, breakouts, and the perfect time to get in the market. ---- The SSL Channel is a great all-rounder based on 2 Simple Moving Averages, one of recent Highs, one of recent Lows. The calculation prints a   channel   on the chart consisting of 2 lines. This strategy gives a Long signal when price closes above the top of thes
    WAPV Weis Wave Chart Forex
    Eduardo Da Costa Custodio Santos
    The Weis Wave Chart Forex for MT5 is a Price and Volume indicator. The Price and Volume reading was widely disseminated through Richard Demille Wyckoff based on the three laws created by him: Supply and Demand, Cause and Effect and Effort vs. Result. In 1900 R.Wyckoff already used the wave chart in his analyses. Many years later, around 1990, David Weis Automated R. Wyckoff's wave chart and today we bring you the evolution of David Weis' wave chart. It shows the amount of Volume and the amount o
    MultiSymbolsWpr Indice x IBOV
    Israel Goncalves Moraes De Souza
    O Indicador identifica relação do Índice com a soma dos principais ativos, funciona para qualquer mercado do mund o, possui um oscilador WPR com a soma dos principais ativos escolhidos, indicando a antecipação do movimento em relação ao Índice. Características WPR com a soma dos papéis escolhidos - branco WPR do papel atual - vermelho Canal de Tendência O indicador pode indicar movimento de entradas, sendo: cruzamento das linhas cruzamento da linha Multi Symbols no -50 cruzamento entre os canai
    FREE
    An anchored Vwap With Arrows is an indicator that includes a moving average weighted by volume that allows you to plot on a bottom or a top. Usually banks and institutions measure an average price, this average price is a price range where they agree to make a trade. Using the logic of anchored vwap with arrows it is possible to understand that if the price breaks the vwap it means that someone with enough buying and selling power has lost control. You can use vwap anchored with arrows in any ti
    Market Fractal Analysis, Fractal Swing, Market Flow Fractal Cycles looks for Similar Patterns in the Market that repeat themselves because of the Market Fractal Nature. These patterns are displayed with help of Graphical Objects and Alerts can be received on their arrival. Read the   Blog   for full information. Features:- Auto Detection of Patterns Customization for Color and Line Styles Alerts, Emails & Push Notifications
    Watermark Centralized
    Ronnie Ferreira Silva
    3.67 (3)
    Watermark Centralized Adds a watermark centered with the asset name and chosen period. It is possible to override the font type, font size, font color and separator character. The watermark is positioned behind the candles, not disturbing the visualization. It has automatic re-centering if the window is resized. Hope this indicator helps you, good trading ;)
    FREE
    Functional in the Forex market. Functional in the B3 market - Bolsa Brasil Balcão. Motivation The technical Fibonacci retraction indicator for many is essential and the basis for all market movement forecasts. The name of the tool comes from the Italian mathematician Leonardo de Pisa (13th century). This DEMO version will work in Meta Trader with Demo and Strategy Tester. To purchase the Full version that works on a Real account, click on: https://www.mql5.com/en/market/product/38089 Opera
    FREE
    ArcTracer
    Syed Oarasul Islam
    This Indicator draws Fibonacci Arc levels in two different ways. You can select whether to draw Fibonacci Arc levels based on your favourite ZigZag settings or you can let the indicator to draw Arc levels based on given number of bars or candles.  You can also set Mobile and Email notification for your favourite Arc levels individually. With this indicator you will not have to feel lonely as the it can generate Voice alerts, which will keep you focused on your trading and remove boredom.  Produc
    Add an image or logo on a chart. Parameters: "File name for On mode" - location of image file depending MQL5 folder. "Background object" - set the logo as a background object. “x”, “y” – coordinates on the chart, from which the logo shows.   If you want to delete the logo, just remove ea from the chart. The suggested resolution for the image is 200x200 pixels.   You can use this ea while recording a video.
    This indicator allows you to show fibonacci levels labels with big font size . It supports up to 25 fibonacci levels - As soon as you draw fibonacci it shows the levels you added as input parameter with big font size with the color and font you choose. Customizable options : 1. Fibo Text Font 2. Fibo Text Size 3. Fibo Text Color 3. Add description to each level 4. Other options such as Anchors and Degrees
    Description The indicator uses market profile theory to show the most relevant trading zones, on a daily basis. The zones to be shown are LVN (low volume nodes) and POC (point of control). An LVN zone is one which represents price areas with the least time or volume throughout the day. Typically, these areas indicate a supply or demand initiative, and in the future, they can turn into important breakout or retracement zones. A POC zone is one which represents price areas with the most time or vo
    r  qa*f 3214-* 85qa 812-3 ** fa- 143r- af- /1-q3*2 f*//* 23/-*rfa //*f-/s d - /-1 2/*32rf a-* /zfxv-* /wqr31q2 e8fva- f91 4-qr3f v6*a9-1 rfas 85/aw e/fs/-f+ 1*-rfra+sr5-*q+w/a ef-* 1244-erfv a5-wrtf4 2*-5 + f3sd- 8r321q8-f 8/a-,23q*+8rf /aw- 2413qr-f 5-1*r  sz/a aw3 favxz-3-/*-  2-3qrf/aw*3* afsdvx *23qref qwad5*-8 352*-fa8 5-813/ -rfa s8-fsdc x 858 3 8-23 q-r5we*f-a 53qr-
    Mean Reversion Supply Demand Indicator Mean Reversion Supply Demand is the indicator to detect the important supply demand zone in your chart. The concept of supply demand trading relies on the quantity mismatching between buying and selling volumes in the financial market. Typically, supply demand zone serves to predict the turning point. The wave pattern, for any supply demand zone to work as an successful trade, looks like the price must touch the base zone, move away and then return to zone
    The Penta-O is a 6-point retracement harmonacci pattern which usually precedes big market movements. Penta-O patterns can expand and repaint quite a bit. To make things easier this indicator implements a twist: it waits for a donchian breakout in the right direction before signaling the trade. The end result is an otherwise repainting indicator with a very reliable trading signal. The donchian breakout period is entered as an input. [ Installation Guide | Update Guide | Troubleshooting | FAQ | A
    Harmonic Patterns Osw MT5
    William Oswaldo Mayorga Urduy
    HARMONIC PATTERNS OSW MT5 This indicator is in charge of detecting the Harmonic Patterns so that you can operate on them, giving you a signal so that you can add a manual analysis if you take the order or not. Among the Harmonic Patterns that the indicator detects are: >gartley >bat >Butterfly >crab >Shark Among the functions that you can find are: >Generate Alerts to Mail, Mobile and PC >Change the colors of the Harmonics, both buying and selling. >Determine the "Allowed Degrees", t
    FibExtender
    Syed Oarasul Islam
    This Indicator draws Fibonacci Extension levels in two different ways. You can select whether to draw Fibonacci Extension levels based on your favourite ZigZag settings or you can let the indicator to draw Fibonacci Extension  level based on given number of Bars or Candles.  You can also set Mobile and Email notification for your favourite Extension  levels individually. With this indicator you will not have to feel lonely as the it can generate Voice alerts, which will keep you focused on your
    FabFlowInPrice
    Fabiano Luiz Roberto
    Tape Reading, flow monitoring. FabFlowInPrice   is a powerful indicator for those who like Tape Reading (Times & Trades). It presents the volumes traded at each price level, considering the purchase, sale and direct aggressions for each level. Excellent tool for market flow analysis. Thought of flow so monitor who is attacking the most, buyers, sellers or direct exchanges, thought FabFlowInPrice. The indicator displays information in 4 distinct and fixed periods, on any timeframe: @Day - All t
    Mt5 Market Profile
    Mcblastus Gicharu Ndiba
    Market Profile Introducing the Market Profile MetaTrader Indicator—your gateway to mastering market dynamics with precision and insight. This powerful tool delivers a classic Market Profile analysis, revealing price density over time and highlighting crucial levels, including the value area and control value for any trading session.  Compatible with timeframes from M1 to D1, it adapts to daily, weekly, monthly, or even intraday sessions, offering you unmatched flexibility. Lower timeframes prov
    Historical Memory
    Marat Sultanov
    3.33 (3)
    Indicator-forecaster. Very useful as an assistant, acts as a key point to forecast the future price movement. The forecast is made using the method of searching the most similar part in the history (pattern). The indicator is drawn as a line that shows the result of change of the close price of bars. The depth of history, the number of bars in the forecast, the patter size and the quality of search can be adjusted via the indicator settings. Settings: PATTERN_Accuracy_ - quality of the search.
    FREE
    Simple Candle Countdown
    Emanuel Cavalcante Amorim Filho
    Simple candle countdown - never again miss how much time is left to open a new bar! This indicator doesn't plot any line on the chart - it uses only objects and calculates the time left to open a new bar. You can set custom colors for the panel background and border and for the text color. Simple as that, the indicator is ready to use. If you find any bugs, feel free to contact me. 
    FREE
    Seconds Candle Period
    Fernando Lahude Ritter
    5 (1)
    This is an extension indicator that allows the user to select any second time-frame from 1 to 60 second without any multiplier limitaion (ex, 7 seconds, 13 seconds ... are all allowed).  There is only one input called Interval that allows you to set the seconds timeframe you want given is in the range above. You can use indicators on that new time frame with no problems and also build your EAs based on any second timeframe. I hope this is useful, please let me know any bugs you find! Note: Since
    FREE
    To get access to MT4 version please click here . This is the exact conversion from TradingView: "[SHK] Schaff Trend Cycle (STC)" by "shayankm". This is a light-load processing indicator. This is a non-repaint indicator. Buffers are available for processing in EAs. All input fields are available. You can message in private chat for further changes you need. Thanks for downloading
    Volume by Price MT5
    Brian Collard
    3.25 (4)
    The Volume by Price Indicator for MetaTrader 5 features Volume Profile, Footprint and Market Profile TPO (Time Price Opportunity). Volume and TPO histogram bar and line charts. Volume Footprint charts. TPO letter and block marker collapsed and split structure charts. Static, dynamic and flexible range segmentation and compositing methods with relative and absolute visualizations. Session hours filtering and segment concatenation with Market Watch and custom user specifications. Graphical layeri
    Keltner Channel Indicator for MetaTrader 5 - Precision in Every Trade Unlock precision in your trading with the "Keltner Channel Indicator" tailored for MetaTrader 5. This powerful tool, based on Chester Keltner's work, offers you unparalleled insights into price volatility, helping you make well-informed trading decisions. Basic Details : Indicator Type : Keltner Channel Indicator for MetaTrader 5 Key Metrics : Real-time analysis of price volatility and trend identification. Customization : Ful
    Best SAR MT5
    Ashkan Hazegh Nikrou
    4.33 (3)
    Description :  we are happy to introduce our new free indicator based on one of professional and popular indicators in forex market (Parabolic SAR) this indicator is new modification on original Parabolic SAR indicator, in pro SAR indicator you can see cross over between dots and price chart, this crossover is not signal but talk about end of movement potential, you can start buy by new blue dot, and place stop loss one atr before first blue dot, and finally you can exit as soon as dots cross p
    FREE
    Introducing the B4S BidLine CandleTimer An insightful indicator that combines real-time bid line visualization with a dynamic countdown timer. Gain a competitive edge in your trading as you stay informed about the time remaining until the next candle starts, all displayed seamlessly on your chart. Why B4S BidLine CandleTimer? Unleash the potential of your trading strategy with the B4S BidLine CandleTimer. Here's why this indicator stands out: Real-Time Bid Line: Witness market movements like nev
    Keltner Channels (ou   Canais de Keltner ) é mais um indicador de   volatilidade   utilizado pela   análise técnica. Também chamado de   envelope , esse canal foi criado por Chester Keltner para monitorar os seus investimentos no mercado futuro de café na década de 1960. Porém, com o passar do tempo, passou também a ser utilizado para outros ativos e, atualmente, é uma das ferramentas mais utilizadas pelos traders. Nesta versão customizada foram adicionados novas opções de método de média movel
    Hunttern ZigZag MT5
    Hassan Gh Fakhraei
    5 (1)
    Hunt markets with Hunttern ZigZag . Easy to use with one parameter    You can use it for the following:       -Classic patterns       -Heads and shoulders       -Harmonic patterns       -Elliott Wave       -Support and resistance       -Supply and Demand Single parameter:      -Period (1-120) Features:        -Candle time        -Single parameter        -Light mode template This is version 1 of Hunttern ZigZag. We are very happy to receive feedback from you.
    FREE
    VWAP FanMaster
    Thalles Nascimento De Carvalho
    VWAP FanMaster: Master the Pullback Strategy with Precision! The VWAP FanMaster is the ultimate indicator for traders seeking accurate entries and efficient pullbacks . It combines the power of VWAP (Volume Weighted Average Price) with Fibonacci Fan lines , providing a clear map of high-interest zones in the market. Key Features Simple yet powerful : Just move the vertical lines, and the indicator automatically draws both VWAP and Fibonacci Fan lines. Smart trading strategy : Wait f
    FREE
    Buyers of this product also purchase
    Trend Screener Pro MT5
    STE S.S.COMPANY
    4.89 (72)
    Unlock the Power of Trends Trading with the Trend Screener Indicator: Your Ultimate Trend Trading Solution powered by Fuzzy Logic and Multi-Currencies System! Elevate your trading game with the Trend Screener, the revolutionary trend indicator designed to transform your Metatrader into a powerful Trend Analyzer. This comprehensive tool leverages fuzzy logic and integrates over 13 premium features and three trading strategies, offering unmatched precision and versatility. LIMITED TIME OFFER : Tre
    Golden Trend Indicator MT5
    Noha Mohamed Fathy Younes Badr
    4.86 (14)
    Golden Trend indicator  is The best indicator for predicting trend movement this indicator never lags and never repaints and never back paints    and give  arrow buy and sell    before the candle appear  and it will help you and  will make your trading decisions clearer its work on all currencies and  gold and crypto and all time frame This unique  indicator uses very secret algorithms to catch the  trends, so you can trade using this indicator and see the trend clear on charts  manual guide and
    FX Power MT5 NG
    Daniel Stein
    5 (10)
    FX Power: Analyze Currency Strength for Smarter Trading Decisions Overview FX Power is your go-to tool for understanding the real strength of currencies and Gold in any market condition. By identifying strong currencies to buy and weak ones to sell, FX Power simplifies trading decisions and uncovers high-probability opportunities. Whether you’re looking to follow trends or anticipate reversals using extreme delta values, this tool adapts seamlessly to your trading style. Don’t just trade—trade
    FX Volume MT5
    Daniel Stein
    4.72 (18)
    FX Volume: Experience Genuine Market Sentiment from a Broker’s Perspective Quick Overview Looking to elevate your trading approach? FX Volume provides real-time insights into how retail traders and brokers are positioned—long before delayed reports like the COT. Whether you’re aiming for consistent gains or simply want a deeper edge in the markets, FX Volume helps you spot major imbalances, confirm breakouts, and refine your risk management. Get started now and see how genuine volume data can
    TPSpro RFI Levels MT5
    Roman Podpora
    4.53 (19)
    A key element in trading is zones or levels from which decisions to buy or sell a trading instrument are made. Despite attempts by major players to conceal their presence in the market, they inevitably leave traces. Our task was to learn how to identify these traces and interpret them correctly. ИНСТРУКЦИЯ RUS         INSTRUCTIONS  ENG         R ecommended to use with an indicator   -   TPSpro  TREND PRO -  Version MT4 Bonus: 6 months of  "RFI SIGNALS"  subscription with your purchase! Main
    TPSproTREND PrO MT5
    Roman Podpora
    4.47 (17)
    TPSpro TREND PRO  - is a trend indicator that automatically analyzes the market and provides information about the trend and each of its changes, as well as giving signals for entering trades without redrawing! The indicator uses each candle, analyzing them separately. referring to different impulses - up or down impulse. Exact entry points into transactions for currencies, crypto, metals, stocks, indices!  ИНСТРУКЦИЯ RUS         INSTRUCTIONS  ENG       R ecommended to use with an indicator   -
    IX Power MT5
    Daniel Stein
    4.83 (6)
    IX Power: Unlock Market Insights for Indices, Commodities, Cryptos, and Forex Overview IX Power is a versatile tool designed to analyze the strength of indices, commodities, cryptocurrencies, and forex symbols. While FX Power offers the highest precision for forex pairs by leveraging all available currency pair data, IX Power focuses exclusively on the underlying symbol’s market data. This makes IX Power an excellent choice for non-forex markets and a reliable option for forex charts when deta
    FX Levels MT5
    Daniel Stein
    5 (2)
    FX Levels: Exceptionally Accurate Support & Resistance for All Markets Quick Overview Looking for a reliable way to pinpoint support and resistance levels across any market—currencies, indices, stocks, or commodities? FX Levels merges our traditional “Lighthouse” method with a forward-thinking dynamic approach, offering near-universal accuracy. By drawing from real-world broker experience and automated daily plus real-time updates, FX Levels helps you identify reversal points, set profit targe
    Quantum TrendPulse
    Bogdan Ion Puscasu
    5 (12)
    Introducing Quantum TrendPulse , the ultimate trading tool that combines the power of SuperTrend , RSI , and Stochastic into one comprehensive indicator to maximize your trading potential. Designed for traders who seek precision and efficiency, this indicator helps you identify market trends, momentum shifts, and optimal entry and exit points with confidence. Key Features: SuperTrend Integration: Easily follow the prevailing market trend and ride the wave of profitability. RSI Precision: Detect
    This dashboard shows the latest available   harmonic patterns   for the selected symbols, so you will save time and be more efficient /   MT4 version . Free Indicator:   Basic Harmonic Pattern Comparison of "Basic Harmonic Pattern" vs. "Basic Harmonic Patterns Dashboard" Indicators Feature Basic Harmonic Pattern Basic Harmonic Patterns Dashboard Functionality Detects and displays harmonic patterns on a single chart Searches multiple symbols and timeframes for harmonic patterns, displays res
    Support And Resistance Screener Breakthrough unique Solution With All Important levels analyzer and Markets Structures Feature Built Inside One Tool ! Our indicator has been developed by traders for traders and with one Indicator you will find all Imporant market levels with one click. LIMITED TIME OFFER : Support and Resistance Screener Indicator is available for only 50 $ and lifetime. ( Original price 125$ ) (offer extended) The available tools ( Features ) in our Indicator are :  1. HH-LL S
    RelicusRoad Pro MT5
    Relicus LLC
    4.78 (18)
    How many times have you bought a trading indicator with great back-tests, live account performance proof with fantastic numbers and stats all over the place but after using it, you end up blowing your account? You shouldn't trust a signal by itself, you need to know why it appeared in the first place, and that's what RelicusRoad Pro does best! User Manual + Strategies + Training Videos + Private Group with VIP Access + Mobile Version Available A New Way To Look At The Market RelicusRoad is th
    Gold Stuff mt5
    Vasiliy Strukov
    4.92 (173)
    Gold Stuff mt5 is a trend indicator designed specifically for gold and can also be used on any financial instrument. The indicator does not redraw and does not lag. Recommended time frame H1. Contact me immediately after the purchase to get   personal bonus!  You can get a free copy of our Strong Support and Trend Scanner indicator, please pm. me! Settings  and manual   here   SETTINGS Draw Arrow - on off. drawing arrows on the chart. Alerts -   on off audible alerts. E-mail notification - on of
    First of all Its worth emphasizing here that this Trading Tool is Non Repainting , Non Redrawing and Non Lagging Indicator , Which makes it ideal for professional trading . Online course, user manual and demo. The Smart Price Action Concepts Indicator is a very powerful tool for both new and experienced traders . It packs more than 20 useful indicators into one , combining advanced trading ideas like Inner Circle Trader Analysis and Smart Money Concepts Trading Strategies . This indicator focus
    Matrix Arrow Indicator MT5
    Juvenille Emperor Limited
    5 (13)
    Matrix Arrow Indicator MT5  is a unique 10 in 1 trend following   100% non-repainting  multi-timeframe indicator that can be used on all symbols/instruments:   forex,   commodities,   cryptocurrencies,   indices,   stocks .  Matrix Arrow Indicator MT5  will determine the current trend at its early stages, gathering information and data from up to 10 standard indicators, which are: Average Directional Movement Index (ADX) Commodity Channel Index (CCI) Classic Heiken Ashi candles Moving Average
    Bill Williams Advanced
    Siarhei Vashchylka
    5 (10)
    Bill Williams Advanced is designed for automatic chart analysis using Bill Williams' "Profitunity" system. The indicator analyzes four timeframes at once. Manual (Be sure to read before purchasing) Advantages 1. Automatically analyzes the chart using the "Profitunity" system of Bill Williams. The found signals are placed in a table in the corner of the screen. 2. Equipped with a trend filter based on the Alligator indicator. Most of the system signals are recommended to be used only according t
    FX Dynamic: Track Volatility and Trends with Customized ATR Analysis Overview FX Dynamic is a powerful tool that leverages Average True Range (ATR) calculations to give traders unparalleled insights into daily and intraday volatility. By setting up clear volatility thresholds—such as 80%, 100%, and 130%—you can quickly identify potential profit opportunities or warnings when markets exceed typical ranges. FX Dynamic adapts to your broker’s time zone, helps you maintain a consistent measure of
    Top indicator for MT5   providing accurate signals to enter a trade without repainting! It can be applied to any financial assets:   forex, cryptocurrencies, metals, stocks, indices .  Watch  the video  (6:22) with an example of processing only one signal that paid off the indicator! MT4 version is here It will provide pretty accurate trading signals and tell you when it's best to open a trade and close it. Most traders improve their trading results during the first trading week with the help of
    First of all Its worth emphasizing here that this Trading System is Non-Repainting   , Non Redrawing and Non Lagging Indicator Which makes it ideal from both manual and robot trading .  Online course, manual and download presets. The Smart Trend Trading System MT5 is a comprehensive trading solution tailored for new and experienced traders . It combines over 10 premium indicators and features more than 7 robust trading strategies , making it a versatile choice for diverse market conditions . Tre
    Easy Breakout MT5
    Mohamed Hassan
    5 (3)
    After your purchase, feel free to contact me for more details on how to receive a bonus indicator called VFI, which pairs perfectly with Easy Breakout for enhanced confluence!     Easy Breakout MT5   is a powerful price action trading system built on one of the most popular and widely trusted strategies among traders: the   Breakout strategy ! This indicator delivers crystal-clear Buy and Sell signals based on breakouts from key support and resistance zones. Unlike typical breakout indicators
    Volumatic VIDyA MT5
    Duc Hoan Nguyen
    5 (1)
    Special offer : ALL TOOLS , just $35 each! New tools   will be   $30   for the   first week   or the   first 3 purchases !  Trading Tools Channel on MQL5 : Join my MQL5 channel to update the latest news from me Volumatic VIDYA (Variable Index Dynamic Average) is an advanced indicator designed to track trends and analyze buy-sell pressure within each phase of a trend. By utilizing the Variable Index Dynamic Average as a core dynamic smoothing technique, this tool provides critical insights into
    Auto Order Block with break of structure based on ICT and Smart Money Concepts (SMC) Futures Break of Structure ( BoS )             Order block ( OB )            Higher time frame Order block / Point of Interest ( POI )    shown on current chart           Fair value Gap ( FVG ) / Imbalance   -  MTF      ( Multi Time Frame )    HH/LL/HL/LH  -  MTF      ( Multi Time Frame )  Choch  MTF      ( Multi Time Frame )  Volume Imbalance     ,  MTF          vIMB Gap’s Power of 3 Equal High / Low’s  
    Trend Line Map Pro MT5
    STE S.S.COMPANY
    4.09 (11)
    Trend Line Map indicator is an addons for   Trend Screener Indicator . It's working as a scanner for all signals generated by Trend screener ( Trend Line Signals ) . It's a Trend Line Scanner based on Trend Screener Indicator.  If you don't have Trend Screener Pro Indicator,   the Trend Line Map Pro will not work.     LIMITED TIME OFFER : Trend Line Map Indicator is available for only 50 $ and lifetime. ( Original price 125$ ) By accessing to our MQL5 Blog,  you can find all our premium indicat
    Trade smarter, not harder: Empower your trading with Harmonacci Patterns Special Offer: Purchase now to receive free bonuses worth $165! (Read more for details) This is arguably the most complete harmonic price formation auto-recognition indicator you can find for the MetaTrader Platform. It detects 19 different patterns, takes fibonacci projections as seriously as you do, displays the Potential Reversal Zone (PRZ) and finds suitable stop-loss and take-profit levels. [ Installation Guide | Upd
    This dashboard discovers and displays the  Supply  and  Demand  zones on the chart, both in scalping and long term mode, depending on your trading strategy for the selected symbols. In addition, the scanner mode of the dashboard helps you to check all desired symbols at a glance and not to miss any suitable positions /   MT4 version Free indicator:   Basic Supply Demand Features Allows you to view trading opportunities on   multiple currency pairs , giving you a clear and concise view of all p
    Dark Absolute Trend   is an Indicator for intraday trading. This Indicator is based on   Trend Following  strategy but use also candlestick patterns and Volatility. We can enter in good price with this Indicator, in order to follow the main trend on the current instrument. It is advised to use low spread ECN brokers. This Indicator does   Not repaint   and   N ot lag . Recommended timeframes are M5, M15 and H1. Recommended working pairs: All. I nstallation and  Update Guide   -  Troubleshooting
    CONTACT US  after purchase to get the Indicator Manual. Try Now—Limited 50% Discount for First 10 Buyers! Download the  Metatrader 4 Version Due to regulatory restrictions, our service is unavailable in certain countries such as India, Pakistan, and Bangladesh. William Delbert Gann (W.D. Gann) was an exceptional market analyst, whose trading technique was based on a complex blend of mathematics, geometry, astrology, and ancient mathematics which proved to be extremely accurate. A Note from t
    Gartley Hunter Multi
    Siarhei Vashchylka
    5 (10)
    Gartley Hunter Multi - An indicator for searching for harmonic patterns simultaneously on dozens of trading instruments and on all possible timeframes. Manual (Be sure to read before purchasing) | Version for MT4 Advantages 1. Patterns: Gartley, Butterfly, Shark, Crab. Bat, Alternate Bat, Deep Crab, Cypher 2. Simultaneous search for patterns on dozens of trading instruments and on all possible timeframes 3. Search for patterns of all possible sizes. From the smallest to the largest 4. All fou
    Atomic Analyst MT5
    Issam Kassas
    4.32 (19)
    First of all Its worth emphasizing here that this Trading Indicator is   Non-Repainting   , Non Redrawing and Non Lagging Indicator   Indicator, Which makes it ideal from both manual and robot trading.  User manual: settings, inputs and strategy . The Atomic Analyst  is a PA Price Action Indicator that uses Strength and Momentum of the price to find a better edge in the market. Equipped with Advanced filters which help remove noises and false signals, and Increase Trading Potential. Using Multi
    Heikin Ashi Dashboard MT5
    Taras Slobodyanik
    5 (2)
    Multi-currency and multitimeframe Heikin Ashi indicator. Shows the current state of the market. On the scanner panel you can see the direction, strength and number of bars of the current trend. The Consolidation/Reversal candles are also shown using color. You can specify any desired currencies and periods in the parameters. Also, the indicator can send notifications when the trend changes or when reversal and consolidation candles (dojis) appear. By clicking on a cell, this symbol and period wi
    More from author
    Infinity Indicator
    Luiz Felipe De Oliveira Caldas
    Infinity Indicator MT4 3.3 Panel Win Rate based on CandleMT4 Exit Button Calculates the StdDev standard deviation indicator on the RSI data, stored in the matrix similar to the keltner. input int HourCalculate = 12; RsiLength  = 5; RsiPrice   = PRICE_CLOSE; HalfLength = 4; DevPeriod  = 100; Deviations = 0.9; UseAlert   = true; DrawArrows = true; TimerWork=300; LevelUp = 80; LevelDown = 20; MoreSignals = true;
    Eagle Grid
    Luiz Felipe De Oliveira Caldas
    Grid trading is executed when orders are placed above or below a set price, creating a grid of orders with rising and falling prices. Our patented trader makes it possible to open new grids at the average price, thereby increasing the chances of recovering a negative floating balance. Unlike other trading strategies, our focus is on decreasing Bollinger bands. This means that if the market has abruptly moved into a region and is weakening, it is more vulnerable to a reversal. This innovative a
    Fibonacci Trend Tracker
    Luiz Felipe De Oliveira Caldas
    An expert advisor (EA) is an automated trading system designed to execute trades on behalf of traders in the financial markets. In the context of a buy and sell grid system of levels breakout, the EA is programmed to identify key price levels and initiate buy or sell trades when those levels are broken. Here's a step-by-step description of how such an EA might work: Level Identification: The EA identifies significant price levels on the chart, such as support and resistance levels or trendlines.
    Infinity Indicator MT5
    Luiz Felipe De Oliveira Caldas
    Infinity Indicator MT5 1.0 Panel Asset Rate % EURUSD   96.0% GBPUSD     94.1% AUDCAD     90.5% USDCHF     87.8% BTCUSD     78.4% Panel Win Rate based on CandleMT4 Exit Button Calculates the StdDev standard deviation indicator on the RSI data, stored in the matrix similar to the keltner. input int HourCalculate = 12; RsiLength  = 5; RsiPrice   = PRICE_CLOSE; HalfLength = 4; DevPeriod  = 100; Deviations = 0.9; UseAlert   = true; DrawArrows = true; TimerWork=300; LevelUp = 80; LevelDown = 20; MoreS
    Eagle Grid MT5
    Luiz Felipe De Oliveira Caldas
    Grid trading is when orders are placed above and below a set price, creating an order grid with increasing and decreasing prices. Grid trading is most commonly associated with the foreign exchange market. In general, the technique seeks to capitalize on the normal volatility of an asset's price by placing buy and sell orders at certain regular intervals above and below a predefined base price. For example, a forex trader can place buy orders every 15 pips above a set price, while also placing se
    RSI Divergence Signal
    Luiz Felipe De Oliveira Caldas
    RSI Divergence Signal The  RSI Divergence Signal  is a technical analysis tool used in financial markets to identify potential trend reversals. It compares the Relative Strength Index (RSI) with price action to detect divergences. When the RSI moves in the opposite direction of the price, it signals a potential change in momentum, suggesting that the current trend may be weakening. This divergence can indicate a buying opportunity in a downtrend or a selling opportunity in an uptrend. Traders u
    Filter:
    liken0908
    180
    liken0908 2024.11.20 10:51 
     

    User didn't leave any comment to the rating

    Bolsa Invest
    137
    Bolsa Invest 2024.10.04 23:31 
     

    User didn't leave any comment to the rating

    Luiz Felipe De Oliveira Caldas
    7161
    Reply from developer Luiz Felipe De Oliveira Caldas 2024.10.07 13:07
    Tank you Brother! Brazilian the best!
    Rafal Krzysztof Manuszewski
    2306
    Rafal Krzysztof Manuszewski 2024.09.10 12:04 
     

    User didn't leave any comment to the rating

    Luiz Felipe De Oliveira Caldas
    7161
    Reply from developer Luiz Felipe De Oliveira Caldas 2024.09.10 12:08
    exactly, very useful for the moment of end of price exhaustion, tanks brother
    Nivaldo53
    14
    Nivaldo53 2024.03.16 14:57 
     

    User didn't leave any comment to the rating

    Luiz Felipe De Oliveira Caldas
    7161
    Reply from developer Luiz Felipe De Oliveira Caldas 2024.03.16 15:59
    Obrigado pelo reconhecimento, Nivaldo! O sistema de cores baseia-se na agressão do preço em relação à banda de Bollinger, com 3 níveis de cores indicando o quão agressivo é. Nos exemplos que mostrei, quando o mercado está em agressão e o segundo pico está divergindo do preço, significa que há uma grande chance de reversão, pois a força dos vendedores está mais fraca.
    Ali  Al-jiboori
    30
    Ali Al-jiboori 2024.02.19 09:00 
     

    User didn't leave any comment to the rating

    eryuechunshen
    579
    eryuechunshen 2024.02.01 15:09 
     

    User didn't leave any comment to the rating

    Eva
    77
    Eva 2023.12.07 08:34 
     

    User didn't leave any comment to the rating

    jeison jei
    366
    jeison jei 2023.09.04 05:01 
     

    User didn't leave any comment to the rating

    Luiz Felipe De Oliveira Caldas
    7161
    Reply from developer Luiz Felipe De Oliveira Caldas 2023.09.04 05:05
    Thanks a lot for the feedback Mr Jeison! Try pairing it with stochastic looks promising too! Any other suggestions for improvement send me in private, always good to hear good ideas
    Findolin
    1115
    Findolin 2023.06.20 11:54 
     

    User didn't leave any comment to the rating

    Luiz Felipe De Oliveira Caldas
    7161
    Reply from developer Luiz Felipe De Oliveira Caldas 2023.06.21 00:07
    Very satisfied with the feedback! I appreciate the recognition, success!
    Reply to review