UPD1 Murrey Math Combo Levels
- Indicators
- Vitaliy Kuznetsov
- Version: 2.52
- Updated: 1 January 2025
- Activations: 20
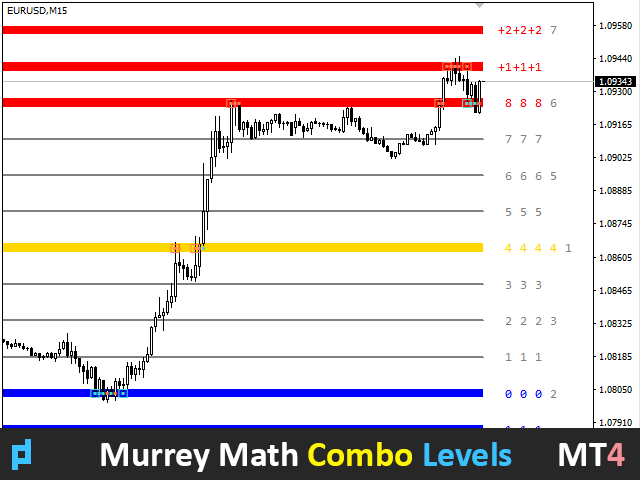
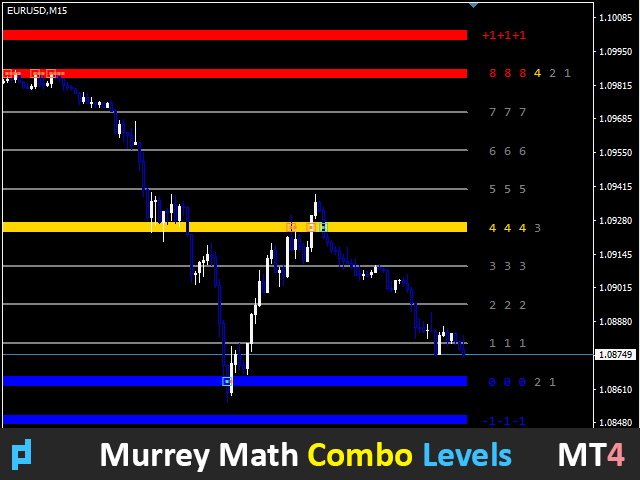
The meaning of this indicator is to find Murray levels on all timeframes and combine them into combo levels, including signal levels based on strong Murray levels (+2, +1, 8, 4, 0, -1, -2).
The lower the timeframe, the more chances you have to see the combo level immediately. It will be highlighted in color.
When you hover over any number, a hint will pop up to which timeframe the level belongs to. But you will always see the current timeframe as the leftmost one.
A smart alert will help you inform about the price touching the signal combo level.
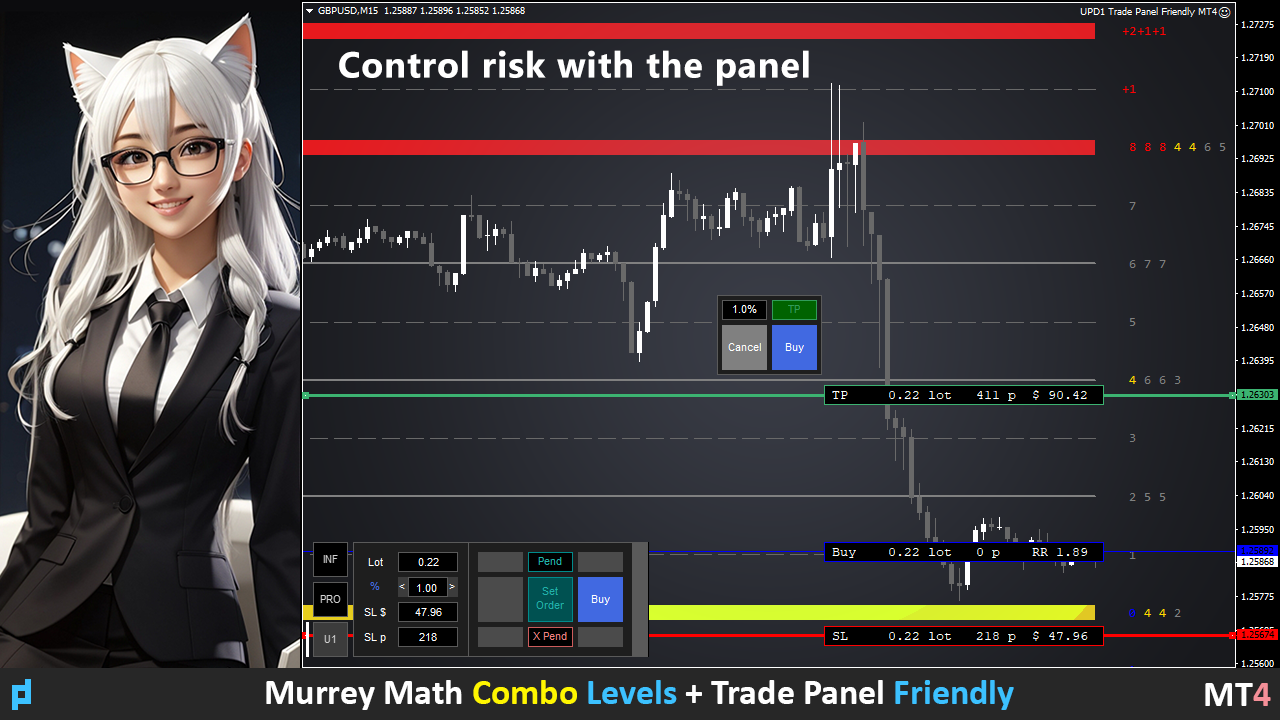
Dashboard from video is not a declared functionality and is not included here! Still in development.
Trading recommendations.
It is not recommended to trade a rebound from combo levels without additional technical analysis.
The likelihood of a rebound in the blue and red levels is higher.
The price is magnetized to a combo level that has not yet been tested by price (128 candles ago). In this case, it is recommended to use a trend strategy with taking a level (one level higher / lower).
When the price moves towards the red or blue level, yellow does not trade on the bounce along the way (it can break the momentum).
Beginners are strongly discouraged from trading a bounce from a combo-level if there is no opposite combo-level.
It is preferable to trade with a bounce to the trend.
Get more information in Blog-Link - Murrey Math Trading with UPD1.
Description of settings.
Main Settings.
Period - number of candles for calculating levels.
Length - length of level objects in bars.
Do Not Calc M30 if Timeframe Lower - do not count levels from M30 timeframe (disabled). With the setting enabled, the combo levels will become smaller, but the quality will theoretically increase.
Do Not Calc MN (Easier Loading of Quotes) - if the currency is not loaded, the quotes can be loaded for 40 seconds (MetaTrader5). But if we exclude the timeframe of a Month, then the download speed of quotes takes 10 seconds. This is only when the indicator is loaded for the first time.
Button.
Visual Button - whether or not to display the button.
Corner - select anchor angle.
Indent X - x-axis offset in pixels.
Indent Y - y-axis offset in pixels.
Label Visual.
Label Visual - whether or not to display the level label.
Label Font Size - specify font size.
Label Shift Bars - set the indent in bars from the level.
Label Tooltip - whether or not to display a tooltip when hovering over a level.
Settings Simple and Combo Levels.
Simple Line Width - specify the thickness of lines that are not combos.
Simple Line Color - specify the color of the lines.
Simple Line Style - choose a line drawing style (dots, dashes, and more).
Number Of Levels - specify the number of levels (number) required to mark this combo level (not signal).
Line Width - specify the thickness of lines.
Line Color - specify the color of the lines.
Number Of Signal Levels - indicate the number of signal levels (number) required to indicate this combo level.
Combo Line Width - signal combo level thickness.
Signal Combo Levels - levels separated by commas, which we consider signal. Namely, if there are more than 3 of them in any variation, we get a signal combo level.
Signal Combo Color - choose the color of the signal combo level.
Spec Combo Sell Levels - lists the extreme levels for the sell, which we consider signal for special combos.
Spec Combo Sell Color - select color special combo for sell.
Spec Combo Buy Levels - lists the extreme levels for the buy, which we consider signal for special combos.
Spec Combo Buy Color - select color special combo for buy.
Alert Settings.
Alert Type Line - select alert type (All Combo / Only Spec Combo).
Sensivity Coef - level signal zone height (0.25).
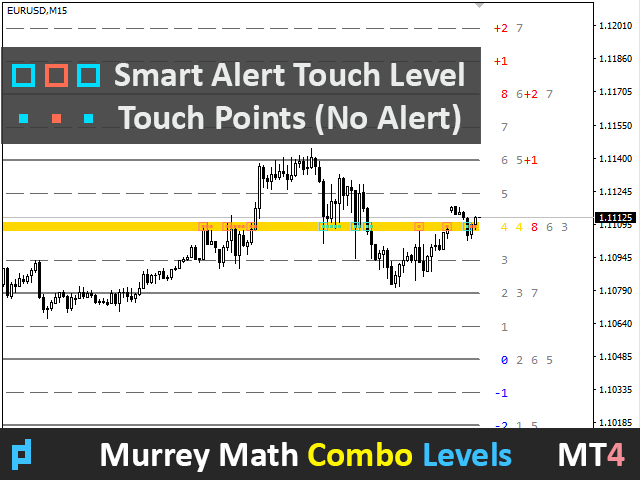
Smart Alert Touch Combo - the main setting that includes an alert when the price touches the signal level. Additionally displayed as an empty square in the center of the level.
Repeat Signal - repeated level signal on the next candle.
Show Touch Points - display of all touches by the price of signal levels. Not a signal and only works if the alert is enabled.
Alert When Levels Recalc - a separate independent alert that will notify you if Murrey's levels are rebuilt.
Alert Work Time - specify the time period when the alert will be active.
Alert Pop Up - enable / disable alert popup.
Alert Push - enable / disable notification to phone.
Alert Email - enable / disable email notification.
Alert Sound - enable / disable sound notification.
Alert Sound Name - select sound alert file.
Other Settings.
Label Number - choose color.
Object id (Combo Levels) - prefix to the name of the object.


Very Great. Thank you.