Hyper Renko
- Indicators
- Rodrigo Matheus da Silva
- Version: 1.1
- Updated: 26 July 2020
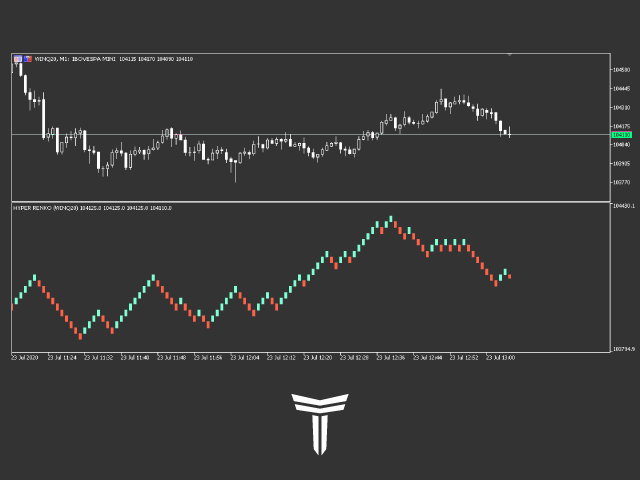
Renko is a timeless chart, that is, it does not take into account the time period, but the price change, which makes the price change on the chart clearer.
Hyper Renko is the indicator that provides this.
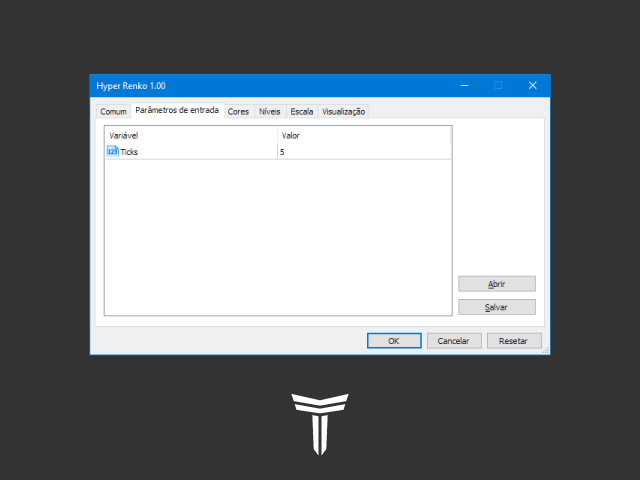
To configure, you only have one parameter, the size of the candle in the tick * you want to use.
* tick: is the smallest possible variation of an asset.
Thank you for choosing a Hyper Trader indicator.
Wikipedia:
A renko chart indicates minimal variation in the value of a variable - for example the price of a financial asset - over time. The graph advances in time only when the value being considered (e.g. the price) varies by a certain minimum quantity. For example, on a renko chart that considers a R $ 1 change in the price of an asset, a new "brick" is drawn only when that change occurs, up or down - regardless of how long it took for the variation to occur and the volume that was traded. Thus, if plotted with time on the horizontal axis and the price variation on the vertical axis, all "bricks" have the same height (same price variation), and the spacing between them, despite being visually the same, represents varying amounts of time.














muy buena