Hyper Renko
- Indikatoren
- Rodrigo Matheus da Silva
- Version: 1.1
- Aktualisiert: 26 Juli 2020
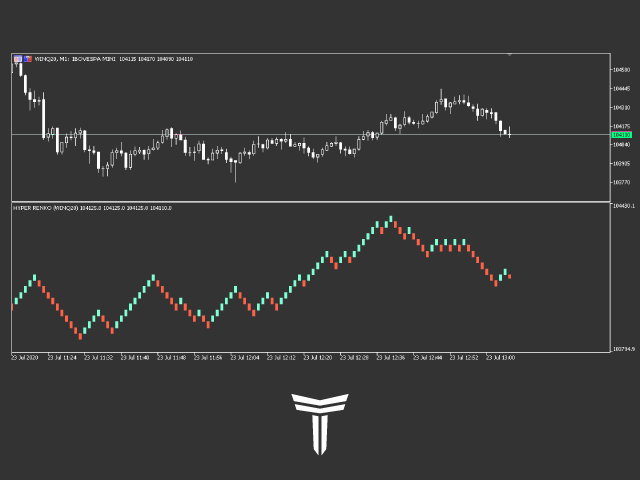
Renko ist ein zeitloses Diagramm, dh es berücksichtigt nicht den Zeitraum, sondern die Preisänderung, wodurch die Preisänderung auf dem Diagramm klarer wird.
Hyper Renko ist der Indikator, der dies liefert.
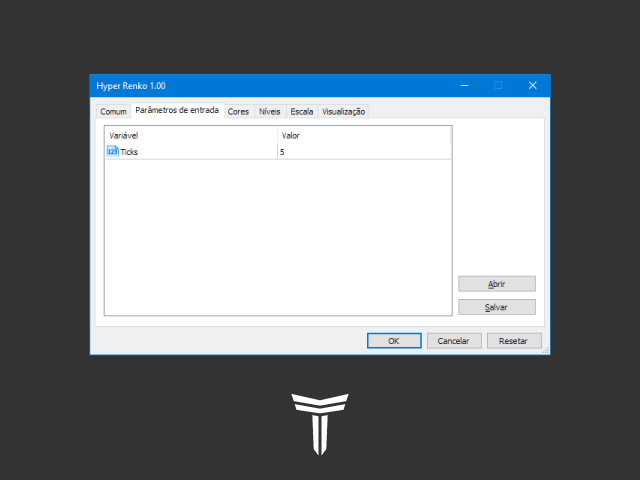
Zum Konfigurieren haben Sie nur einen Parameter, die Größe der Kerze in dem Häkchen *, das Sie verwenden möchten.
* tick: ist die kleinstmögliche Variation eines Vermögenswerts.
Vielen Dank, dass Sie sich für einen Hyper Trader-Indikator entschieden haben.
Wikipedia:
Ein Renko-Diagramm zeigt eine minimale Variation des Werts einer Variablen - beispielsweise des Preises eines finanziellen Vermögenswerts - im Zeitverlauf an. Der Graph schreitet nur dann zeitlich voran, wenn der betrachtete Wert (z. B. der Preis) um eine bestimmte Mindestmenge variiert. In einem Renko-Diagramm, das eine Änderung des Preises eines Vermögenswerts um R $ 1 berücksichtigt, wird beispielsweise nur dann ein neuer "Baustein" gezogen, wenn diese Änderung nach oben oder unten erfolgt - unabhängig davon, wie lange es gedauert hat, bis die Änderung eingetreten ist Volumen, das gehandelt wurde. Wenn also mit der Zeit auf der horizontalen Achse und der Preisschwankung auf der vertikalen Achse aufgetragen wird, haben alle "Steine" die gleiche Höhe (gleiche Preisschwankung), und der Abstand zwischen ihnen repräsentiert, obwohl er visuell gleich ist unterschiedlich viel Zeit.

muy buena