• Overview
  • Reviews (8)
  • Comments (52)
  • What's new

Moving average crossover scanner MT5

4.83

I recommend you to read the product's blog (manual) from start to end so that it is clear from the beginning what the indicactor offers.

This multi time frame and multi symbol indicator can identify the following 5 crosses:

  • when a fast moving average crosses a slow moving average line.
  • when price has reached a single moving average (closed above/below or just bounced).
  • when a triple moving average formation has appeared (all 3 MA:s in consecutive alignment)
  • when the MACD main line crosses the signal line.
  • when the signal line crosses the MACD zero(0) line.

Combined with your own rules and techniques, this indicator will allow you to create (or enhance) your own powerful system.

Features

  • Can monitor selected symbols visible in your Market Watch window at the same time. Apply the indicator to just one chart and instantly monitor the entire market.
  • Can monitor every time frame, from M1 to MN, and sends you a real-time alert when a crossover has been identified. All alert types are supported.
  • The indicator can also be used in single chart mode.
  • Can use RSI as an additional trend filter.
  • The indicator includes an interactive panel. When clicking on an item, a new chart will be opened with the symbol and time frame in question.
  • The indicator can write the signals to a file or to global variables which can be used by an Expert Advisor for auto trading.

Input parameters

Please find the description and explanation of the input parameters here.

Important

Please note that due to the multi-time frame functionality neither buy/sell advice nor MA lines will be drawn on the chart where the indicator has been installed. I strongly recommend to put the indicator on a clean (empty) chart without any other indicators on it which could interfere with the scanner.
      Reviews 8
      mGSrPCDi-j63QiG2Vdh0P
      31
      mGSrPCDi-j63QiG2Vdh0P 2025.04.11 19:01 
       

      Hello Jan, this is a good crossover indicator.

      Zeitl
      76
      Zeitl 2022.03.27 09:49 
       

      Outstanding MA crossover indicator, very versatile and reliable, highly recommended!

      Devonish
      3160
      Devonish 2021.01.15 07:14 
       

      Excellent tool. Friendly advice and support.

      Recommended products
      I  recommend you to read the   product's blog  (manual) from start to end so that it is clear from the beginning what the indicator offers. This multi time frame and multi symbol indicator scans for engulfing and tweezer formations.  The indicator can also be used in single chart mode. Combined with your own rules and techniques, this indicator will allow you to create (or enhance) your own powerful system. Features Can monitor all symbols visible in your Market Watch window at the same time. A
      I  recommend you to read the   product's blog  (manual) from start to end so that it is clear from the beginning what the indicator offers. In addition to finding bullish and bearish Three line strike formations this multi symbol and mutli time frame indicator can also scan for the following candlestick patterns (please see screenshots for explanation of the patterns): Three white soldiers (reversal>continuation pattern) Three black crows (reversal>continuation pattern) The formations do not ap
      I recommend you to read the   product's blog  (manual) from start to end so that it is clear from the beginning what the indicactor offers. This multi time frame and multi symbol trend indicator sends an alert when a strong trend or trend reversal has been identified. It can do so by selecting to build up the dashboard using Moving average (single or double (both MA:s aligned and price above/below both)), RSI, Bollinger bands, ADX, Composite index (Constance M. Brown), Awesome (Bill Williams), 
      Hammer Star
      Arkadii Zagorulko
      This powerful tool is designed to help traders identify key reversal patterns in their charts, including the hammer and star bar formations. With this indicator, you can quickly and easily spot these patterns as they form, allowing you to make well-informed trades and potentially increase your profits. The Hammer Start indicator is customizable, allowing you to set your own parameters for identifying patterns and alerts. Whether you're a seasoned trader or just starting out, the Hammer and Star
      The ABC Indicator analyzes the market through waves, impulses, and trends, helping identify key reversal and trend-change points. It automatically detects waves A, B, and C, along with stop-loss and take-profit levels. A reliable tool to enhance the accuracy and efficiency of your trading. This product is also available for MetaTrader 4 =>  https://www.mql5.com/en/market/product/128179 Key Features of the Indicator: 1. Wave and Trend Identification:    - Automatic detection of waves based on mov
      I recommend you to read the   product's blog  (manual) from start to end so that   it is clear from the beginning what the indicator offers. This multi time frame and multi symbol indicator identifies double top/bottom, head & shoulder, pennant/triangle and flag patterns. It is also possible to setup alerts only when a neckline/triangle/flagpole breakout has occured (neckline breakout = confirmed signal for top/bottoms and head & shoulders). The indicator can also be used in single chart mode.
      ATR Bands Expansion Indicator
      AL MOOSAWI ABDULLAH JAFFER BAQER
      Unlock Precision with ATR Bands Expansion Indicator The ATR Bands Expansion Indicator is your gateway to identifying dynamic price movements and breakout opportunities in the financial markets. Designed to enhance your trading strategy, this tool uses Average True Range (ATR) principles to create adaptive bands that expand and contract based on market volatility. Key Highlights: Not Optimized: This indicator is designed for you to optimize according to your trading preferences and market condit
      MarketOpenSessions is an indicator helps as a visual clue for which market session is at the time being. If you consider killzone, market open/close as important factor, this indicator would help you reduce effort in converting from one time zone to another. It has the following features 2 display styles: section (as colored line), and histogram 4 major configurable market sessions i.e. Asia, London, New York, and London-Close session. In additional to end of trading session of the day. Female s
      Levels StopTP
      Anton Polkovnikov
      LEVELS (extremes, stops, takeprofits) The indicator visualizes the levels of recent price extremes. Such values are searched for by means of an internal algorithm. It does not redraw.  It is used to change stop order placement levels (done manually by the user, the indicator only visualizes the level). It can also be used for taking partial profits at opposite levels of the movement. The indicator will allow you to take most of the strong movements. You don't have to worry about exiting a positi
      KT Tether Line MT5
      KEENBASE SOFTWARE SOLUTIONS
      The KT Tether Line is a trend-following tool consisting of three indicators that work together to generate trading signals. It can correctly identify market trends while signaling trade entries. It was first introduced by Bryan Strain in the Stock & Commodities magazine in 2000 in "How to get with the trend and out at the end." The Concept When a market trend is confirmed, the most challenging part is determining the timing of the entries. This indicator alerts you to potential trend reversals
      Aussenstab Markttechnik
      Alexander Josef Zeidler
      This indicator shows external bars ("Aussenstäbe") in the chart in candle form. The colors of the candles can be set individually. Also different colors for bearish and bullish bars are possible. In addition, the color of the wicks or outlines is also adjustable. Outside bars are mentioned e.g. by Michael Voigt in the book "Das große Buch der Markttechnik". All other candles are inner bars.
      Fibonacci Probability MT5
      Felipe Jose Costa Pereira
      Fibonacci Probability: The Power of Technical Analysis at Your Fingertips Transform your market analysis with the Fibonacci Probability Indicator, an essential tool for traders who wish to identify critical support and resistance levels with millimetric precision. Developed based on the principles of the Fibonacci sequence, this indicator offers a comprehensive analysis of market movements, helping you make more informed and strategic decisions. Indicator Features: Precise Fibonacci Levels: Aut
      My Point MT5
      Claudia Ramona Angerer
      Diagnosis of major and minor pivot Trend detection with many signals Can be used in all symbols Can be used in all time frames Settings: Back Show: The number of candles it displays If you need any adjustments, or have any questions or suggestions, message me How to trade: Blue: sell signal Red: buy signal Blue and red at the same time: no signal Exit signal: Opposite signal
      ZigZagAllinOne
      Alberto Da Silva Lira
      Indicator focusing on the market's ZigZag, also adding 2 other already established indicators: Book of Offers and Balance Aggressor (Time & Trades), this indicator allows to detect the best price trigger (buy or sell) in the aggressions to the Book of Offers including filters important as Aggression in Candle. Recommended use on the Brazilian iBovespa B3, but it also serves in Forex as long as the assets have information from the Book, in the case of Forex it is not possible to use the Aggress
      Ultimate Oscillator
      Fernando Lahude Ritter
      Title : Ultimate Oscillator - Multi-Timeframe Momentum Indicator Description : Overview : The Ultimate Oscillator is a powerful and versatile technical analysis tool developed by renowned trader Larry Williams. This indicator is specially designed to capture market momentum across three different timeframes, providing a comprehensive view of the market's dynamics. Unlike traditional oscillators, which are confined to a single timeframe, the Ultimate Oscillator integrates short-term, medium-term,
      FREE
      This indicator uses a different approach from the previous version to get it's trendlines. This method is derived from Orchard Forex, and the process of making the indicator is demonstrated in there video   https://www.youtube.com/watch?v=mEaiurw56wY&t=1425s . The basic idea behind this indicator is it draws a   tangent line   on the highest levels and lowest levels of the bars used for calculation, while ensuring that the lines don't intersect with the bars in review (alittle confusing? I know
      FREE
      Knowledge of the strength and weakness of each currency is vital for every forex trader. Our   Currency Strength Meter indicator   measures the strength of eight major currencies (USD, EUR, GBP, CHF, JPY, CAD, AUD, NZD) by using the Relative Strength Index indicator, also known as RSI. The Currency Strength Meter indicator shows you, simply and quickly, when a currency is oversold, overbought, or in "normal area". This way, you can identify which currency is the strongest and the weakest. Our
      Hydra Trend Rider is a non-repainting, multi-timeframe trend indicator that delivers precise buy/sell signals and real-time alerts for high-probability trade setups. With its color-coded trend line, customizable dashboard, and mobile notifications, it's perfect for traders seeking clarity, confidence, and consistency in trend trading. Download the Metatrader 4 Version Message us here after purchase to get the Indicator Manual. Download Now! Offer valid only for next 10 Buyers. Price will increas
      *This product will update to latest version by much new ability in next day* *Current Price Of Product Is 69$ For Limited Time, Next Price Of Market Structure Is 99$* Introducing   Market Structure Break Out   for MT5 – Your Professional MSB and Unbroken Zone indicator  MT4 Version Is Available Too , Check It Here :  https://www.mql5.com/en/market/product/109958 This indicator is continuously being updated. We strive to provide highly accurate entry and exit points based on market structure. W
      NakaTrend
      Ricardo De Andrade Nakano
      2 (1)
      "Introducing NakaTrend: Your Ultimate Trend Detector for MetaTrader 5! Ready to revolutionize your trading experience? Meet NakaTrend, your go-to indicator for identifying trend changes with precision and ease. With NakaTrend, you'll never miss another opportunity to capitalize on market shifts. When a bullish trend emerges, NakaTrend signals it with a green dollar sign, prompting you to enter a buy order. And when the tide turns bearish, a red dollar sign appears, signaling the perfect momen
      FREE
      I recommend you to read the   product's blog  (manual) from start to end so that   it is clear from the beginning what the indicator offers. This multi time frame and multi symbol indicator identifies when the stochastics signal line crosses the stochastics main line. As an alternative it can also alert when stochastics is leaving (without signal line crossing main line) an overbought/oversold area. As a bonus it can also scan for Bollinger bands and RSI overbought/oversold crosses. Combined wi
      I  recommend you to read the   product's blog  (manual) from start to end so that it is clear from the beginning what the indicator offers. This multi time frame and multi symbol indicator scans for Pin bars, Morning/evening stars, Engulfings, Tweezers, Three Line Strikes, Inside bars and Pennants and Triangles.  The indicator can also be used in single chart mode. Please read more about this option in the product's   blog . Combined with your own rules and techniques, this indicator will allow
      I recommend you to read the   product's blog  (manual) from start to end so that it is clear from the beginning what the indicactor offers. This multi time frame and multi symbol divergence dashboard indicator sends an alert when one or two different divergences have been identified. It can be used with all time frames from M1 to MN. Maximum 9 time frames can be shown in the dashboard at the same time. It is possible to enable moving average, RSI or Bollinger bands trend filter to filter out on
      Rocket Trend
      Andriy Sydoruk
      The Rocket Trend indicator is trending. The indicator draws two-color points connected by lines along the chart. This is a trend indicator, it is an algorithmic indicator. It is easy to work and understand when a blue circle appears, you need to buy, when a red one appears, sell. The indicator is used for scalping and pipsing, and has proven itself well. Rocket Trend is available for analyzing the direction of the trend for a specific period of time. Ideal for novice traders learning the laws o
      KT Fisher Transform MT5
      KEENBASE SOFTWARE SOLUTIONS
      KT Fisher Transform is an advanced version of the original Fisher Transform oscillator equipped with divergence detection, crossover alerts, and many more features. Originally it was developed by John F. Ehlers. It converts the asset's price into a Gaussian normal distribution to find the local extremes in a price wave.  Features A light-weighted oscillator that efficiently identifies the upward and downward crossovers and marks them using vertical lines. It also finds regular and hidden diverg
      Heat Map Pro mt5
      Augusto Martins Lopes
      Heat Map Indicator - Advanced Volume Analysis Introducing the Heat Map Indicator - A Professional Tool for Market Volume Analysis! **Key Features** **Visual Heat Map** - Instant volume intensity visualization through colors - Blue: Low volume - Green: Medium volume - Yellow/Orange: Increasing volume - Red: High volume **Intuitive Interface** - Dynamic color scale - Real-time percentage indicator - Current level indicator - Customizable colors and transparency **Smart Alert System** - Custo
      This indicator is based on Mr. Mark Fisher's ACD strategy, based on the book "The Logical Trader." - OR lines - A lines - C lines - Daily pivot range - N days pivot range - Customizable trading session - Drawing OR with the desired time Drawing levels A and C based on daily ATR or constant number - Possibility to display daily and last day pivots in color zone - Displaying the status of daily PMAs (layer 4) in the corner of the chart - Show the order of daily pivot placement with multi-day piv
      FREE
      Ali Levels Pro is an indicator designed to identify and draw levels of interest including: Opening Range High/Low with seconds precision,  Previous Session High/Low (if you are a Intraday trader who trades Indices or Commodities maybe you want to know yesterday New York Session high and low),  Overnight Session High/Low,  Previous Day High/Low,  Previous Week High/Low, and  Previous Month High/Low. Traders use this levels as support and resistance levels.  By searching for confluences between
      Welcome to the Provlepsis Indicator "Provlepsis" is a highly advanced indicator designed for the MQL Market. By analyzing previous bars with the same time of the day, it accurately calculates the potential range of market movement, providing valuable insights into future price fluctuations. Unlike the traditional ATR indicator, "Provlepsis" takes into account the time factor, resulting in a more powerful tool that adapts to different market conditions. During nighttime, the indicator predict
      FREE
      How many times have you looked for a PIVOT that works on a specific timeframe every day? Many traders like to estimate the direction of the day's trend based on a specific time interval every day, such as from 2 hours before the NYSE opens to 1 hour after, or from the NYSE opens to 30 minutes after. This indicator allows you to specify a certain time interval (hour and minute) and plots a pivot from that interval to the next day in the same time interval. It shows five lines based on this: me
      Buyers of this product also purchase
      Trend Screener Pro MT5
      STE S.S.COMPANY
      4.85 (82)
      Unlock the Power of Trends Trading with the Trend Screener Indicator: Your Ultimate Trend Trading Solution powered by Fuzzy Logic and Multi-Currencies System! Elevate your trading game with the Trend Screener, the revolutionary trend indicator designed to transform your Metatrader into a powerful Trend Analyzer. This comprehensive tool leverages fuzzy logic and integrates over 13 premium features and three trading strategies, offering unmatched precision and versatility. LIMITED TIME OFFER : Tre
      Divergence Bomber
      Ihor Otkydach
      5 (4)
      Each buyer of this indicator also receives the following for free: The custom utility "Bomber Utility", which automatically manages every trade, sets Stop Loss and Take Profit levels, and closes trades according to the rules of this strategy Set files for configuring the indicator for various assets Set files for configuring Bomber Utility in the following modes: "Minimum Risk", "Balanced Risk", and "Wait-and-See Strategy" A step-by-step video manual to help you quickly install, configure, and s
      Algo Pumping
      Ihor Otkydach
      5 (11)
      PUMPING STATION – Your Personal All-inclusive strategy Introducing PUMPING STATION — a revolutionary Forex indicator that will transform your trading into an exciting and effective activity! This indicator is not just an assistant but a full-fledged trading system with powerful algorithms that will help you start trading more stable! When you purchase this product, you also get FOR FREE: Exclusive Set Files: For automatic setup and maximum performance. Step-by-step video manual: Learn how to tr
      Golden Trend Indicator MT5
      Noha Mohamed Fathy Younes Badr
      4.89 (18)
      Golden Trend indicator  is The best indicator for predicting trend movement this indicator never lags and never repaints and never back paints    and give  arrow buy and sell    before the candle appear  and it will help you and  will make your trading decisions clearer its work on all currencies and  gold and crypto and all time frame This unique  indicator uses very secret algorithms to catch the  trends, so you can trade using this indicator and see the trend clear on charts  manual guide and
      TPSproTREND PrO MT5
      Roman Podpora
      4.72 (18)
      Entry points at the bar close,  without redrawing .  Trend scanner  across all assets,  MTF - mode  and much more in one tool. We recommend using it together with   RFI LEVELS. ИНСТРУКЦИЯ RUS   /   INSTRUCTIONS  ENG         /         VERSION MT4   Main functions: Accurate entry signals WITHOUT REPAINTING! Once a signal appears, it remains valid! This is a significant distinction from repainting indicators that might provide a signal and then alter it, potentially leading to deposit losses. Now,
      TPSpro RFI Levels MT5
      Roman Podpora
      4.55 (20)
      Reversal zones / Peak volumes / Active zones of a major player =  TS TPSPROSYSTEM INSTRUCTIONS RUS  /  INSTRUCTIONS   ENG          /       Version MT4 Every buyer of this indicator additionally receives FREE: 3 months of access to trading signals from the RFI SIGNALS service - ready-made entry points according to the TPSproSYSTEM algorithm. Training materials with regular updates - immerse yourself in strategy and grow your professional level. 24/5 support on weekdays and access to a closed tra
      Gold Stuff mt5
      Vasiliy Strukov
      4.93 (179)
      Gold Stuff mt5 is a trend indicator designed specifically for gold and can also be used on any financial instrument. The indicator does not redraw and does not lag. Recommended time frame H1. Contact me immediately after the purchase to get   personal bonus!  You can get a free copy of our Strong Support and Trend Scanner indicator, please pm. me! Settings  and manual   here  Please note that I do not sell my EA's or special sets on telegram, it is only available on Mql5 and my set files are on
      Support And Resistance Screener Breakthrough unique Solution With All Important levels analyzer and Markets Structures Feature Built Inside One Tool ! Our indicator has been developed by traders for traders and with one Indicator you will find all Imporant market levels with one click. LIMITED TIME OFFER : Support and Resistance Screener Indicator is available for only 50 $ and lifetime. ( Original price 125$ ) (offer extended) The available tools ( Features ) in our Indicator are :  1. HH-LL S
      RelicusRoad Pro MT5
      Relicus LLC
      4.79 (19)
      **Works Best On Live - On Demo Mode The Dashboard Doesn't Work** How many times have you bought a trading indicator with great back-tests, live account performance proof with fantastic numbers and stats all over the place but after using it, you end up blowing your account? You shouldn't trust a signal by itself, you need to know why it appeared in the first place, and that's what RelicusRoad Pro does best! User Manual + Strategies + Training Videos + Private Group with VIP Access + Mobile Vers
      Quantum TrendPulse
      Bogdan Ion Puscasu
      5 (13)
      Introducing Quantum TrendPulse , the ultimate trading tool that combines the power of SuperTrend , RSI , and Stochastic into one comprehensive indicator to maximize your trading potential. Designed for traders who seek precision and efficiency, this indicator helps you identify market trends, momentum shifts, and optimal entry and exit points with confidence. Key Features: SuperTrend Integration: Easily follow the prevailing market trend and ride the wave of profitability. RSI Precision: Detect
      Matrix Arrow Indicator MT5
      Juvenille Emperor Limited
      5 (13)
      Matrix Arrow Indicator MT5  is a unique 10 in 1 trend following   100% non-repainting  multi-timeframe indicator that can be used on all symbols/instruments:   forex,   commodities,   cryptocurrencies,   indices,   stocks .  Matrix Arrow Indicator MT5  will determine the current trend at its early stages, gathering information and data from up to 10 standard indicators, which are: Average Directional Movement Index (ADX) Commodity Channel Index (CCI) Classic Heiken Ashi candles Moving Average
      FX Power MT5 NG
      Daniel Stein
      5 (15)
      FX Power: Analyze Currency Strength for Smarter Trading Decisions Overview FX Power is your go-to tool for understanding the real strength of currencies and Gold in any market condition. By identifying strong currencies to buy and weak ones to sell, FX Power simplifies trading decisions and uncovers high-probability opportunities. Whether you’re looking to follow trends or anticipate reversals using extreme delta values, this tool adapts seamlessly to your trading style. Don’t just trade—trade
      FX Volume MT5
      Daniel Stein
      4.82 (17)
      FX Volume: Experience Genuine Market Sentiment from a Broker’s Perspective Quick Overview Looking to elevate your trading approach? FX Volume provides real-time insights into how retail traders and brokers are positioned—long before delayed reports like the COT. Whether you’re aiming for consistent gains or simply want a deeper edge in the markets, FX Volume helps you spot major imbalances, confirm breakouts, and refine your risk management. Get started now and see how genuine volume data can
      ***  Entry In The Zone and SMC Multi Timeframe is a realtime market analysis tool based on the Smart Money Concept (SMC). It effectively integrates reversal signals and automatically identifies key reversal zones through Multi Timeframe Structure Detection, along with the identification of Points of Interest (POI). This tool is designed to help traders plan and make decisions with greater confidence and a more structured approach. *** Features include : - Automated market structure detection (B
      FX Levels MT5
      Daniel Stein
      5 (4)
      FX Levels: Exceptionally Accurate Support & Resistance for All Markets Quick Overview Looking for a reliable way to pinpoint support and resistance levels across any market—currencies, indices, stocks, or commodities? FX Levels merges our traditional “Lighthouse” method with a forward-thinking dynamic approach, offering near-universal accuracy. By drawing from real-world broker experience and automated daily plus real-time updates, FX Levels helps you identify reversal points, set profit targe
      MetaBands M5
      Vahidreza Heidar Gholami
      4.5 (2)
      MetaBands uses powerful and unique algorithms to draw channels and detect trends so that it can provide traders with potential points for entering and exiting trades. It’s a channel indicator plus a powerful trend indicator. It includes different types of channels which can be merged to create new channels simply by using the input parameters. MetaBands uses all types of alerts to notify users about market events. Features Supports most of the channel algorithms Powerful trend detection algorith
      Atomic Analyst MT5
      Issam Kassas
      4.32 (19)
      First of all Its worth emphasizing here that this Trading Indicator is   Non-Repainting   , Non Redrawing and Non Lagging Indicator   Indicator, Which makes it ideal from both manual and robot trading.  User manual: settings, inputs and strategy . The Atomic Analyst  is a PA Price Action Indicator that uses Strength and Momentum of the price to find a better edge in the market. Equipped with Advanced filters which help remove noises and false signals, and Increase Trading Potential. Using Multi
      First of all Its worth emphasizing here that this Trading Tool is Non Repainting , Non Redrawing and Non Lagging Indicator , Which makes it ideal for professional trading . Online course, user manual and demo. The Smart Price Action Concepts Indicator is a very powerful tool for both new and experienced traders . It packs more than 20 useful indicators into one , combining advanced trading ideas like Inner Circle Trader Analysis and Smart Money Concepts Trading Strategies . This indicator focus
      MonetTrend — Премиум-индикатор для торговли по тренду (M30, H1, H4) MonetTrend — это мощный и визуально понятный трендовый индикатор, созданный для торговли на таймфреймах M30, H1 и H4. Он идеально подходит для работы с волатильными инструментами, такими как: • Золото (XAUUSD) • Криптовалюты (BTCUSD) • Валютные пары (EURUSD, USDJPY и др.) Ключевые особенности MonetTrend: • Автоматическое отображение Take Profit 1 (TP1) и Stop Loss (SL): После появления сигнала индикатор сразу показывает: • TP
      Trade smarter, not harder: Empower your trading with Harmonacci Patterns This is arguably the most complete harmonic price formation auto-recognition indicator you can find for the MetaTrader Platform. It detects 19 different patterns, takes fibonacci projections as seriously as you do, displays the Potential Reversal Zone (PRZ) and finds suitable stop-loss and take-profit levels. [ Installation Guide | Update Guide | Troubleshooting | FAQ | All Products ] It detects 19 different harmonic pri
      IX Power MT5
      Daniel Stein
      4.86 (7)
      IX Power: Unlock Market Insights for Indices, Commodities, Cryptos, and Forex Overview IX Power is a versatile tool designed to analyze the strength of indices, commodities, cryptocurrencies, and forex symbols. While FX Power offers the highest precision for forex pairs by leveraging all available currency pair data, IX Power focuses exclusively on the underlying symbol’s market data. This makes IX Power an excellent choice for non-forex markets and a reliable option for forex charts when deta
      ICT, SMC, SMART MONEY CONCEPTS, SMART MONEY, Smart Money Concept, Support and Resistance, Trend Analysis, Price Action, Market Structure, Order Blocks, BOS/CHoCH,   Breaker Blocks ,  Momentum Shift,   Supply&Demand Zone/Order Blocks , Strong Imbalance, HH/LL/HL/LH,    Fair Value Gap, FVG, Invert FVG, IFVG,  Premium  &   Discount   Zones, Fibonacci Retracement, OTE, Buy Side Liquidity, Sell Side Liquidity, BSL/SSL Taken, Equal Highs & Lows, MTF Dashboard, Multiple Time Frame, Big Bar, HTF OB, HTF
      MONEYTRON – ТВОЙ ЛИЧНЫЙ СИГНАЛ НА УСПЕХ! XAUUSD | AUDUSD | USDJPY | BTCUSD Поддержка таймфреймов: M5, M15, M30, H1 Почему трейдеры выбирают Moneytron? 82% успешных сделок — это не просто цифры, это результат продуманной логики, точного алгоритма и настоящей силы анализа. Автоматические сигналы на вход — не нужно гадать: когда покупать, когда продавать. 3 уровня Take Profit — ты сам выбираешь свой уровень прибыли: безопасный, уверенный или максимум. Четкий Stop Loss — контролируешь риск
      FX Dynamic: Track Volatility and Trends with Customized ATR Analysis Overview FX Dynamic is a powerful tool that leverages Average True Range (ATR) calculations to give traders unparalleled insights into daily and intraday volatility. By setting up clear volatility thresholds—such as 80%, 100%, and 130%—you can quickly identify potential profit opportunities or warnings when markets exceed typical ranges. FX Dynamic adapts to your broker’s time zone, helps you maintain a consistent measure of
      Special offer : ALL TOOLS , just $35 each! New tools   will be   $30   for the   first week   or the   first 3 purchases !  Trading Tools Channel on MQL5 : Join my MQL5 channel to update the latest news from me Unlock the power of ICT’s Inversion Fair Value Gap (IFVG) concept with the Inversion Fair Value Gaps Indicator ! This cutting-edge tool takes Fair Value Gaps (FVGs) to the next level by identifying and displaying Inverted FVG zones—key areas of support and resistance formed after price m
      Blahtech Supply Demand MT5
      Blahtech Limited
      4.54 (13)
      Was: $299  Now: $149  Supply Demand uses previous price action to identify potential imbalances between buyers and sellers. The key is to identify the better odds zones, not just the untouched ones. Blahtech Supply Demand indicator delivers functionality previously unavailable on any trading platform. This 4-in-1 indicator not only highlights the higher probability zones using a multi-criteria strength engine, but also combines it with multi-timeframe trend analysis, previously confirmed swings
      This dashboard shows the latest available   harmonic patterns   for the selected symbols, so you will save time and be more efficient /   MT4 version . Free Indicator:   Basic Harmonic Pattern Comparison of "Basic Harmonic Pattern" vs. "Basic Harmonic Patterns Dashboard" Indicators Feature Basic Harmonic Pattern Basic Harmonic Patterns Dashboard Functionality Detects and displays harmonic patterns on a single chart Searches multiple symbols and timeframes for harmonic patterns, displays res
      First of all Its worth emphasizing here that this Trading System is Non-Repainting   , Non Redrawing and Non Lagging Indicator Which makes it ideal from both manual and robot trading .  Online course, manual and download presets. The Smart Trend Trading System MT5 is a comprehensive trading solution tailored for new and experienced traders . It combines over 10 premium indicators and features more than 7 robust trading strategies , making it a versatile choice for diverse market conditions . Tre
      First of all, it's worth emphasizing that this Trading Indicator is Non-Repainting, Non-Redrawing, and Non-Lagging, which makes it ideal for both manual and algorithmic trading. User manual, presets, and online support included. The AI Trend Pro Max is a sophisticated, all-in-one trading system designed for traders who seek precision , power , and simplicity . Built upon years of development through previous indicators, and this is the most advanced version yet — equipped with multiple signal la
      - Real price is 80$ - 40% Discount (It is 49$ now) - Lifetime update free Contact me for instruction, any questions! Related Product:  Gold Trade Expert MT5 - Non-repaint - I just sell my products in Elif Kaya Profile, any other websites are stolen old versions, So no any new updates or support. Introduction The breakout and retest strategy is traded support and resistance levels. it involves price breaking through a previous level.  The break and retest strategy is designed to help traders do
      More from author
      I recommend you to read the   product's blog  (manual) from start to end so that it is clear from the beginning what the indicactor offers. This multi time frame and multi symbol divergence dashboard indicator sends an alert when one or two different divergences have been identified. It can be used with all time frames from M1 to MN. Maximum 9 time frames can be shown in the dashboard at the same time. It is possible to enable moving average, RSI or Bollinger bands trend filter to filter out on
      I recommend you to read the   product's blog  (manual) from start to end so that   it is clear from the beginning what the indicator offers. The indicator identifies when a divergence occurs between price and an oscillator/indicator. It identifies both regular and hidden divergences. It has a RSI, Bollinger Bands and ATR filter options which makes it possible to filter out only the strongest setups. The indicator also offers options to wait for an Engulfing formation, Donchian channel breakout,
      The indicator identifies when a divergence occurs between price and an indicator or oscillator. It identifies both regular and hidden divergences. Combined with your own rules and techniques, this indicator will allow you to create (or enhance) your own powerful system. For higher probability setups I can recommend you to use my Supply Demand indicator and trade only if the divergence occurs inside a zone. Supply zone for bearish div and demand zone for bullish div. The optimal scenario is if it
      FREE
      Please if possible consider buying the   MT5 version  which at the moment offers more functionaIity. I also recommend you to read the   product's blog  (manual) from start to end so that it is clear from the beginning what the indicator offers. This supply and demand zone indicator draws the zones on the chart and sends alerts when the price has reached or broken a zone. It is also possible to use it to be alerted about regular double tops/bottoms instead of zones. It is possible to use RSI, vo
      This indicator draws supply and demand zones on the chart. Combined with your own rules and techniques, this indicator will allow you to create (or enhance) your own powerful system. Please also check out the paid version which offers much more. My recommendation is to look for trading opportunities where the first zone test occurs after at least 25 bars. Features The zones have 3 colors (adjustable by input). Dark color for untested zone, medium for tested zone and light for broken zone . The p
      FREE
      I recommend you to read the  product's blog  (manual) from start to end so that it is clear from the beginning what the EA offers. This Expert Advisor identifies when a divergence occurs between price and an oscillator/indicator. It identifies both regular/classical (trend reversal) and hidden (trend continuation) divergences. It has supply/demand zone, RSI, bollinger, stochastics, moving average (regular MA and Hull MA), ADX and volume filter options which makes it possible to filter out only
      This multi indicator/oscillator (hereafter indicator), multi time frame and multi symbol indicator identifies when a divergence occurs between price and one, two or three indicators. It identifies both regular/classical (trend reversal) and hidden (trend continuation) divergences. It has RSI and MA trend filter options which makes it possible to filter out only the strongest setups. Combined with your own rules and techniques, this indicator will allow you to create (or enhance) your own powerfu
      This indicator draws supply and demand zones on the chart. Combined with your own rules and techniques, this indicator will allow you to create (or enhance) your own powerful system. Please also check out the   paid version   which offers much more. My recommendation is to look for trading opportunities where the first zone test occurs after at least 25 bars. Features The zones have 3 colors (adjustable by input). Dark color for untested zone, medium for tested zone   and light for broken zone .
      FREE
      This indicator can send alerts when a Heiken Ashi Smoothed color change occurs. Combined with your own rules and techniques, this indicator will allow you to create (or enhance) your own powerful system. Features Can send all types of alerts. Option to delay the alert one or more bars in order to confirm the color (trend) change. Input parameters Candle shift for alert: Default is 1. Setting it to 0 will alert you on color change on the current candle. This should be regarded as a pending (uncon
      FREE
      This indicator recognizes a special type of Inside Bar formation which is formed by a big Master candle followed by 4 smaller candles (please see the strategy explanation below). Features Plots buy/sell stop lines on the chart as well as well as take profit and stop loss levels. The TP/SL levels are based on the Average True Range (ATR) indicator. Object colors are changeable. Sends you a real-time alert when a Master candle formation is identified - sound / popup / email / push notification. On
      Please if possible consider buying the MT5 version   which at the moment offers more functionaIity . I also recommend you to read the product's blog  (manual) from start to end so that it is clear from the beginning what the EA offers. This Expert advisor's (EA) main strategy is to place trades when 3 moving averages (MA) are in consecutive alignment and at a certain distance from each other (it can be used for instance for a not very well known strategy used by some institutional traders, whic
      The indicator identifies when a divergence occurs between price and an indicator or oscillator. It identifies bullish and bearish hidden or regular (classical) divergences. Combined with your own rules and techniques, this indicator will allow you to create (or enhance) your own powerful system. For higher probability setups I can recommend you to use my  Supply Demand indicator  and trade only if the divergence occurs inside a zone. Supply zone for bearish div and demand zone for bullish div. T
      FREE
      This indicator can send alerts when a Heiken Ashi Smoothed color change occurs. Combined with your own rules and techniques, this indicator will allow you to create (or enhance) your own powerful system. Features Can send all types of alerts. Option to delay the alert one bar in order to confirm the color (trend) change. Input parameters Wait for candle close: 'true' or 'false'. Setting it to 'true' will delay the alert to the opening of the bar following the bar where the color change occurred.
      FREE
      I recommend you to read the   product's blog  (manual) from start to end so that it is clear from the beginning what the indicactor offers. This multi time frame and multi symbol indicator identifies double or triple top/bottom formations or a following neckline breakout (confirmed top/bottom). It offers filters for RSI overbought/oversold, candle patterns (pin bar, engulfing, tweezer, morning/evening star, three line strike) and divergences (MACD, OsMA, Awesome (AO), RSI, CCI, Stochastic) whic
      Divergence dashboard
      Jan Flodin
      4.64 (11)
      I recommend you to read the   product's blog  (manual) from start to end so that it is clear from the beginning what the indicactor offers. This multi time frame and multi symbol divergence dashboard indicator sends an alert when one or two different divergences have been identified. It can be used with all time frames from M1 to MN. It is possible to enable moving average or RSI trend filter to filter out only the strongest setups. It should be combined with your own confirmation rules, techni
      I recommend you to read the   product's blog  (manual) from start to end so that   it is clear from the beginning what the indicator offers. This multi time frame and multi symbol indicator identifies double top/bottom, head & shoulder, pennant/triangle and flag patterns. It is also possible to setup alerts only when a neckline/triangle/flagpole breakout has occured (neckline breakout = confirmed signal for top/bottoms and head & shoulders). The indicator can also be used in single chart mode.
      I  recommend you to read the   product's blog  (manual) from start to end so that it is clear from the beginning what the indicator offers. This multi time frame and multi symbol indicator scans for Pin bars, Morning/evening stars, Engulfings, Tweezers, Three Line Strikes, Inside bars and Pennants and Triangles.  The indicator can also be used in single chart mode. Please read more about this option in the product's   blog . Combined with your own rules and techniques, this indicator will allow
      I recommend you to read the   product's blog  (manual) from start to end so that it is clear from the beginning what the indicactor offers. This multi time frame and multi symbol indicator identifies double or triple top/bottom formations or a following neckline breakout (confirmed top/bottom). It offers RSI, pin bar, engulfing, tweezer, morning/evening star filters as well divergence filter options which makes it possible to filter out only the strongest setups. The indicator can also be used
      This multi time frame and multi symbol indicator scans for pin bars. Combined with your own rules and techniques, this indicator will allow you to create (or enhance) your own powerful system. Features Can monitor all symbols visible in your Market Watch window at the same time. Apply the indicator to just one chart and instantly monitor the entire market. Can monitors every time frame, from M1 to MN, and sends you a real-time alert when a pin bar is identified. All Metatrader native alert types
      This multi symbol dashboard indicator can send an alert when a strong trend has been identified. It can do so by building up the dashboard using the following indicators/oscillators (hereafter only mentioned as incdicators): RSI, Stochastics, ADX, CCI, MACD, WPR (Williams Percent Range, also called as Williams %R), ROC (Price Rate of Change) and Ultimate oscillator. It can be used with all time frames from M1 to MN (it can only show 1 time frame at a time). It gives you perspectives on momentum,
      I recommend you to read the product's blog  (manual) from start to end so that it is clear from the beginning what the EA offers. This Expert advisor's (EA) main strategy is to place trades when 3 moving averages (MA) are in consecutive alignment and at a certain distance from each other (it can be used for instance for a not very well known strategy used by some institutional traders, which involves the MAs 10, 20 and 30 on the D1 time frame). The EA works best on H1 and larger time frames. Th
      This cost averaging Expert advisor (EA) places additional trades in the same direction as the original (manually opened) order when the price goes against you. It can be used as a grid system or as pure martingale system (exponential increasing of lot size) or smoothed martingale (for instance linear increasing of the lot size). Due to the risk involved, this EA is more suitable for intermediate to advanced traders who are well aware of how to handle risk management and trading an already profit
      This multi symbol indicator has been designed to automatically identify when price reaches major psychological levels. Also known as round numbers, whole numbers or key levels. As a bonus it can also scan for pivot point level on one selected time frame. Combined with your own rules and techniques, this indicator will allow you to create (or enhance) your own powerful system. Features Can write the signals to a file which can be used by an Expert Advisor for auto trading. Can monitor all symbols
      This multi time frame and multi symbol indicator identifies high-probability breakout patterns. It does this by identifying strong, symmetrical pennants and triangles. This pattern DOES NOT appear very often on higher time frames. But when it does, it is a very high-probability setup. The indicator also includes an Inside bars scanner. It can for example be used to detect a special type of Inside bars formation which is formed by a Master candle (MC) followed by 4 inside candles (please see the
      Features This is an indicator that recognizes a special type of Inside Bar formation which is formed by a Master candle followed by 4 smaller candles (please see the strategy explanation below). Plots buy/sell stop lines on the chart as well as well as take profit and stop loss levels. The TP/SL levels are based on the Average True Range (ATR) indicator. Object colors are changeable. Sends you a real-time alert when a Master candle formation is identified - sound / pop-up / email / push notifica
      This multi time frame and multi symbol indicator scans for pin bars. Combined with your own rules and techniques, this indicator will allow you to create (or enhance) your own powerful system. Features Can monitor all symbols visible in your Market Watch window at the same time. Apply the indicator to just one chart and instantly monitor the entire market. Can monitors every time frame, from M1 to MN, and sends you a real-time alert when a pin bar is identified. All Metatrader native alert types
      I  recommend you to read the   product's blog  (manual) from start to end so that it is clear from the beginning what the indicator offers. This multi time frame and multi symbol indicator scans for engulfing and tweezer formations. The indicator can also be used in single chart mode. Combined with your own rules and techniques, this indicator will allow you to create (or enhance) your own powerful system. Features Can monitor all symbols visible in your Market Watch window at the same time. Ap
      This multi time frame and multi symbol indicator scans for Pin bars, Morning/Evening stars, Engulfings, Tweezers, Three line strikes, Inside bars and Pennants and Triangles. The indicator can also be used in single chart mode. Please read more about this option in the product's blog . Combined with your own rules and techniques, this indicator will allow you to create (or enhance) your own powerful system. Features Can monitor all symbols visible in your Market Watch window at the same time. App
      I  recommend you to read the   product's blog  (manual) from start to end so that it is clear from the beginning what the indicator offers. This multi symbol and multi time frame indicator scans for the following candlestick patterns (please see screenshot for explanation of the patterns): Three white soldiers (reversal>continuation pattern) Three black crows (reversal>continuation pattern) Bullish and bearish Three line strike (reversal pattern) The patterns do not appear very often on higher
      I recommend you to read the   product's blog  (manual) from start to end so that it is clear from the beginning what the indicactor offers. This multi time frame and multi symbol indicator can identify the following 5 crosses: when a fast moving average crosses a slow moving average line. when price has reached a single moving average (closed above/below or just bounced). when a triple moving average formation has appeared (all 3 MA:s in consecutive alignment). when the MACD main line crosses t
      Filter:
      mGSrPCDi-j63QiG2Vdh0P
      31
      mGSrPCDi-j63QiG2Vdh0P 2025.04.11 19:01 
       

      Hello Jan, this is a good crossover indicator.

      Zeitl
      76
      Zeitl 2022.03.27 09:49 
       

      Outstanding MA crossover indicator, very versatile and reliable, highly recommended!

      Devonish
      3160
      Devonish 2021.01.15 07:14 
       

      Excellent tool. Friendly advice and support.

      MT5_Screener49
      52
      MT5_Screener49 2020.12.25 15:48 
       

      Hi Jan, A few months ago I installed your Moving average crossover scanner MT5. Initially it was working well, while recently the indicator disappeared from my charts and does not reinstall. Since a few days I cannot reload the indicator onto any of my charts, even new charts. When downloaded the indicator went by default in the “Navigator” window section “Market”. From there none of these (Market) indicators can be loaded. All other indicators are loaded as usual and working correctly. Is there a procedure to restore the Moving average crossover scanner MT5 ? Much thanks and kind regards, Jean

      AlianceTrad
      104
      AlianceTrad 2020.11.13 11:40 
       

      very good indicator I recommend :-) I purchased Multi oscillator divergence, very nice indicator ;-)

      Abdul Hakeem
      507
      Abdul Hakeem 2020.09.26 19:51 
       

      User didn't leave any comment to the rating

      Robby Wijaya
      226
      Robby Wijaya 2020.05.10 16:29 
       

      This indicator is great and really make the game more attractive, the developer also very helpful and responsive, thanks Mr.Flodin

      Maxwell Onyolu
      240
      Maxwell Onyolu 2020.05.03 02:23 
       

      Friendly Developer and a great tool to add to my trading arsenal!

      Reply to review
      Version 2.2 2024.12.04
      *** Please always make a backup of the existing indicator (the .ex5 file) before you make an update ***

      Change log:
      - added support for T3 moving average. Please be noted that the indicator will be slower when using this moving average
      Version 2.1 2024.08.27
      *** Please always make a backup of the existing indicator (the .ex5 file) before you make an update ***

      Change log:
      - added the possibility to set the item height and font size in the panel
      - added drawing of the trend MA line also when the trend MA time frame <> scanned time frame
      Version 2.0 2024.01.07
      *** Please always make a backup of the existing indicator (the .ex5 file) before you make an update ***

      Change log:
      - bug fix for the panel which in some cases got minimized
      - new additional input for symbols
      Version 1.9 2023.03.01
      *** Please always make a backup of the existing indicator (the .ex5 file) before you make the update ***

      Change log:
      - added the possibility in the triple MA strategy to allow the third MA to be above/below the second MA by setting the value in the new Strict input parameter to 'false'. Example: We have a triple MA setup with MA 5, 13 and 20. In the normal situation, for a bullish signal to be valid, MA 5 must be above both MA 13 and MA 20 and MA 13 must be above MA 20. In the non strict mode MA 20 is allowed to be above MA 13. Vice verse for a bearish signal.
      - added an option to write the signals as global variables instead of to a file
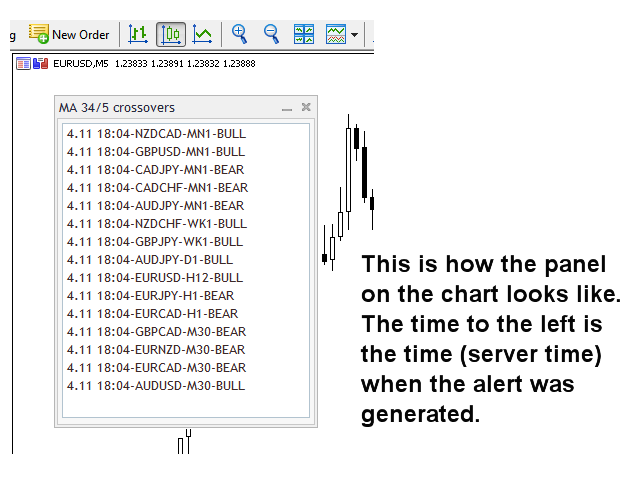
      - an arrow showing trade direction will now be drawn on the chart which opens up when clicking on a signal in the panel
      - added a possibility to use the indicator in single chart mode (checking only the current chart symbol and time frame). It will then draw the MA lines, MACD and an arrrow at each cross on the chart where the indicator is running. This option is in some ways limited though. More information in the product's blog.
      - added the possibility to set the colors in the panel
      Version 1.8 2020.09.23
      - added the possibility to add the MA lines and well as the MACD indicator on the chart which opens up when you click on a signal in the panel
      Version 1.7 2020.09.05
      *** Please always make a backup of the existing indicator (the .ex5 file) before you make an update ***

      This is not a mandatory update if everything is already working as it should.

      - added the possibility to add a custom text to the pop-up, push and mail alerts.
      - minor improvements
      Version 1.6 2019.11.20
      - added the possibility to write the signals in the panel to a file. Could for instance be used by an Expert Advisor for automatical trading. For instance this product: https://www.mql5.com/en/market/product/43820
      Version 1.5 2019.09.16
      Please always make a backup of the current indicator (the .ex4 file) before you make the update.
      The following changes have been made in this version:

      - added the possibility to enable a moving average major trend filter
      - added the possibility to scan for cases when the price has reached the second (slow) MA
      Version 1.2 2019.02.27
      - corrected the pop-up alert text for bounce alerts. Was showing the slow MA instead of fast MA.
      Version 1.1 2019.02.19
      - added a candle shift option for selecting the alert delay
      - added support for the Strategy tester
      Added MACD scanning:
      - alert at lines crossover (main line crosses signal line)
      - alert at zero(0) line cross
      - upon customer request I have changed the alert text to show it like fast MA/slow MA instead of slow MA/fast MA. For example 8/21 instead of 21/8.
      - added a smiley in the upper right corner of the chart showing that the indicator is up and running properly
      - added the possibility to set a custom panel title
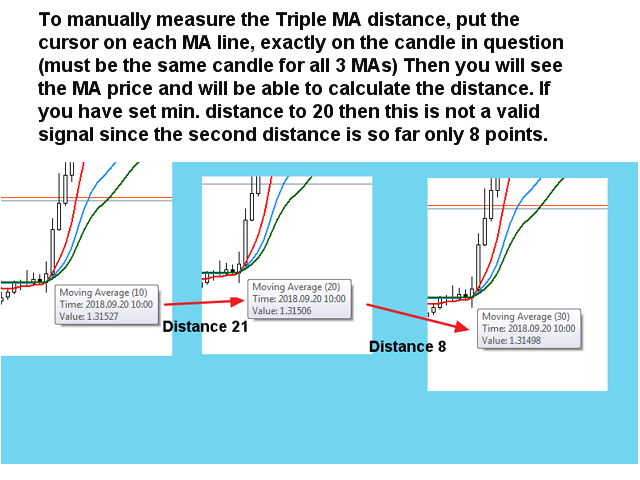
      - added the possibility to scan for triple MA crosses
      - added 2 different possibilities to scan for cases when the price has reached a single MA
      - added an option to use symbols from the Market Watch window instead of the symbols written in the Symbols parameter