Automatic Trendlines
- Indicators
- Pasi Hakamaki
- Version: 1.20
- Updated: 26 February 2021
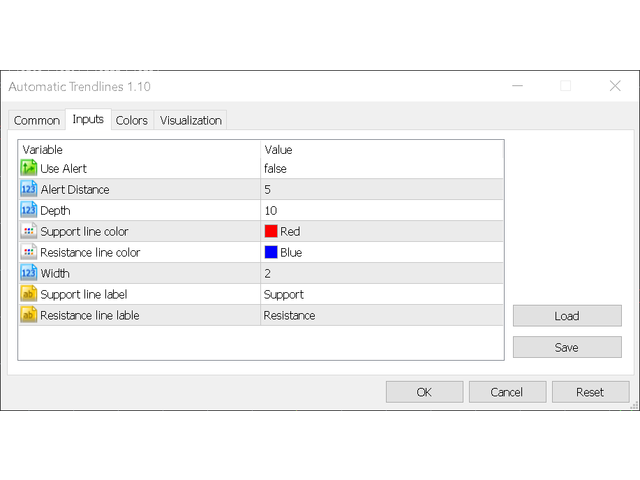
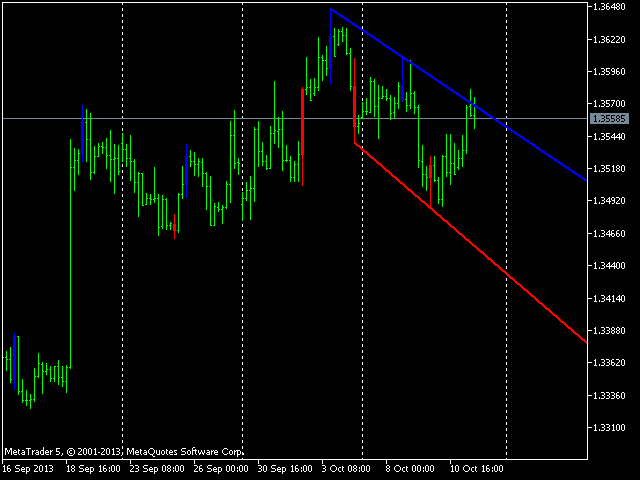
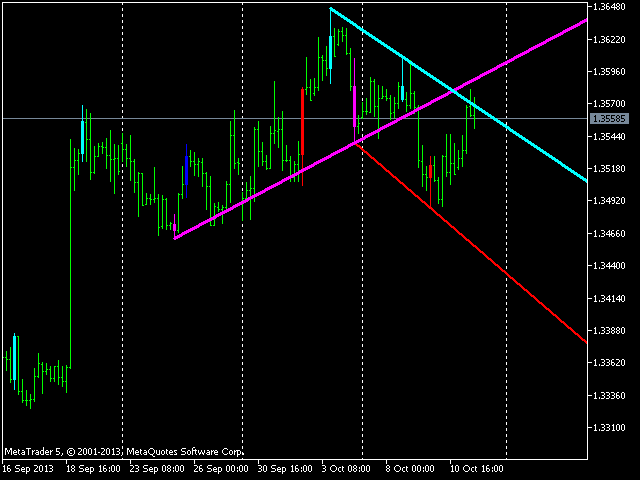
The indicator draws trendlines on chart. This indicator has six inputs. User can specify alternative labels for both lines. If multiple instances of the indicator are used, the labels must differ. User can set width and color of the lines and depth which specifies what significant peaks should be used. For example, Depth=10 sets trendlines using the current peaks and valleys that have at least 10 bars to the right and to the left and that have highs/lows less/greater than the peak's high/low. Indicator also paints previous peaks and valleys. Indicator additionally has an alert function that can be used to notify the user when price is at a preset distance from support/resistance line. Alert distance is set in pips.


Nice