Smarter Support and Resistance
- Indicators
- Moegamat Luqmaan Titus
- Version: 1.1
- Activations: 5
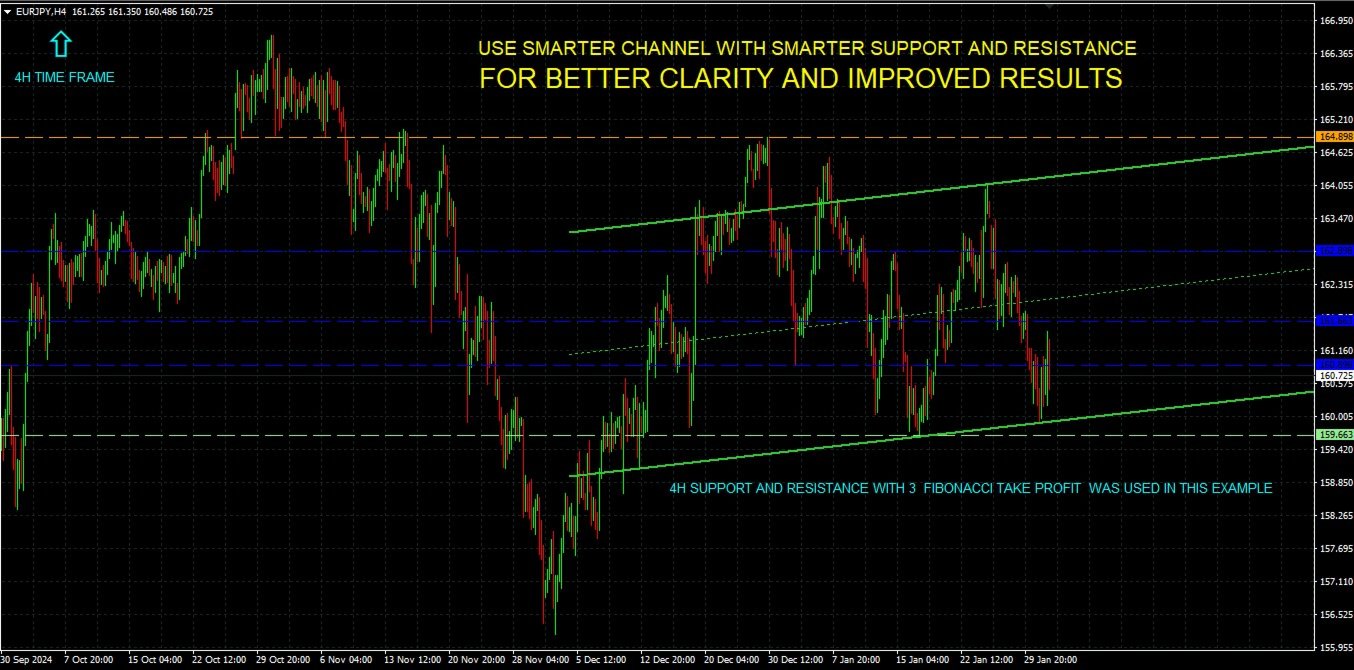
Smarter Support and Resistance Indicator
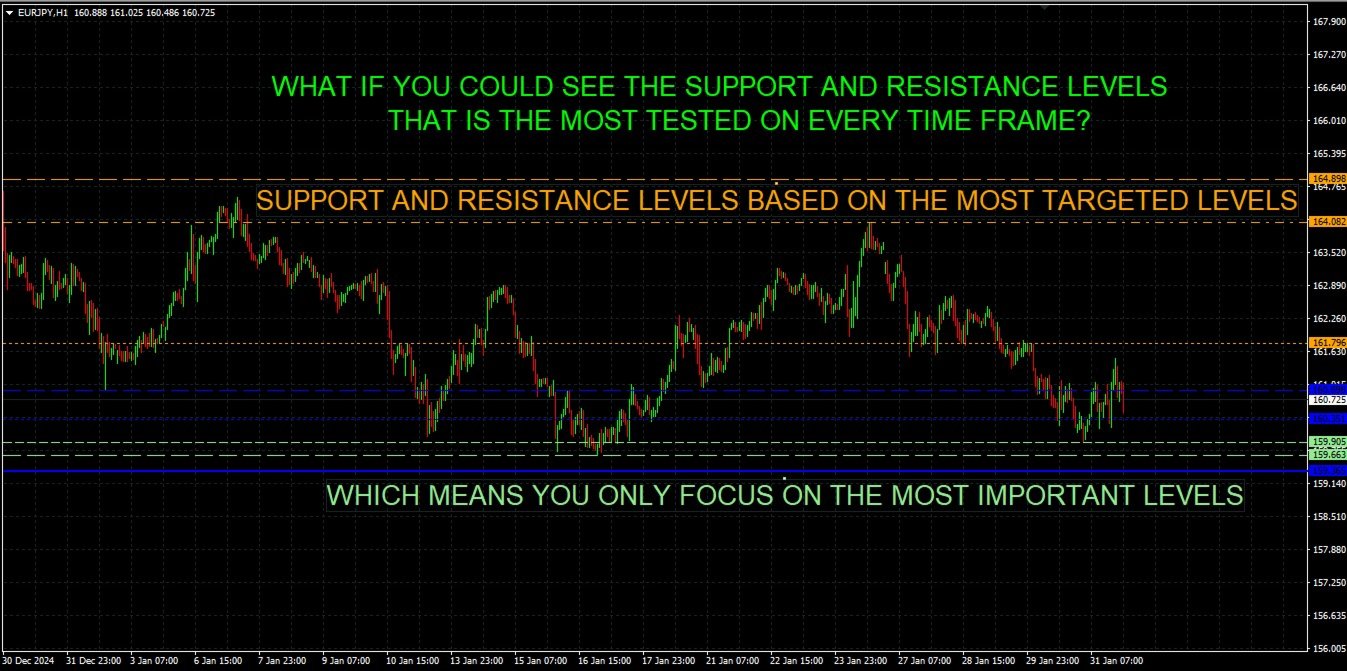
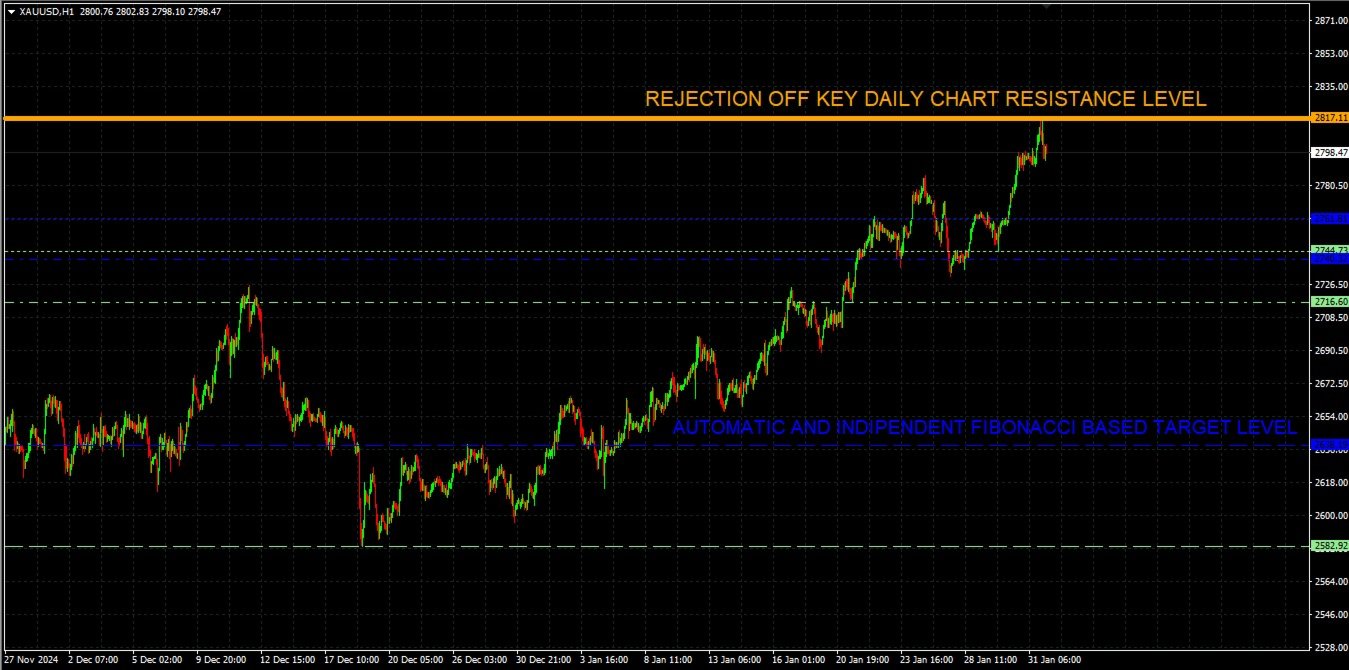
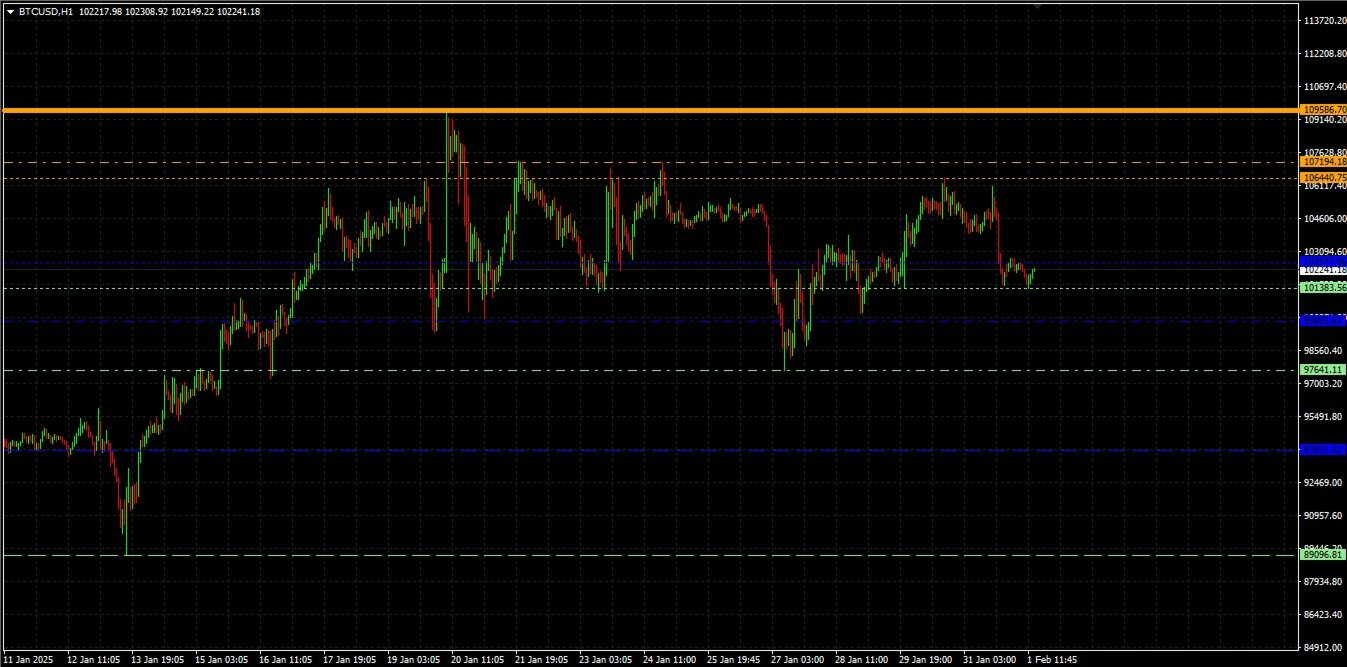
The Smarter Support and Resistance Indicator is designed to enhance your technical analysis by automatically identifying key support and resistance levels on multiple timeframes, helping traders make informed decisions. This tool efficiently calculates the highest and lowest price points over a specified lookback period based on the most tested levels then calculates the average of those levels to dynamically plot them on your chart. This means that the support and resistance levels generated are more reliable than most support and resistance indicators out there. It also integrates Fibonacci retracement levels as potential price targets for enhanced market forecasting which can also act as additional support or resistance levels.
Key Features:
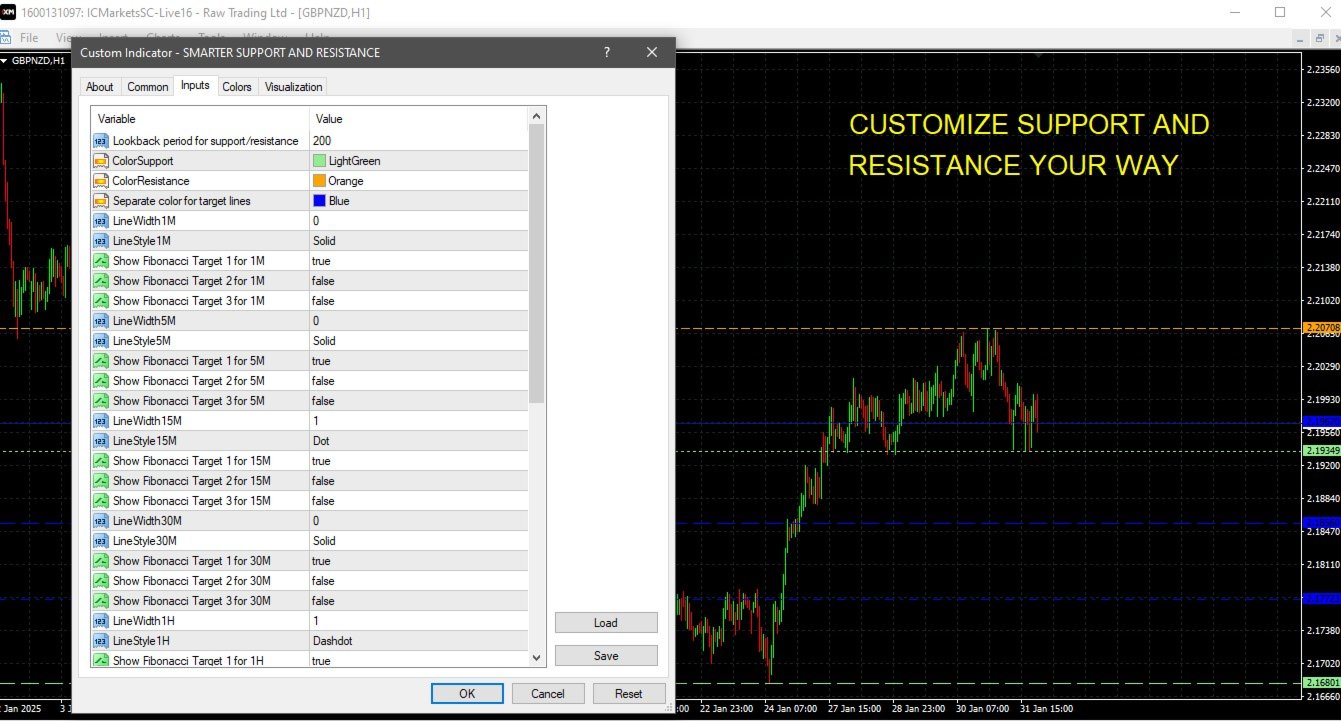
- Automatic Support and Resistance Levels: Identifies the most significant support and resistance levels over a lookback period (default: 200).
- Customizable Timeframes: Supports all major timeframes from 1-minute (M1) to monthly (MN1), allowing for precise level plotting on each timeframe.
- Flexible Line Customization: Customize line width, style, and color for support, resistance, and Fibonacci target levels to match your trading preferences.
- Fibonacci Targets: Automatically plots up to three Fibonacci-based target levels (23.6%, 38.2%, 61.8%) on each timeframe, with the option to toggle visibility.
- Multi-Period Support: The indicator updates support, resistance, and target lines for different timeframes, ensuring relevant data for every trading session.
- Enhanced Visualization: Easily view important levels with color-coded lines for support, resistance, and target levels. Supports distinct color options for a clear chart view.
- Optimized for Scalping and Swing Trading: Whether you're trading on lower timeframes like M1 or M5 or analyzing broader trends on the D1 or W1, this indicator caters to various trading styles.
Customization Options:
- Set custom line widths, styles, and visibility for each timeframe.
- Toggle Fibonacci targets on/off for each timeframe individually.
- Choose from multiple color options for support, resistance, and target levels for better chart organization.
Ideal for:
- Traders looking for automated support and resistance identification on any timeframe.
- Scalpers and swing traders who need quick, precise entry/exit signals based on key price levels.
- Traders who rely on Fibonacci retracement for trade setups and forecasting market movements.
This indicator simplifies the process of finding key levels and enhances your chart with visual aids, enabling better decision-making and faster trade execution.